Receive Focus insights straight to your inbox
In a recently published working paper, Bessembinder, Chen, Choi and Wei (2019) examine the performance of 62 000 stocks listed around the world from 1990 to 2018. The authors calculated the US dollar-weighted internal rate of return for every stock over that period, assuming investors had followed their rights.
The results are startling. From 1990 to 2018, 56% of stocks in the US and 61% of stocks outside of the US underperformed one-month US dollar Treasury bills. In effect, more than half of global equities underperformed cash over a 29-year time horizon. In South Africa, 67.4% of equities underperformed US cash in dollar terms. The old saying about “time in the market” would not have helped much if you’d held a portfolio with the wrong 50% of stocks.
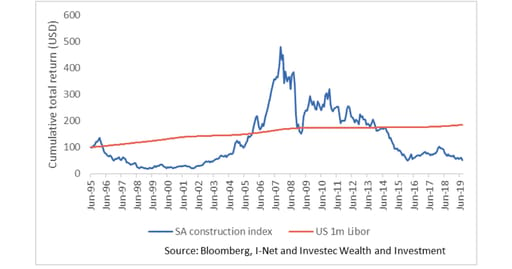
Construction stocks provide a case in point. From June 1995 to the end of July 2019, the SA construction index provided a total return of -2.1% a year in US dollar terms. US dollar one month-LIBOR, by comparison, returned 2.6% a year.
Not constructive: SA construction sector vs. US one-month money market returns
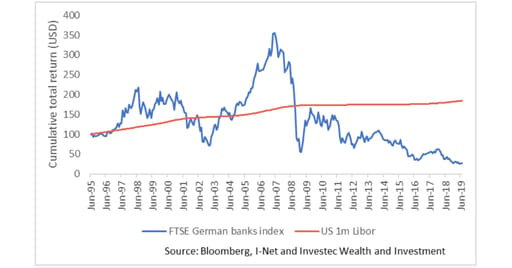
As Bessembinder et al.’s results show, SA is not unique. German banks have returned -5.3% per year in US dollars since June 1995. There is no shortage of stocks and sectors that have underperformed US cash over long periods.
Don’t bank on it: German banks vs. US one-month money market returns
The one percent
Bessembinder et al.’s second result is even more sobering. In aggregate, global equities created US$44.7 trillion of wealth relative to US cash between 1990 and 2018. All of this was attributable to the top 1.3% of firms. The remaining 98.7% of equities in aggregate gave returns equivalent to cash over the 29-year window.
In South Africa, only nine firms were responsible for 100% of the net wealth creation above US cash over the 29-year window. Tencent’s internal rate of return (IRR) for shareholders was 50.1% a year, the highest of the top 50 wealth creating firms in the world.
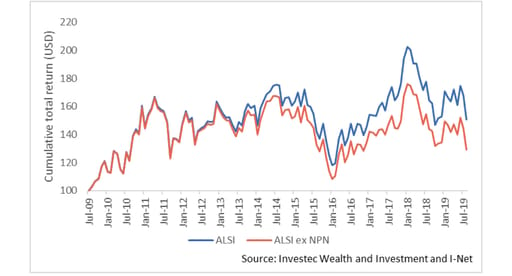
The impact of Naspers (which holds 31% of Tencent) alone on the South African market has been stark. Over the past decade, the All Share Index has returned 5.3% a year in US dollars. However if one strips out Naspers, this drops to 3.7% a year. Over the past five years, the All Share Index has returned 1% a year in US dollars, but if one strips out Naspers, the return drops to -1.25% a year.
A bet on Naspers
Lemons and rockets
The results highlight that there are two very contrasting risks in portfolio construction. The first is the risk of including a lemon that detracts from performance and causes permanent wealth loss. SA investors will be familiar with a few examples.
The second risk is less obvious over the short term but as important over the long term – the risk of leaving out a rocket.
The key then is to identify the rockets and ride them for long periods. This inherently requires sufficient patience to see through cyclical downswings. However, patience is necessary but not sufficient. If one had been patient without holding the top 1.3% of shares, one would still have simply generated cash returns over the long run.
Top performing stocks are characterised by their ability to consistently generate internal returns above their cost of capital. This requires what Warren Buffett refers to as moats – the ability to maintain competitive advantage – to fend off competitors and consistently generate high returns.
From a portfolio construction perspective, a disciplined focus on return on capital over cost of capital should build a sufficiently tight net to catch any top performers at an early stage. The key then, is to hold on long enough and cull any strong returning businesses that veer from the course.
There is a fine balance to be achieved: there should be enough stocks to increase the odds of catching a rocket, but not too many so as to average out the performance of the best performers. In equities, as in many sports, the performance of the aggregate is heavily dependent on a few star performances.
About the author

Chris Holdsworth
Investment strategist
Chris holds an MSc (Statistics) and is a CFA. He joined Investec in 2007 as a quantitative analyst for the institutional equities team. He started covering strategy from the beginning of 2013 and headed up the research team from 2017. At the beginning of 2019, he moved to the Wealth and Investment (SA) Team as Chief Investment Strategist. He is also a member of the Global Investment Strategy Group and Chair of the Global Sector View Group.


