
Aided by buoyant activity in the service sector, economic activity has continued to expand, although strains are apparent in manufacturing. One reason why, we suspect, is that pent-up demand for services was affordable by running down excess savings. This has largely run its course though, and the impact of past rate rises is biting increasingly, not just in residential investment but also in commercial real estate. That said, labour markets have merely cooled ‘at best’ to ‘hot rather than red hot’, and although it has abated, inflation in the main economies (outside China) is still very elevated. The upshot is that we see only the Fed as done with hiking policy rates, whereas the ECB and BoE will probably go a little further. Still, peak rates may be nearer than the market prices in for the UK if activity and inflation evolve as we expect.
There are currently three key macro/political drivers of US markets: the debt ceiling standoff, banking concerns and expectations of future Fed policy. Taking each in order, although a significant wedge appears to remain between the Democrats and Republicans, we still see a bipartisan deal to lift the debt ceiling as the most likely outturn. Were the US to pass the X-date without a deal however, we expect the Treasury to embark on large (and very unpopular!) expenditure savings to avoid the catastrophic consequences of a debt default. Meanwhile adding to the sense of unease in markets are the lingering banking concerns. We maintain our view that the US will avoid a protracted banking crisis, but expect credit conditions to tighten further, especially if CRE risks intensify. Then lastly on Fed policy, market pricing has been volatile of late, but there now seems to be a convergence towards our view that rate cuts by the Fed will not happen until the end of this year.
Euro area economic growth has proved more resilient than expected over the winter, the zone avoiding a recession thanks to a +0.1% rise in GDP in Q1. We now expect growth over 2023 and 2024 to be a little firmer than previously thought, our latest forecasts standing at 0.8% and 1.2% respectively. However, tighter credit conditions represent a downside risk to this view. Meanwhile although headline inflation has peaked, the stickiness of core HICP remains a concern for the ECB. We believe this will lead to two further 25bps hikes, delivering a terminal Deposit rate of 3.75%.
The 24 May release showing UK CPI inflation falling to 8.7% in April was disappointing and has resulted in changes to our interest rate and gilt views. We now judge that the Bank rate will rise to 4.75% in June and no longer see rates falling until Q1 2024, especially as MPC policymakers are now explicitly taking into account their views of upside risks to inflation. Markets are currently pricing in a terminal rate between 5.25%- 5.50%. While we are reluctant to rule anything out at this juncture, this looks too high. Indeed we see inflation falling to 4.1% in Q4 this year, helped by what is now a clearer loosening in the labour market, plus a mild recession in H2 this year as the economy reacts to tighter policy, helping to limit the peak in rates. We have lifted our 10y gilt yield forecast to 3.75% at end-year (from 3.25%), but not changed our currency forecasts – end-2023 targets for cable and euro:sterling remain $1.27 and 90p, respectively.
Global
China’s economy had started 2023 on a firm note: Q1 GDP growth (4.5% y/y) was stronger than expected, exhibiting momentum as activity was unshackled from Covid restrictions. Since then, however, the news flow has been less positive. There was an acceleration in year-on-year growth in retail sales and in industrial production in April, but both fell short of consensus expectations – the latter considerably so (actual 5.6%, consensus 10.9%). With inflation in China being too low rather than too high (CPI inflation running at just +0.1% y/y; Chart 1), the authorities seem to be considering more stimulus, Premier Li hinting at ‘more targeted measures’.
Chart 1: Inflation in China is too low, not too high
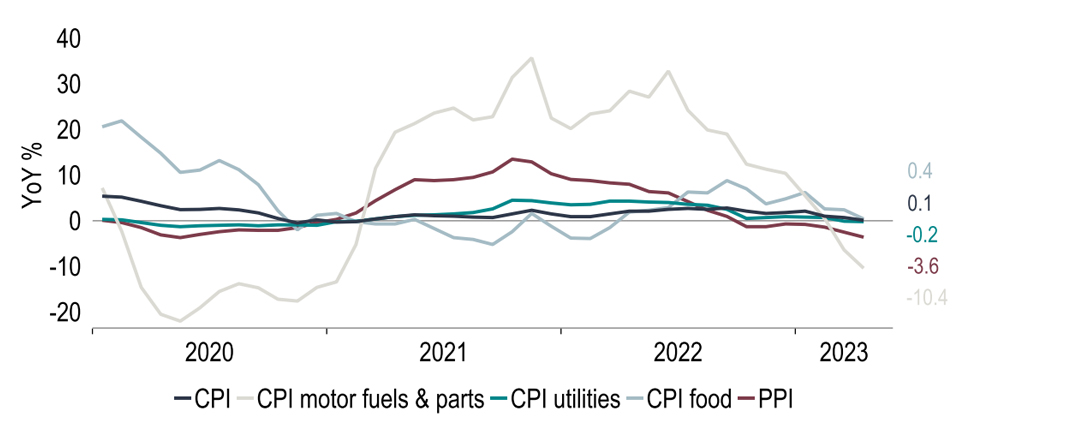
Sources: Macrobond and Investec Economics
On balance, we are not changing our Chinese GDP forecasts for the time being. Elsewhere, we have made few changes to our forecasts. At the global level, they offset, leaving our 2023 GDP forecast at 2.7% & our 2024 forecast at 2.9% as before. What stands out, though, is a clear dichotomy between manufacturing on the one hand and services on the other: the global manufacturing PMI has now languished in contractionary territory since Oct 2022, whereas services PMIs point to brisker business activity (Chart 2). Paradoxically, part of the reason is fewer supply chain disruptions: by construction, shorter lead times for orders lower the headline PMI (as typically they indicate less demand).
Chart 2: The service-sector PMIs have pulled ahead of manufacturing in developed markets
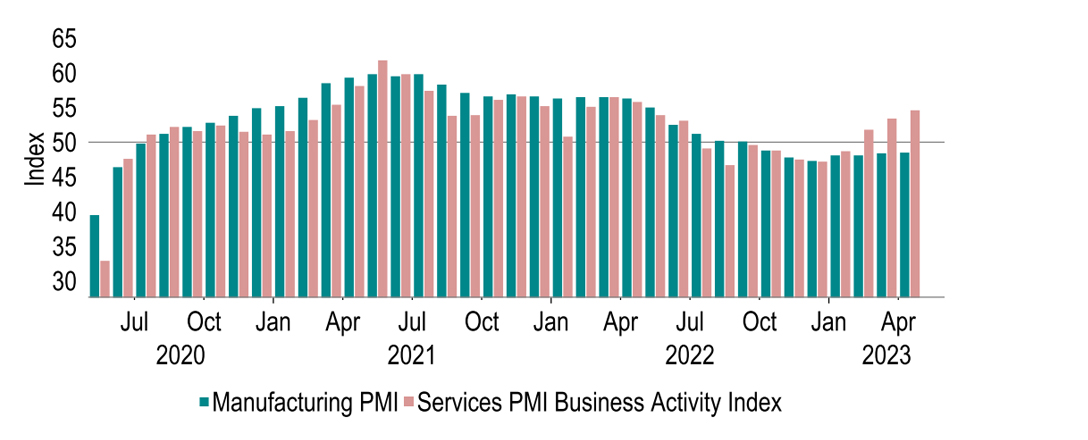
Sources: S&P Global, Macrobond and Investec Economics
However, that is not the only story: the narrower manufacturing output subcomponents are also generally soft. It is not evident why the contrast with services persists, but we suspect there is still some pent-up demand post-pandemic at play. Meeting this has for now been affordable due to resilient labour markets having supported household incomes. In addition, excess savings (built up when lockdowns restricted opportunities to consume) appear to have been drawn down – by now entirely in the US and largely in the Euro area but less so in the UK (Chart 3). As this cushion is exhausted, household demand could hit the buffers, at a time when labour demand too weakens as past rate rises bite.
Chart 3: Excess savings have been drawn down fully in the US, but not yet in Europe
Note: Excess savings are calculated relative to what they would have been had the ratio of deposits to household disposable income stayed at its Q4 ’19 level.
Sources: Macrobond and Investec Economics
For now though, labour markets remain robust, and ‘at best’ ‘hot rather than red hot’, as Richmond Fed president Barkin put it in a US context (Chart 4). The debate is whether this is enough of an indication that past hikes are starting to cool the economy to opt for a pause in tightening. The distinction between a pause and a halt to the hiking cycle is made clear by Australia’s experience, which following ten consecutive rate hikes (of 350bp in total) held rates steady in April, only to lift them by another 25bps in May, confounding market expectations. Our tentative view at this point is that rates are probably at their peak in the US, but that another 50bps of hikes may follow in the Eurozone and 25bps in the UK.
Chart 4: ‘Hot rather than red hot’ labour markets? It’s not evident from unemployment rates
Note: Euro Area data pre-2000 are the ECB Area Wide Model database.
Sources: BLS, ONS, Eurostat, ECB, Macrobond and Investec Economics
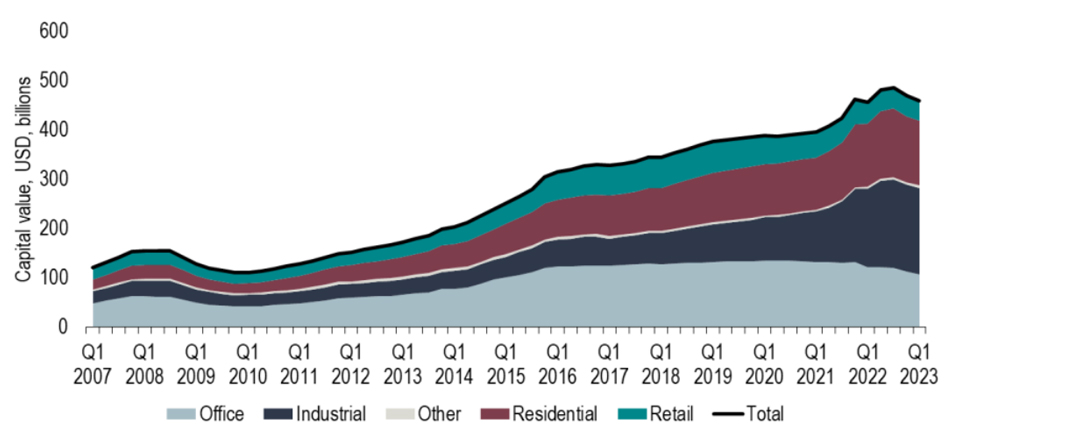
We acknowledge that the risk is skewed towards more hikes. Still, the most interest-rate sensitive parts of activity are cooling: housing investment in the US, UK and EU20 has declined outright lately. More under the radar, commercial real estate (CRE) has seen steeper price falls than residential prices (Chart 5). Besides higher rates, which hit CRE when fixed rate loans are refinanced or debt is rolled over, there are structural factors at play, not least the shift to more remote work than pre-Covid reducing demand for office space. Lower CRE prices, in turn, hurt bank asset valuations, which risks a negative feedback loop that may threaten financial stability. Rate setters are aware of this risk and will not want to overtighten.
Chart 5: Prices of commercial real estate have fallen more steeply than house prices

Sources: Macrobond, Investec Economics
The US dollar climbed through February in trade-weighted terms, as the narrative of higher-for-longer Fed policy rates gained traction. But amid fears the onset of banking woes in the US risked triggering a credit crunch, the USD more than reversed these gains in March and early April (Chart 6). GBP and EUR were key counterparts to that. Since early May though, USD has regained its footing and EUR slipped, as markets have scaled back expectations for Fed rate cuts this year by more than they have raised expectations of ECB hikes. GBP however has been more resilient. Looking ahead, we see scope for interest rate differentials to pull USD lower, to the benefit of both EUR and, to a slightly lesser extent, GBP.
Chart 6: In trade-weighted terms USD is much where it started 2023, but GBP and EUR are up
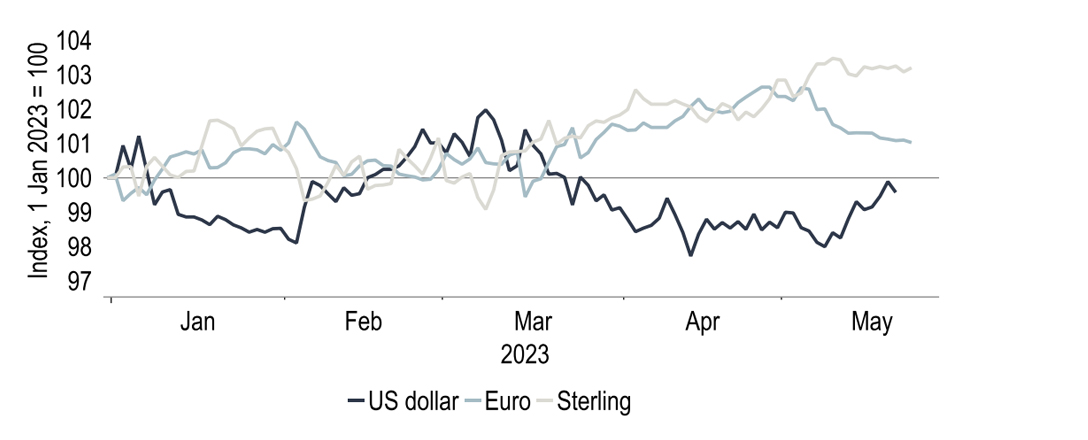
Sources: Macrobond, Federal Reserve, ECB, Bank of England
United States
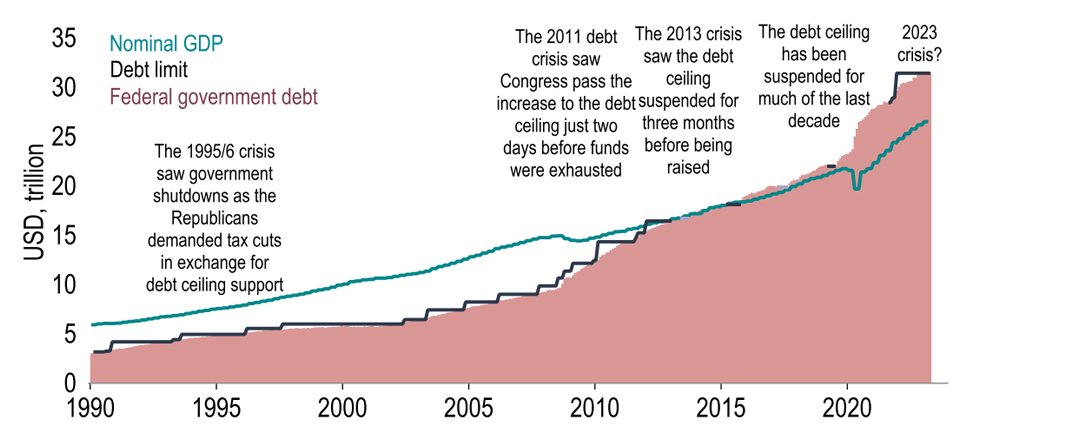
The biggest near-term risk (and the most catastrophic in the unlikely case that it is not resolved) to the US economic outlook regards the debt ceiling. As we set out in our recent explainer, in the absence of a deal to raise/suspend the $31.4trn debt ceiling, the US Treasury could exhaust the ‘extraordinary measures’ which have been used to fund government operations since the debt limit was hit at the start of the year, as early as June 1. Accordingly, Congress is racing against the clock to try and push a bipartisan deal over the line, but significant differences between the Republicans and the Democrats remain, limiting progress. The risk of a default is rising, reflected by recent market moves.
Chart 7: As the Democrats and Republicans squabble the US gets closer to the edge of default
Sources: Macrobond, Investec Economics
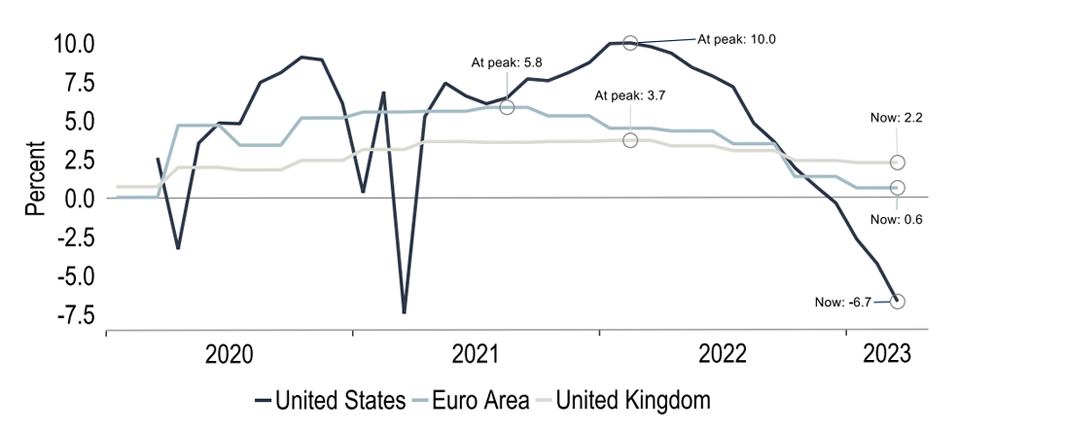
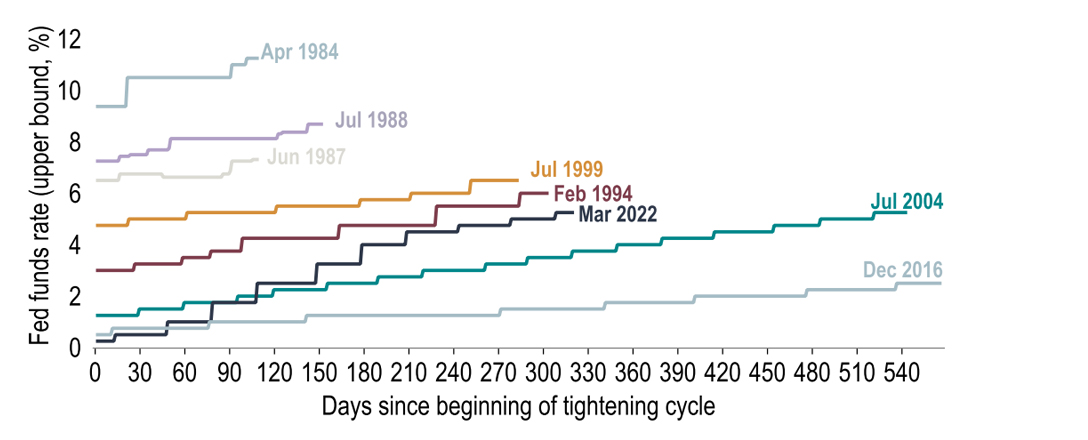
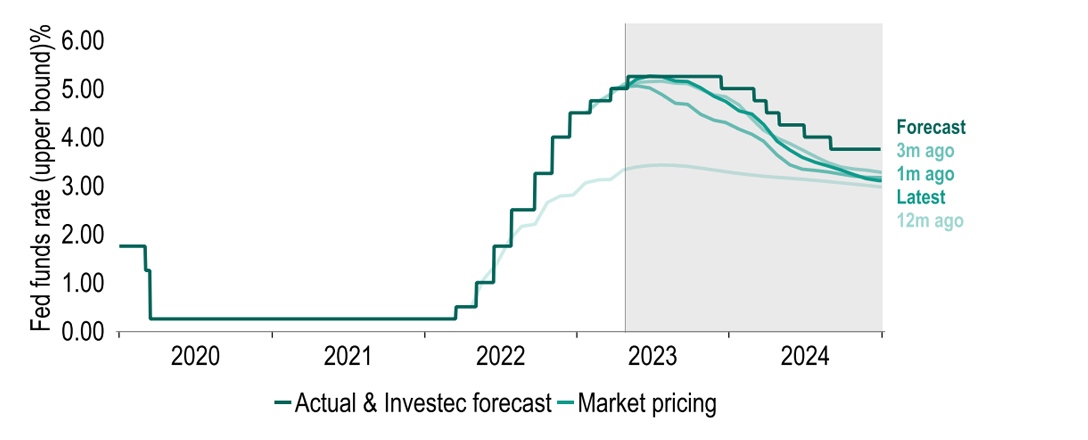
Aside from debt ceiling developments, the other key driver of markets has been expectations of Fed policy. After 500bps of interest rate increases over the course of 14 months, we now suspect that the Fed will halt rate rises whilst it takes stock of the cumulative effect of the tightening so far. Fed Chair Powell has hinted as much, whilst some of even the most hawkish on the FOMC, such as Neel Kashkari, have expressed support for holding policy in June. The economic data would support such a pause: CPI inflation has fallen for the last ten reports, weekly jobless claims are trending up and there have been signs of weakness in the broader activity metrics.
Chart 8: 500bps of interest rate increases later, are we at the end?
Sources: Macrobond, Investec Economics
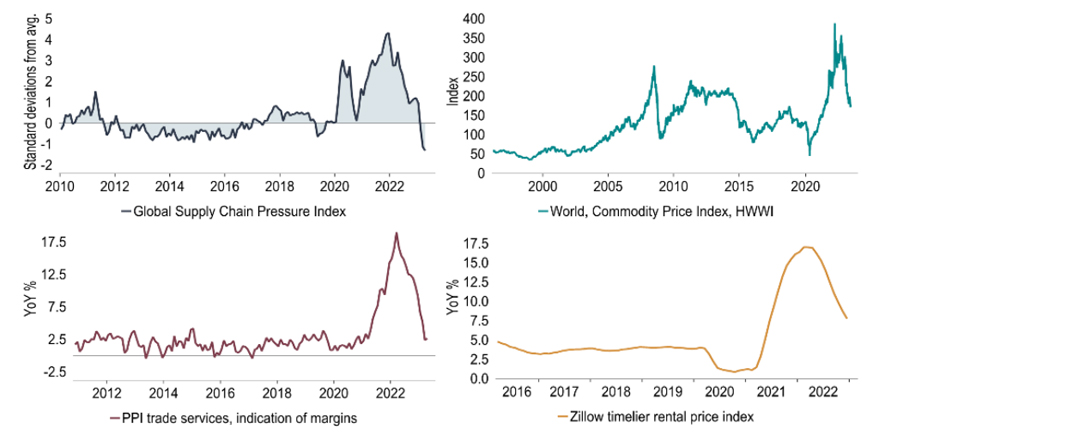
Homing in on the outlook for inflation, there are many encouraging signals that the headline measure will continue to fall. Firstly, global supply chain pressures, a key factor behind the inflation surge on the way up, have largely dissipated, with the NY Fed measure suggesting that conditions are actually looser than average, which should weigh on goods price inflation. Adding to this, timelier indicators of rental price inflation have shown clear signs of easing, and this is now being seen in the official measure too. Meanwhile, commodity prices have come off their recent peaks, and it appears that firms are compressing margins. This does have to be balanced against an unexpected reacceleration in hourly wage growth in the latest jobs report, but in all we are seeing some significant disinflationary forces (Chart 9).
Chart 9: The ‘compelling evidence’ that US inflation will likely continue to fall
Sources: Macrobond and Investec Economics
The likely tighter credit conditions, following the recent banking troubles, will also probably weigh on economic momentum and inflation. Indeed, our own three-quarter recession call (starting in Q3) is in part driven by the lending story, with our expectation that we will likely see an impact on investment in H2. Yet we are not forecasting a financial Armageddon and only envisage a mild recession, resulting in 2023 annual GDP growth of 0.9%, followed by a 0.2% expansion in 2024. Indeed, the current state of play suggests that the recent turmoil has stabilised, with banking stocks having ticked up from their lows (Chart 10).
Chart 10: KBW Bank index down 22% YTD, but bank stocks are trying to claw back losses
*Correct as of 23/05/23
Sources: Macrobond, Investec Economics
But that does not mean that the banking concerns are behind us. There are still net deposit outflows, and usage of the Fed’s emergency lending facilities remains elevated. Risks in the banking sector are further heightened by declining commercial real estate (CRE) values. These falls have been particularly large for office space as the transition to remote working has led to a sharp plunge in demand. Banks hold around 60% of total CRE debt, but within this it is the smaller banks with less than $100bn of assets that hold the lion’s share (c. two-thirds of all bank holdings). These banks are not subject to the same level of supervision as the larger banks, intensifying concerns that if CRE goes further south, there could be widespread credit losses which compromise the stability of the banking system.
Chart 11: Falling commercial real estate valuations trigger further banking concern
Sources: Investing.com and Investec Economics
We will continue to monitor the health of the banking system, but for now we judge that although there will likely be a further tightening in credit conditions, we do not envisage a protracted banking crisis. Our forecasts reflect this: we continue to pencil in a slightly weaker growth backdrop over the remainder of this year, which alongside a lower inflation outlook opens the door for the Fed to cut rates by end-year. We still think the FOMC will want a period of pause before cutting though, as the lagged impact of interest rate hikes works its way through the economy. As cuts come closer into view, we expect Treasuries to rally, with an end-year 10Y UST yield target of 3.25%.
Chart 12: At the start of May markets were pricing in the chance of a July cut, we were sceptical
Sources: Macrobond, Investec Economics
Eurozone
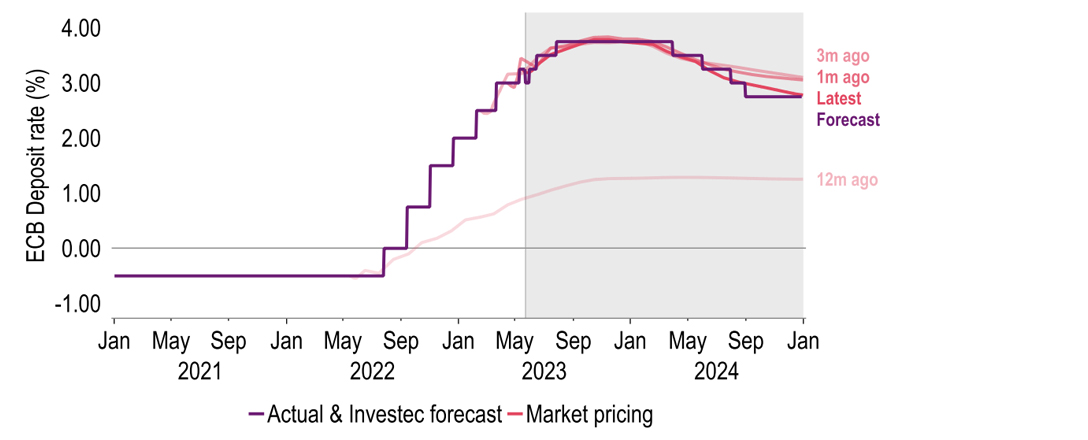
May’s ECB meeting saw it lift rates again, albeit at the reduced pace of 25bps, not the 50bps of the previous three meetings. This took the Deposit rate to 3.25%. The market reaction suggested that this was seen as a ‘dovish hike’. Our interpretation was however slightly different, taking a cue from the tone of the press conference, President Lagarde’s comments on the ECB’s determination to address inflation, as well as the loud and clear message that there was ‘more ground to cover’ on rates. A subsequent barrage of Governing Council comments advocating further hikes could also be seen as a push back against the market reaction to the decision. Notably on the day, a hawkish surprise was also included, with the acceleration of QT.
Chart 13: The ECB Deposit rate is expected to peak at 3.75%
Sources: Macrobond, Investec Economics
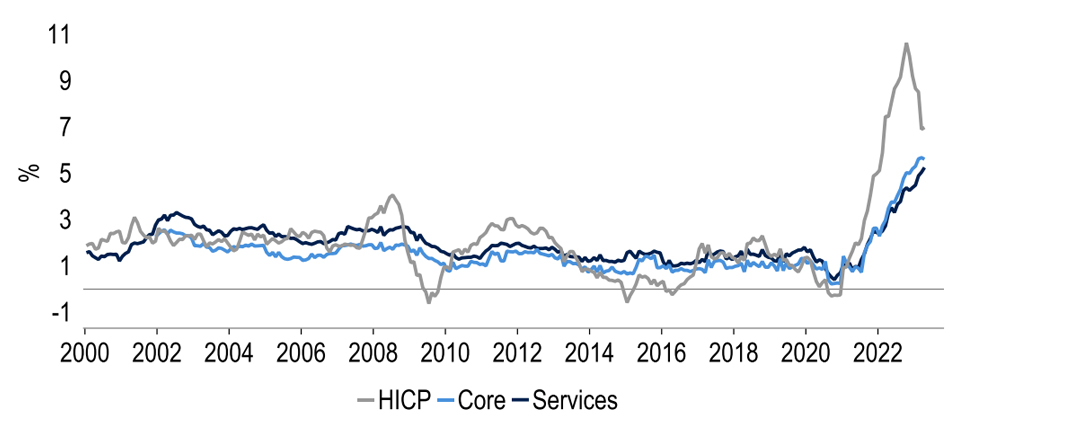
The reinvestment of maturing APP* bonds will end entirely in July rather than the more gradual pace of run-off which was previously signalled. Ultimately this will see ECB bond holdings shrink 7% (€215bn) this year. This current bias towards further tightening remains driven by the ECB’s worries over the inflation outlook. This is despite headline HICP now falling and other indications pointing to a further easing in price pressures, whether that be the marked slowdown in pipeline price pressures or the easing in goods inflation which has been aided by improving supply chains. It is the stickiness of core inflation that concerns the ECB. Services inflation for example has shown no sign of moderating, April’s reading of 5.2% represented a new record high (Chart 14).
Chart 14: Headline inflation is trending lower, but core and services remain sticky
* APP- Asset Purchase Programme
Sources: Macrobond and Investec Economics
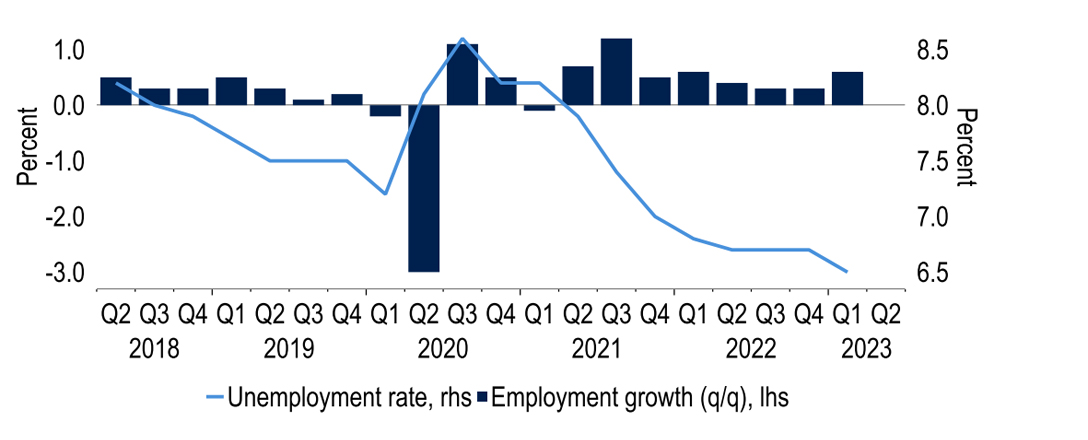
Ultimately the labour market and wage growth will play a key role here. To date the jobs market has remained solid. Unemployment stands at multi-decade lows of 6.5%; employment remains strong, rising 0.6% in Q1; and in contrast to peers, participation exceeds pre-Covid levels, at 65.1%. Given this backdrop the ECB will continue to be concerned about the prospect of second-round effects, i.e high wage growth fuelling more persistent inflation. Although we do expect labour market conditions to loosen gradually, data in the near term is unlikely to be sufficiently soft to allay the ECB’s fears on the inflation outlook. Hence we expect two further 25bp hikes in June and July.
Chart 15: The labour market remains tight as unemployment falls and employment picks up
Sources: Macrobond and Investec Economics
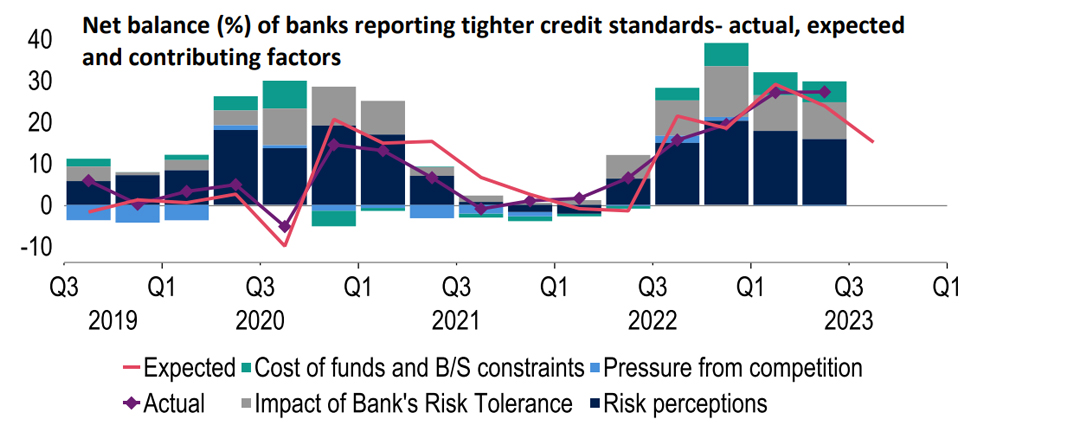
Financial conditions will however remain a policy consideration, although worries are likely to have subsided given the easing tensions in the European banking sector. Nonetheless developments in credit availability will influence economic activity. May’s Bank Lending Survey provided a picture of deteriorating conditions. In Q1 banks tightened lending standards to corporates, and to a greater extent than was expected in Q4. Loan demand was also especially weak, with the net percentage of banks reporting weaker loan demand at -37.9%, a figure only surpassed in Q1 2009, in the depths of the financial crisis. Rising interest rates were clearly cited as a factor behind that, suggesting cumulative ECB tightening is beginning to have an impact.
Chart 16: ECB Bank Lending Survey (BLS): Lenders tighten credit standards in Q1
Sources: Macrobond and Investec Economics
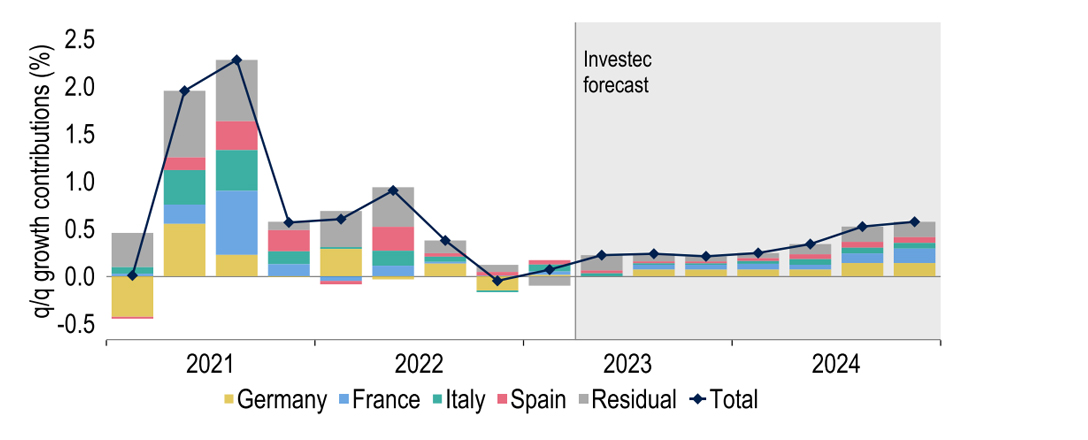
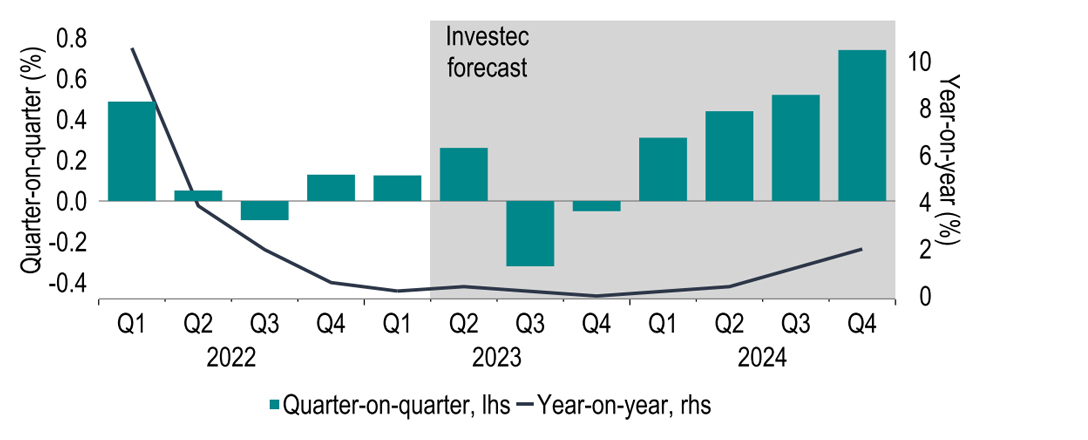
We expect this to be a restraining influence on growth going forward. Indeed, it represents a downside risk should credit conditions worsen rather than improve as indicated by the BLS (Chart 16). That said, so far the economy has proven to be more resilient than expected. Despite the tightening in conditions, which began last year, GDP expanded by 0.1% q/q in Q1, avoiding a recession. In terms of our forecasts, we have upgraded 2023 by 0.2%pts to 0.8% and 2024 by 0.1%pt to 1.2%. This reflects better than expected performances in Q1 from Italy and Spain and small upgrades to the forward-looking profile for Euro area growth, although it is worth remembering that the pace of growth is weaker than the pre-Covid trend.
Chart 17: Winter recession avoided, with a moderate pace of growth expected in 2023
Sources: Macrobond and Investec Economics
In terms of our market forecasts, we continue to envisage a rising Euro, in both the short and medium term. In the very near term we envisage €:$ rising to $1.10 by the end of Q2. This to our mind could be driven by June’s ECB meeting which, as mentioned above, we expect to deliver another 25bp hike and further messaging around additional tightening. Into the medium term. Our broad view of a softening USD, which is driven by a turn in the US rate cycle, ought to help to support €:$, as should the EU20’s better fundamental position given our forecasts for a US recession in H2 2022 and early 2023. As such our end-year €:$ forecasts stand at $1.14 Q4-23 and $1.18 Q4-24.
Chart 18: €:$ is expected to rise in the near and medium term
Sources: Macrobond and Investec Economics
United Kingdom
The economy was still hovering close to stall speed in Q1, eking out growth of just 0.1% q/q, though the GDP profile has been hit by special factors recently. One is extra Bank Holidays (in Jun 22, Sep 22 and May 23). Another is strike action in various parts of the public sector, with an average of 300k working days per month lost in the 12 months to March, a near 33y high. While Britain has so far dodged a recession, we are less confident about H2 this year as activity responds negatively to lagged hikes in interest rates, especially the 1.3m households who face mortgage resets in Q2-Q4 this year, overwhelmingly at higher rates. We still judge a mild recession will follow, though we have nudged up our full year forecasts to +0.2% this year and +1.0% next.
Chart 19: No recession yet, but economy under pressure in H2
Sources: Macrobond and Investec Economics
The MPC’s 25bp increase in the Bank rate to 4.50% earlier this month was the 12th hike in succession and was accompanied by an explicit warning of the upside risks to its inflation projections from ‘domestic price and wage setting’. Indeed while markets typically focus on the committee’s main, or ‘modal’ projection, it is more relevant at this juncture to assess the ‘mean’ projection, which takes into account what is currently a joint record high degree of upside risk or ‘skew’. The mean forecast lies at 2.0%, or a touch below, in 2-3 years’ time (Chart 20). The read through is that the materialisation of further upside risks would trigger a further tightening from the committee.
Chart 20: CPI projection – MPC now guided more by upside risks i.e. mean forecast
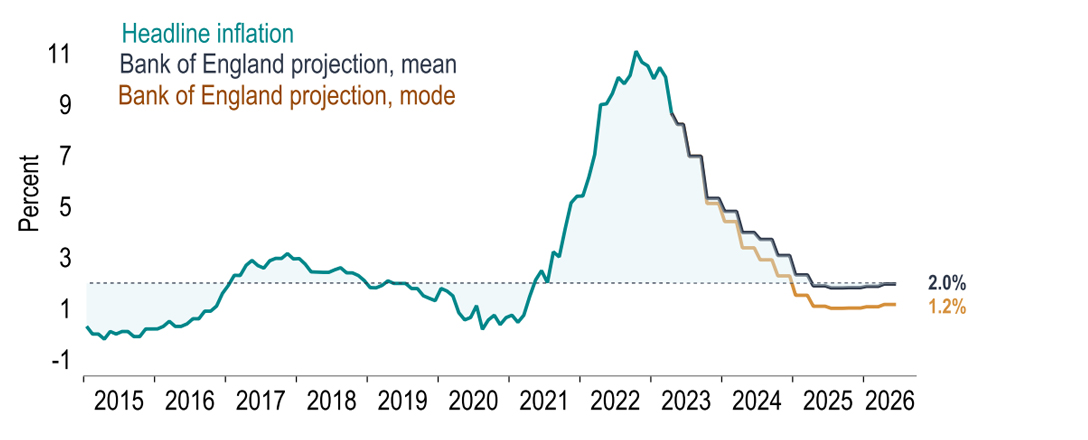
Sources: Macrobond and Investec Economics
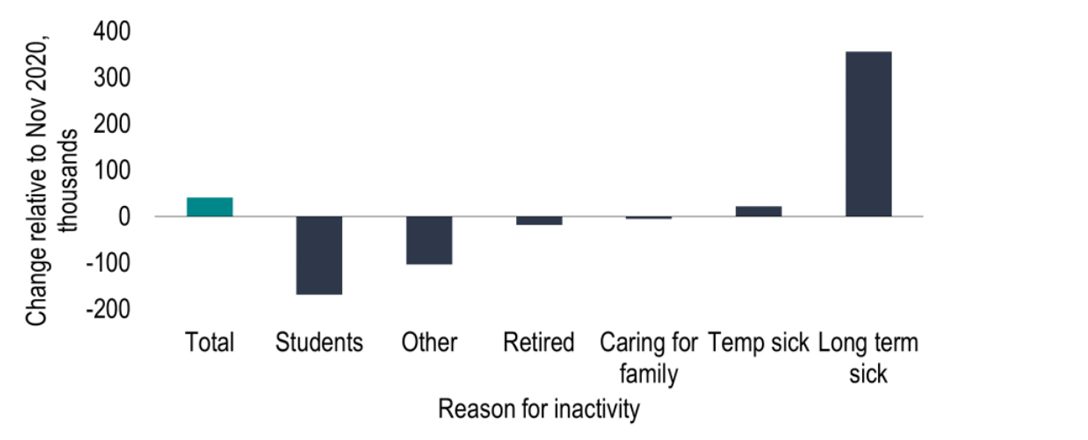
How are these risks panning out? Recent labour market news has reinforced our view last month that many of the key quantity metrics are easing. For example the unemployment rate in March was 3.9%, up from last summer’s low of 3.5%; vacancies fell by 55k in the three months to April and now stand 17% below last May’s peak; and HMRC payroll data showed a 136k decline in the number of jobs in April. Another important trend is the continued recovery in the participation rate, now at a 28-month high of 79.0%, which should help to ease labour shortages. Inactivity due to long-term sickness is still a problem though (Chart 21) as logjams in the NHS persist, exacerbated by industrial stoppages.
Chart 21: The make-up of those economically inactive has changed since late-2020
Sources: Macrobond, Investec Economics
As the labour market loosens, wage trends should ease. Private sector regular earnings growth now stands at 7.0% (3m yoy in March), little changed from the peak of 7.3% at the end of last year. But such moves tend to be gradual as pay awards tend to occur annually. Also BoE calculations suggest that the lion’s share of pay growth is due to the strength of short-term inflation expectations. As inflation falls further, these expectations may come down as well reducing the case for higher rates. But the drop in CPI inflation to 8.7% in April (from 10.1% in March) was smaller than we expected. We now see CPI inflation at 4.1% in Q4 (previously 3.2%) and now judge that the MPC will raise rates to 4.75% in June and that a cut will not occur until Q1 next year.
Chart 22: BoE staff analysis of factors contributing to pay growth*

*based on academic work by now US Treasury Secretary Janet Yellen
Sources: Bank of England and Macrobond
The Conservatives are nursing their wounds, losing a net 1,063 council seats at the recent English local elections. Labour is now the biggest party at local authority level. Psephologists estimate that this would translate to a general election vote shares in GB of Labour 35%; the Tories 26%; Lib Dems 20%. They also estimate that Labour would be the largest party in a hung parliament. But local elections often result in different voting patterns - there has not been a national opinion poll giving Labour as little as 35% of the vote since last July. Most recent polls put Labour’s lead at 15%-20% which would imply a large Labour majority. Our working assumption is that there will be a majority Labour government in late-2024.
Chart 23: The Conservatives lose over 1,000 seats at the recent local elections
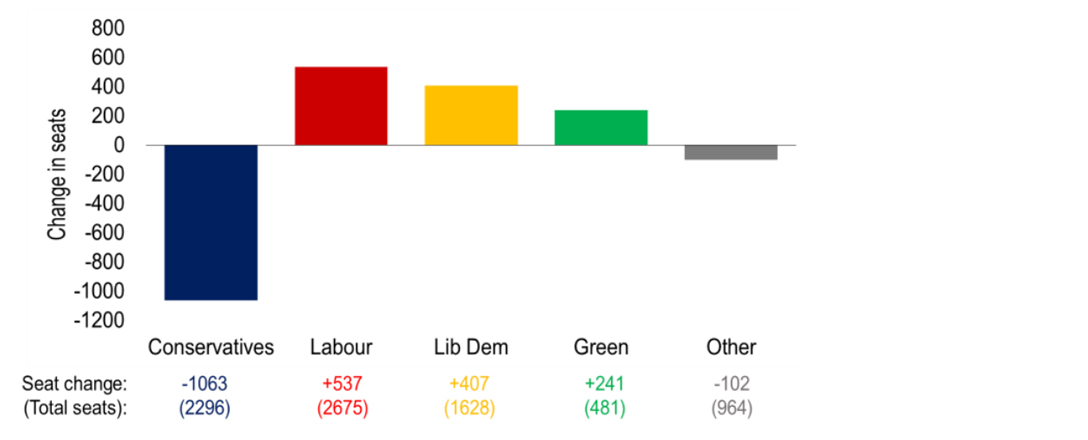
Sources: Macrobond and Investec Economics
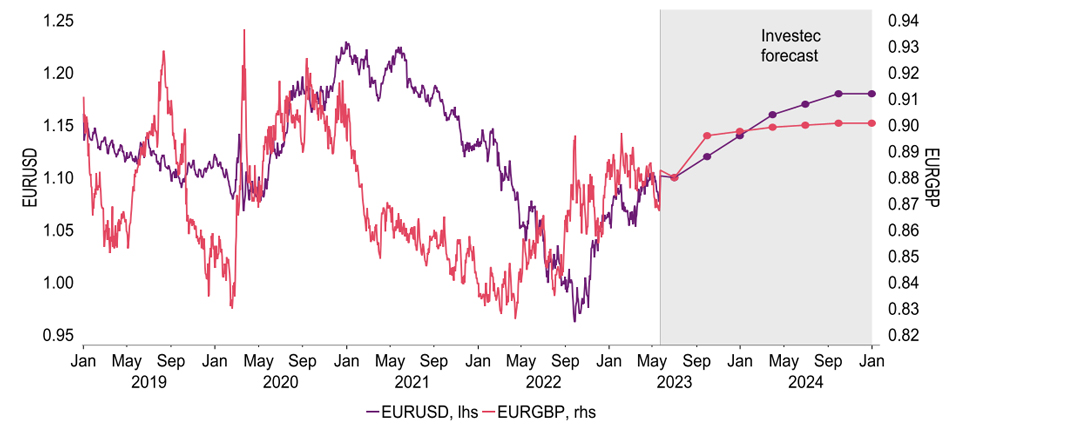
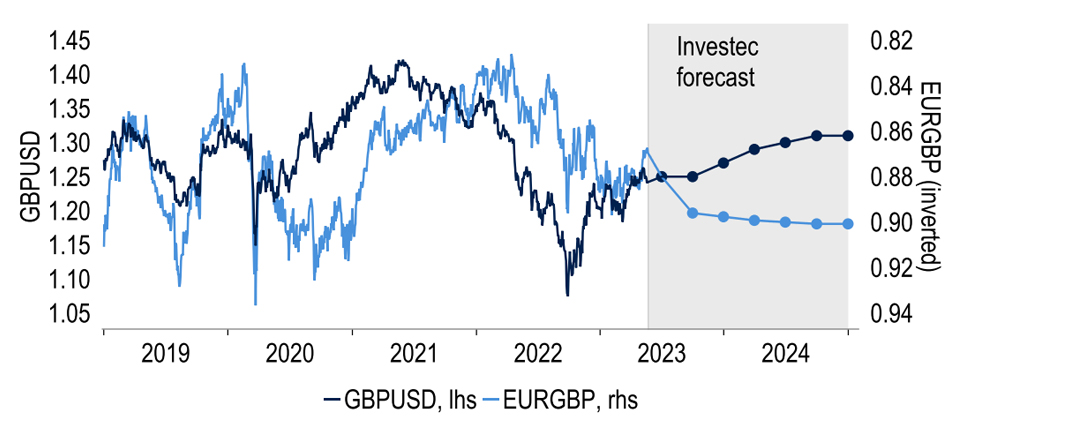
Sterling has undergone a correction recently, dipping as low as $1.2370, mainly thanks to US dollar strength (in spite of its debt ceiling issues). It is easy though to forget how far sterling has recovered over the past 10 months. It reached $1.03 intraday in September and was at $1.18 as recently as March. Note too that the pound rose past 87p against the euro, which until this month was a level unvisited since December. Our views are unchanged from last month. We still see the UK unit rising modestly against the USD on the back of a firmer EUR, but with UK economic weakness holding the pound back. Our end-2023 targets remain $1.27 and 90p against the euro and $1.31 and 90p at end-2024.
Chart 24: Sterling to struggle against a firmer euro later this year
Sources: Macrobond and Investec Economics
Get more FX market insights
Stay up to date with our FX insights hub, where our dedicated experts help provide the knowledge to navigate the currency markets.
Browse articles in
Please note: the content on this page is provided for information purposes only and should not be construed as an offer, or a solicitation of an offer, to buy or sell financial instruments. This content does not constitute a personal recommendation and is not investment advice.