

Economic Highlights
09 May 2022
Welcome to our Economic Highlights, bringing you market updates from the UK, US, Europe and China, as well as the FTSE winners and losers.
There is a cautionary tale of the six-foot tall man who drowned while crossing a river that was only two feet deep, on average. Unfortunately, his planning failed to take into account the seven-foot-deep section in the middle. Since the last time I wrote, balanced portfolios have suffered losses. I saw quite a few missives at the beginning of April pointing out that, on average, April was the best month of the year for equity returns. This is not the first time this year that investors might have been misled by relying on averages.
The first instance was the exhortation to “buy on the bullets” when Russia invaded Ukraine. Yes, there was an initial bounce for traders, but equity markets are generally lower again now. The second was when the US yield curve (the spread between the yields on the two-year and ten-year Treasuries) inverted. This has historically been a good indicator of a forthcoming recession. Again, though, on average, the recession has been around a year-and-a-half away and equity markets have continued to rise.
The market historians at Deutsche Bank comment that April was only the second month this century during which the S&P500 Index lost more than 5% of its value, while the US Treasury market simultaneously lost more than 2%.
The yield curve inverted on the first trading day of April. What happened next was not pleasant. The market historians at Deutsche Bank comment that April was only the second month this century during which the S&P500 Index lost more than 5% of its value, while the US Treasury market simultaneously lost more than 2%. There was no place to hide for investors in a traditional “60/40” Equity/Bond portfolio.
This is something that we have been concerned about for a while: the shifting correlation between equities and bonds. For the last two decades we have been in a regime of negative correlation, during which equity and bond prices tended to move in opposite directions, creating nice balance in a portfolio, reducing volatility and bumping up risk-adjusted returns. The two decades before that were even better for investors. Equities and bonds were positively correlated, but in a world of falling interest rates and bond yields, leading to gains for both asset classes at the same time. The previous decade, the 1970s, was the exact opposite. Rising yields hurt bond investors while at the same time reducing economic activity and pushing down equity valuations.
The worst-case scenario is that we are returning to the 1970s regime, with the key driver being inflation. We have certainly been getting a few warning shots about what that might look like from a portfolio perspective. We don’t actually think things will get that bad, but the risk is there. Thus, we have been widening the net in terms of portfolio diversification, taking in, for example, more assets that might be classified as “Alternative”. These could be “real” assets, therefore tied to physical assets whose returns might be more able to keep pace with inflation; or carefully selected hedge funds whose overall performance tends not to correlate with other asset classes.
Much of the regime outcome will depend upon politicians and central bankers. We remain concerned (at least from the narrow perspective of investing) that policy trends suggest higher inflation than we have been used to recently. Factors include geopolitical shifts (just look at the effects of Russia’s invasion of Ukraine for effects on commodity prices, especially food-related); a change in corporate preferences for shorter supply chains and a desire for resilience over efficiency; and a social agenda that focuses on correcting inequalities within society. Those are just a few of many.
And if politicians are on a course that looks set, the onus falls on central bankers to dampen the excesses that might build up. They have an unenviable task, at least in part because monetary policy can be a very blunt instrument, often injuring those at the lower end of income and wealth scales who can offer the least resistance.
Central banks are faced with the fact that the headline data they look at is based on the whole economy. It is well known, for example, that inflation tends to hurt the poor more than the rich because a greater share of their spending is non-discretionary (that is for food, energy and shelter, say). But if central banks raise interest rates, that can also hurt the same people, who are often more dependent on credit.
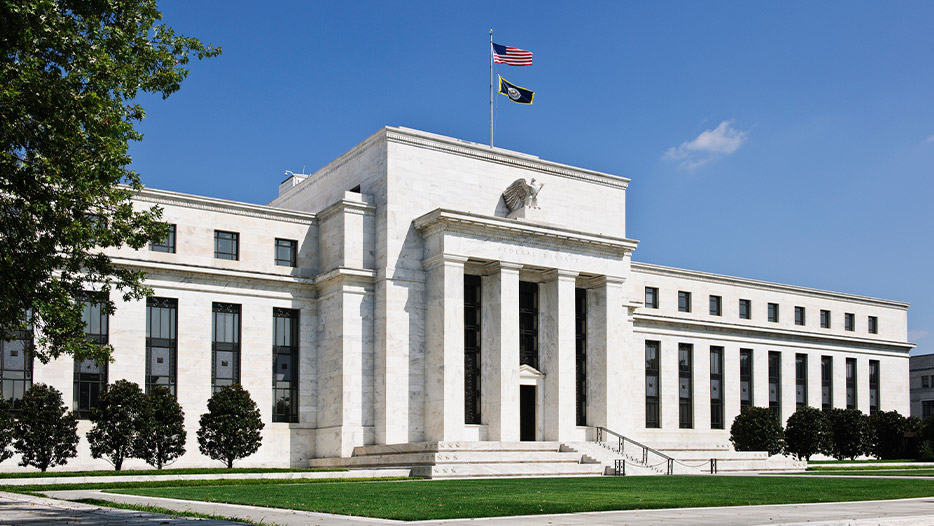
The wealthy, on the other hand, have benefitted more from asset price appreciation, especially thanks to policies that suppressed interest rates and encouraged investors to take on more risk. Bearing that in mind, it is perhaps unsurprising that the US Federal Reserve seems to be deliberately targeting asset prices as its preferred means to tighten financial conditions. That brings its own risks, because the real economy is so much more entwined with the financial economy today.
In the past, investors have been used to the “Fed Put”, by which the Fed loosened policy whenever the equity and credit markets sold off sharply. Now, there is a concept known as the “Fed Call”, which means that the Fed will be more inclined to tighten policy if it sees markets heading back towards peaks, at least unless inflation retreats swiftly. Having said that, the Fed Put is still there somewhere, but the strike price is probably a lot lower than it used to be (that is, markets will have to fall further).
How low could we go? For once, the UK equity market seems to be in a better place than many, owing to its composition (virtually no technology weighting), and might well hold up better, but still lose ground overall. The S&P500 in the US will be the main gauge for investors as it accounts for more than half of the global market capitalisation.
For what it’s worth, Michael Hartnett, the global strategist at Bank of America, has compiled a list of 19 US bear markets going back to 1886. The average price decline is 37.3%, and the average duration 289 days. Should the averages play out now (and past performance is no guide to future performance, as we all know), the target date for the bottom is October 19th this year. An average decline would leave the S&P500 at 3,000, with the NASDAQ Index at 10,000. That’s another 27% and 18% down from last week’s closing level respectively (although I am inclined to believe that the NASDAQ would have further to go, being a higher beta index). This is obviously not a forecast, but an interesting observation, nevertheless, and it might be helpful when thinking about when to commit more risk to portfolios.
My colleague Chris Holdsworth (my counterpart in South Africa) has run his own numbers on equity market corrections. He notes that the total drawdown in US equities so far (-14%) has not been too exceptional by historical standards. From 1953 through to the present there have been eighteen drawdowns of US equities greater than 10%. I was actually surprised there had been so few. Nevertheless, it does show that what is happening now is not exceptional – there is a 10%-plus correction on average every three-and-a-half years.
From 1953 through to the present there have been eighteen drawdowns of US equities greater than 10%.
What happens next is very much dependent, it seems, on whether or not there is a US recession. When associated with a recession, drawdowns greater than 10% have taken 338 days to bottom out with an average drawdown of 34%. Without a recession the number of trading days to the bottom is 119 with an average drawdown of 20%. So far, the drawdown of the S&P 500 has been 14% over 86 days. No wonder everyone is so concerned about the risk of a policy mistake which pushes the US economy over the edge.
We are not in the recession camp (and certainly not a deep one), which suggests we should be beginning to look for opportunities to increase equity weightings. But valuations are not yet especially attractive, and we think there is still some margin risk to corporate profitability, and so we are prepared to bide our time for a bit longer. And while we pay heed to averages compiled over many cycles, we also acknowledge that they are just averages, and that every cycle will have its own nuances. If only the drowned man had been more careful, he might have discovered the meaning of the proverb credited to the Greek philosopher, Heraclitus: “No man steps in the same river twice”.
The information in this document is for private circulation and is believed to be correct but cannot be guaranteed. Opinions, interpretations and conclusions represent our judgement as of this date and are subject to change. The Company and its related Companies, directors, employees and clients may have positions or engage in transactions in any of the securities mentioned. Past performance is not necessarily a guide to future performance. The value of shares, and the income derived from them, may fall as well as rise. The information contained in this publication does not constitute a personal recommendation and the investment or investment services referred to may not be suitable for all investors. Copyright Investec Wealth & Investment Limited. Reproduction prohibited without permission.
Member firm of the London Stock Exchange. Authorised and regulated by the Financial Conduct Authority.
Investec Wealth & Investment Limited is registered in England.
Registered No. 2122340. Registered Office: 30 Gresham Street, London EC2V 7QN.
Browse articles in