
Recovery to spur more action from central banks
The global economy will extend its recovery, but risks remain, including supply chain disruptions, price pressures, labour shortages and geopolitical threats. Major central banks will continue to tighten policy and in our latest Global Economic Overview, we see the Bank of England increasing interest rates three times this year.
The start of the new year brought with it a spike in global Covid-19 cases, fuelled by the spread of the more transmissible Omicron variant. However, promising evidence from South Africa and the UK suggests that new infections should soon decline as rapidly as they increased. This should enable a continued robust economic recovery, with our global gross domestic product (GDP) growth forecast at 4.4% for 2022 and 3.7% in 2023. Risks to the outlook do remain, however, with supply chain disruptions, price pressures, and labour shortages all causes for concern. In response, central banks across the world should continue to transition away from the ultra-loose monetary policy imposed at the onset of the pandemic. A more specific downside risk stems from China, with the economy having showed signs of weakness in recent months.
We envisage that the strong US economic recovery will continue, forecasting GDP growth of 3.9% this year and 2.4% next. On the policy side, spiralling inflation and a tight labour market have prompted a move forward in rate hike expectations. We are now looking for a 25 basis point increase in the Fed funds target range to 0.25-0.50% in March, followed by two further rate hikes later in 2022. We also expect the Federal Reserve to embark on quantitative tightening (QT) this year, via balance sheet runoff. Politically, the high inflation environment is not helping President Joe Biden’s approval rating as he heads towards the midterm elections.
Along with the rest of the world, the 19 euro area countries (EU19) have faced an Omicron driven surge in Covid-19 cases this winter, the severity and timings of which have differed across member states, as have restrictions. Ultimately, we expect this to have impacted the fourth quarter of 2021 and the first quarter of 2022, but GDP growth for this year should still post a healthy 4.4% and attain 3.0% in 2023. Inflation, we suspect, may have peaked and should moderate, but is still expected to sit above target in the fourth quarter and at the end of 2023 at 1.8%. What matters most for the price outlook in the medium term is the labour market, which to date has posted a solid recovery. Broadly, we expect conditions for a tightening in policy to be met in 2023, with our expectation now being for a first deposit rate rise in June 2023.
Mounting signs are that the hit from Omicron on economic activity will be visible in data from the turn of the year, but relatively mild and short-lived, to be followed by a swift rebound. Our forecasts are for 2022 GDP growth of 4.5% and 2023 growth of 2.4% The bigger obstacle to overcome looks instead to be inflation. We anticipate that the government will take action to mitigate the impact of surging utility bills come April. The broad-based nature of the recent inflation rise, given the tight labour market, strengthens the case for a greater near-term response by the Bank of England. We now expect three 25 basis point rate hikes this year, in February, May and August, triggering not just passive QT but active gilt sales from late summer.
Global
Since the emergence of the Omicron variant, new Covid-19 infections have increased rapidly across the world. Although the variant is more transmissible, the data also suggests that it causes less severe illness than previous variants, with hospitalisations relative to infections lower than in past waves. The extensive booster campaign in many economies has also played a part in this. With such a large proportion of the population now protected via vaccinations or prior infection, and real evidence from South Africa where the Omicron variant was first discovered, many countries are now discussing moving to a new phase in the pandemic: living with Covid-19.
One country that is taking a vastly different approach is China. The Chinese government remains committed to its zero-Covid strategy and as such has imposed strict local lockdowns in response to outbreaks. How long this strategy is sustainable for is uncertain, especially if restrictions become more widespread and act as a significant headwind to growth. This is also against an already slowing economic backdrop, with the housing market remaining a significant downside risk. Our forecasts look for GDP growth of 5.1% and 5.0% in 2022 and 2023, respectively. The People’s Bank of China has responded to the weaker outlook by reducing multiple key rates over the past month, with more cuts expected.
Despite a potential slowdown in China, we are still expecting a robust global economic performance in 2022 as the recovery from the pandemic continues. Our forecasts look for global GDP growth of 4.4% in 2022 and 3.7% in 2023. One key theme of the recovery has been labour market strength. At the onset of the pandemic, we saw large swathes of joblessness, as lockdowns halted activity. Since then, not only have economies been opened up, but they have also become more resilient to social restrictions, and the labour market has recovered. We calculate that the unemployment rate for the Organisation for Economic Co-operation and Development (OECD) and key partner countries is trending back towards pre-pandemic levels.
Supply chain disruptions, stemming from the pandemic, have culminated in cost-push inflationary pressures. Pooled with energy price increases, inflation rates have been sent to multi-decade highs in many economies.
Combined with the general tightness of labour markets in developed nations, inflation is still rising globally. Supply chain disruptions, stemming from the pandemic, have culminated in cost-push inflationary pressures. Pooled with energy price increases, inflation rates have been sent to multi-decade highs in many economies. To combat inflation, and more generally to bring policy back to more normal and sustainable levels, central banks globally have begun to raise interest rates. 2021 as a calendar year saw the largest global tightening bias since 2006. The only major exceptions to this trend are the unorthodox Turkey and China.
Chart 1: Inflation causes broad-based tightening from central banks across the globe
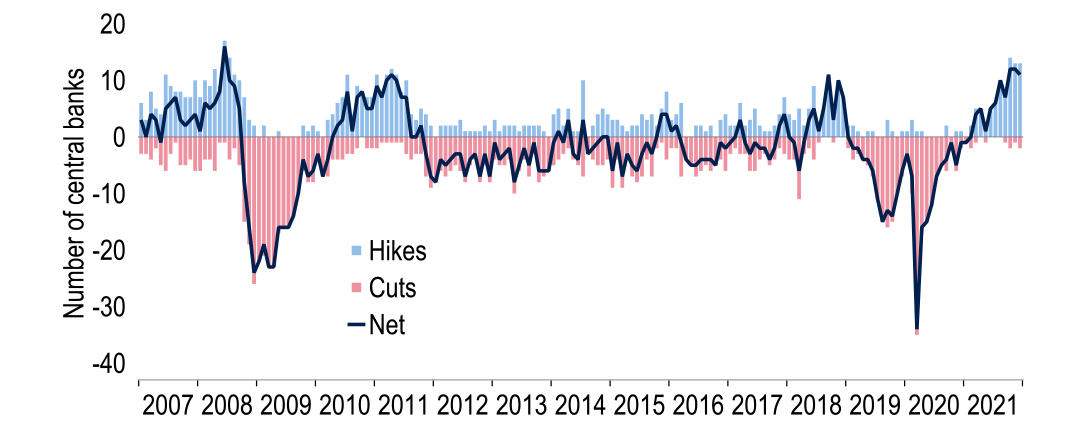
Note: Considers net monthly change in policy rate, not individual moves (e.g. the Bank of England is counted only once in March 2020 despite two rate cuts).
Source: Macrobond
There have, however, been tentative signs that these supply chain disruptions may have peaked. Evidence of this can be found in a number of indicators. The New York Federal Reserve’s Global Supply Chain Pressure Index perhaps provides the most comprehensive indicator. This may have begun to fall at the end of last year. Such signals have been corroborated by evidence from individual countries. Japan is one example, where industrial output rose 7.0% month-on-month in November, the economy ministry noting the upturn was supported by an easing in shortages. Ultimately, an easing of these supply pressures should further support a rebound in activity over 2022 as well as alleviate some price pressures.
As noted above, one of the key themes for 2022 will be monetary policy tightening. However, it will not just be rates that are in focus, but also quantitative easing (QE), with central banks either tapering off existing programmes or beginning to shrink their balance sheets, in the case of the Fed and the Bank of England (BoE). On our estimates, the $3trn liquidity injection in 2021 will fall to $0.5trn this year and turn negative in 2023 at -$0.8trn. The question stemming from this is what happens to key market rates. Here we continue to hold the view that the US dollar will soften against the major currencies as a return to ‘normality’ lessens the demand for the American currency. Meanwhile, we see bond yields rising across major geographies, our view on 10yr Treasuries, gilts and bunds standing at 2.5%, 1.75% and 0.5% respectively at the end of 2023.
United States
Headline Consumer Price Index inflation now stands at a near 40-year high of 7.0%. We judge that this is not representative of underlying price pressures. Even so, inflation has been higher and more persistent than we (and the Federal Open Market Committee or FOMC) expected. Indeed, senior Fed members have been out in force signalling their disquiet, suggesting that the first rate increase is reasonably imminent. Accordingly, we have brought forward our forecast for the timing of the first hike in the Fed funds target to March. We now also expect the Fed to begin to reverse QE this year, most likely in September. In 2017, the Fed waited some two years after rate ‘lift off’ to begin to shrink its balance sheet.
December’s FOMC minutes also hinted that the pace of QT will be faster than five years ago, when its maximum pace reached $50bn per month ($30bn in Treasuries and $20bn agency bonds). As previously, the Fed is likely to rely on balance sheet runoff and not turn to active sales. In the absence of Operation Twist, which raised the maturity of its portfolio in 2011-2012, the Fed holds materially more short Treasuries than in 2011, with redemptions of $47bn to $175bn per month over 2022 and 2023. Recently, Treasuries have been spooked by talk of a 50 basis point hike in the funds target at some stage. Although we cannot rule this out, we still envisage three 25 basis point moves in both 2022 and 2023. We have pushed up our 10y yield target to 2.25% for the end of 2022 on the new QT profile.
The move forward in expectations is remarkable: back in January 2021, QT was not even on the radar and consensus was looking for 2021 GDP growth of 4.4%. Fast forward twelve months and we are expecting monetary tightening this year, and GDP growth of 5.6% and 3.9% in 2021 and 2022, respectively. Our updated growth forecast reflects a string of robust economic data, such as the Purchasing Managers' Index (PMI), which has been above the 50 ‘breakeven’ level for the last 19 reports. One could argue that longer supplier delivery times, a feature of the pandemic, is distorting the read-through to economic activity, but even when excluding this, the index has remained above 50 over 2021.
Chart 2: Inflation, what inflation? US saving ratio dips below pre-pandemic levels
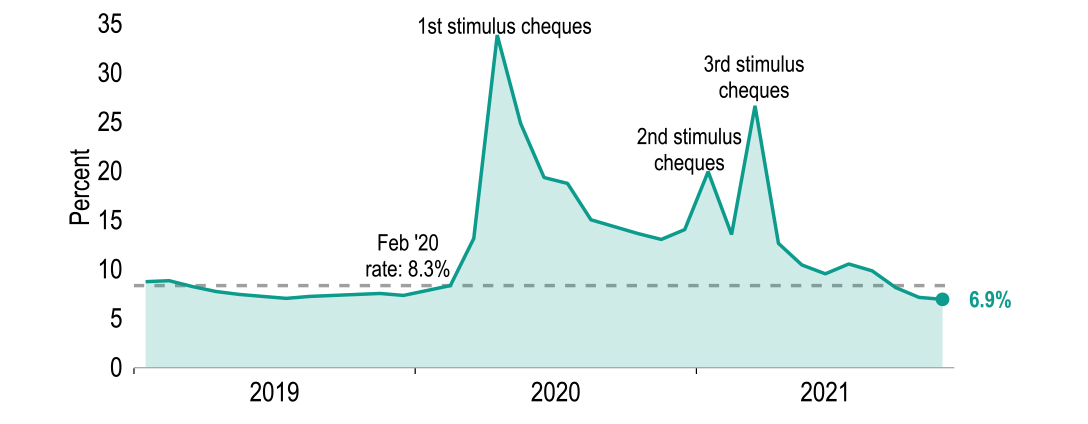
Source: Macrobond
On the consumer side, a noticeable pandemic trend has been an elevated saving rate, boosted by stimulus cheques and limited opportunities to spend. This process, however, has recently geared into reverse, disputing the economic theory that a high inflation environment invokes a higher saving rate. Currently, the rate sits below pre-pandemic levels, despite the CPI hitting multi-decade highs. One explanation for this considers the large pool of household excess savings and the relatively high levels of job security. Combined, these safety nets may be outweighing the real balance effect, underpinning the confidence of the consumer.
This high level of job security is a feature of the tight US labour market: the rate of unemployment is falling rapidly; unfilled job openings are at record highs; and wage growth is surging. On this basis, it seems reasonable to conclude that the Fed’s ‘maximum employment’ goal has been met. On most fronts, it has, but weaknesses do remain, such as the participation rate. This has remained stubbornly below pre-pandemic levels, and has exacerbated the issue of labour shortages. This trend is more pronounced in some age groups, with the higher wages and greater opportunities on offer showing few signs of enticing those workers that left the labour force for early retirement back to the market.
Unless political momentum swings abruptly, the Democrats are heading for a loss of both the Senate and the House, and the US towards even greater dysfunctional political gridlock.
President Biden’s ‘Build Back Better’ bill is still floundering, with Democrat holdout Joe Manchin effectively blocking its passage through the Senate. A proposed solution might be to divide up the bill and prioritise key policies ahead of November’s midterms. Biden’s approval ratings are averaging close to 40%, lower than three of the previous four presidents after a year in office (Donald Trump is the exception). Also a recent Quinnipiac poll gave him a 33% rating, though this might be an outlier. The bigger picture is that unless political momentum swings abruptly, the Democrats are heading for a loss of both the Senate and the House, and the US towards even greater dysfunctional political gridlock.
Chart 3: President Biden’s approval rating is the second-lowest at this stage of presidency
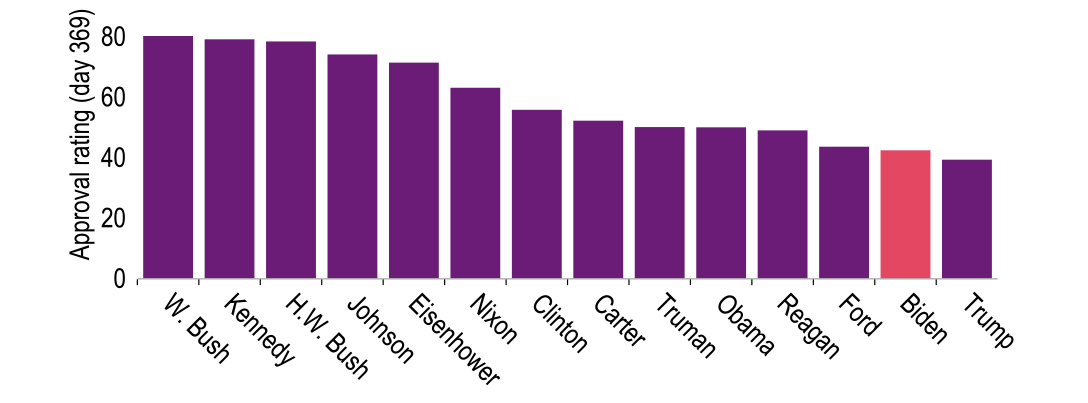
Source: Fivethirtyeight, Macrobond
Eurozone
The spread of Omicron across Europe has been rapid but not fully synchronised. Spain, for instance, saw a sharp rise in Covid-19 cases from mid-December but a drop since. France experienced increases near year-end but cases in Germany and the Netherlands are only up sharply since January. Policy responses have also varied, although full lockdowns have been avoided in the major Eurozone countries, with vaccination the key tool used to contain pressures on healthcare systems. Still, economic activity is likely to have been held back to some degree over the fourth quarter of 2021 and the first quarter of 2022. We have hence cut our quarterly GDP forecasts to 0.6% and 0.3% respectively, yielding 2022 growth of 4.4% and 2023 growth of 3.0%.
Even so, Eurozone GDP appears on track to have exceeded its fourth quarter 2019 GDP level in the fourth quarter of 2021, but with some clear country divergences. Indeed, as of the third quarter of 2021, 11 of the EU19 nations had already surpassed this hurdle. On the plus side, Ireland’s figures stand out. But these are heavily distorted by the recording of activities of large multinational firms; gross value added excluding foreign-owned multinationals is down 3.9% from the fourth quarter of 2019. More genuine is the under-performance of Spain: employment (and thus spending power) has suffered more than in most other EU19 countries. A key reason is the fairly heavy exposure of GDP and employment to tourism in Spain.
Chart 4: Inflation has picked up much more sharply recently than ECB staff had expected
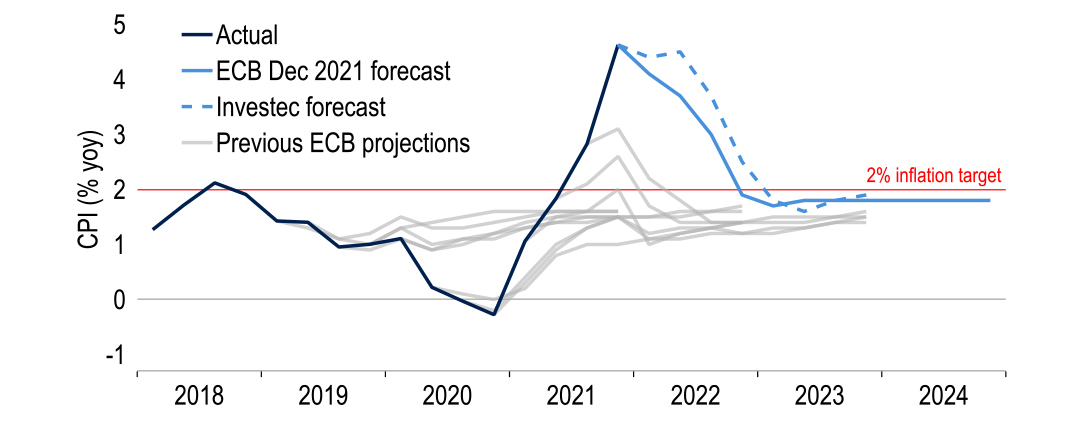
Source: ECB, Macrobond and Investec
As elsewhere, inflation in the EU19 has risen sharply in 2021, overshooting the target much more than ECB staff had projected in consecutive forecasts. Some relief is likely to be forthcoming in the January numbers, when last year’s boost from the reversal of Germany’s VAT cut and the introduction of carbon emissions allowances will drop out of the annual comparison. Aided by this, we expect a fall in EU19 inflation of about ¾ percentage points. But inflation may well nudge up again through the spring, albeit remaining below its December 2021 peak of 5.0%. For 2022 and 2023 as a whole, we expect headline inflation rates of 3.8% and 1.8%, respectively, as supply disruptions ease and energy prices eventually slip, as futures suggest.
What matters most for the medium-term inflation outlook is the labour market and wages. The unemployment rate now stands at 7.2%, just shy of the 7.1% pre-pandemic low. Notably, this improvement has occurred despite a rebound in the participation rate, which is back to pre-pandemic levels at 64.7%. Other indicators too are pointing to tightening conditions, with the level of employment and the employment-to-population ratio effectively at pre-Covid levels. Meanwhile, the Eurostat measure of labour market slack is close to levels before Covid-19. All this taken together could suggest that a degree of wage pressure could be seen going forward, although to date official data has yet to show this.
Given the labour market recovery and the inflation outlook, the European Central Bank (ECB) should follow in the footsteps of its peers, albeit on a delayed basis. QE still looks set to be conducted throughout 2022. But the last ECB meeting laid out plans for a gradual tapering of asset purchases from the current monthly pace of €70bn* to €20bn in the fourth quarter, before, as we suspect, ending them in December. In terms of interest rates, the Overnight Index Swap (OIS) forward curve is fully pricing in a 10 basis point hike by November. We see this as too aggressive, given the ECB should still be conducting QE at that time. Instead, we suspect the ECB will leave a gap of six months between the end of QE and raising rates in June 2023. Ultimately, we see the deposit rate going up to 0% by the end of 2023.
We suspect the ECB will leave a gap of six months between the end of QE and raising rates in June 2023.
This policy backdrop underpins our view of the euro-dollar exchange rate, our forecast for the end of 2022 remaining at $1.20 and our 2023 target at $1.25. However, in the first half of 2022 there are a number of political events which could wobble the euro, albeit on a temporary basis. The most uncertain of these is the imminent Italian presidential election. At present, it is unclear who will succeed Sergio Mattarella. Mario Draghi remains the favoured candidate, but should he take the presidency, it could trigger instability in the current unity government. Italy is, however, not the only major country to host elections. France is also going to the polls, although Emmanuel Macron looks set to retain his position.
United Kingdom
The surge in Covid-19 cases driven by the Omicron variant has begun to ebb away as quickly as it flowed in. From a peak of 219,000 on 4 January, reported daily cases have broadly halved. Various reporting issues suggest that some care is required in the exact interpretation of the data. But the bigger picture is that the impact of the latest wave has been relatively modest – hospitalisations are half that of the peak a year ago and may now be declining. Overall, a combination of a high vaccination rate, prior infections and perhaps the fact Omicron is a less virulent strain have contained the impact. A low number of influenza cases will also have helped to limit the wider repercussions.
Chart 5: UK Covid infections decline rapidly; hospitalisations start to fall too
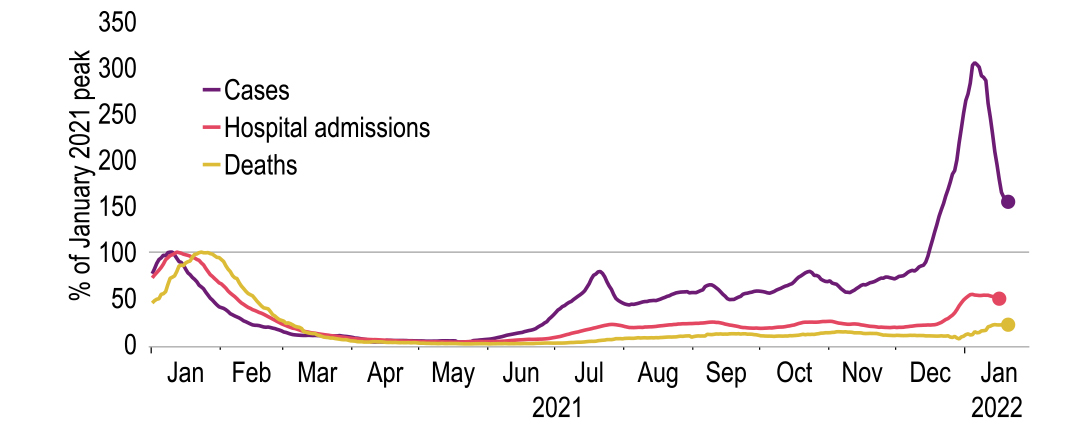
Sources: Macrobond
These trends have enabled the government to jettison ’Plan B’ and unwind nearly all of the measures, such as working from home. Moreover, the direction of travel is now towards ‘living with the virus’, all but ruling out any more restrictions. GDP grew by a healthy 0.9% in November and although we see a weaker patch around the turn of the year, a boost to the economy should be visible in February and beyond. Higher inflation may now be a greater obstacle to growth than Covid-19, not least given the upcoming rise in the energy price cap. But we maintain that real incomes are still likely to rise this year. Also the saving ratio, at 8.6% in the third quarter of 2021, has scope to fall and excess savings, which we estimate at £162bn, will help support consumption.
Ofgem’s upcoming announcement in early February of the utility price cap applicable from April has moved firmly onto the public radar. Mechanically, our utilities analyst has calculated the dual-fuel cap ought to rise to £1,907. This would be 49% up from current levels, which appears politically unacceptable. We have assumed £300 will be sliced off through some government mitigation measures, limiting the rise in April to 26%. If so, the resulting boost to the inflation rate would be kept to 0.8 percentage points rather than 1.5 percentage point. We also assume further mitigation to prevent the additional rise of circa 10% in utility bills that would currently mechanically follow in October 2022.
Amid a tight labour market, we now think it more likely that the Monetary Policy Committee (MPC) will hike policy rates three times this year rather than two (in February, May and August), by 25 basis points each.
That said, higher utility bills are not the sole factor driving up inflation. Atypically, non-energy industrial goods have increasingly contributed too, making price pressures more broad-based. Sudden sharp shifts in demand patterns and supply chain disruptions played a major part in that, we suspect. Both should gradually abate. But it may take longer for inflation to approach its target. We now forecast headline CPI inflation of 5.0% and 2.1% in 2022 and 2023, and core inflation of 3.7% and 2.2%. Given this, amid a tight labour market, we now think it more likely that the Monetary Policy Committee (MPC) will hike policy rates three times this year rather than two (in February, May and August), by 25 basis points each.
Chart 6: Polls show largest Labour lead over Conservatives in nearly a decade
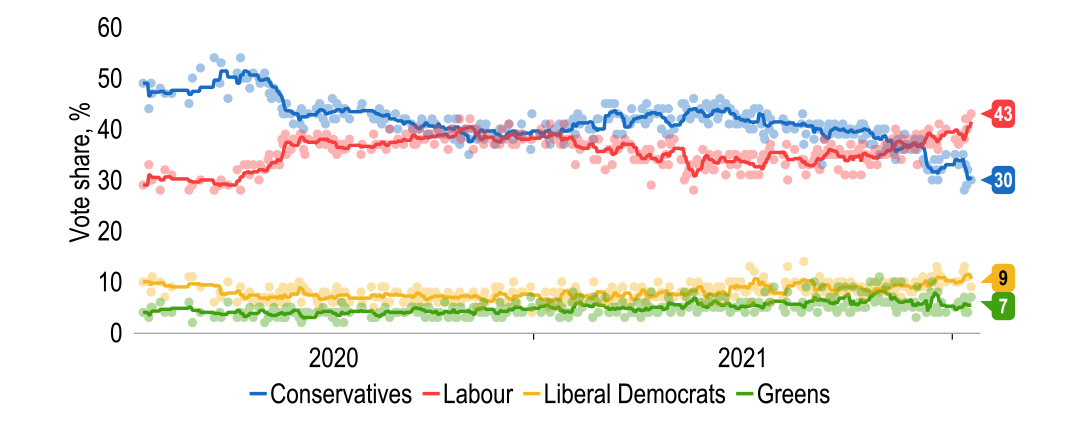
Note: Solid lines indicate five-poll moving averages
Sources: Macrobond, Britain Elects
This would mean not only ‘passive’ QT beginning from February, but, once the bank rate reaches 1%, ‘active’ gilt sales starting too from August. The MPC may then pause to assess the impact of this before raising rates further, most likely twice in 2023. Inflation is, of course, not only a concern for the BoE, but increasingly for the public. Indeed, the rising cost of living and the barrage of leaks alleging Prime Minister Boris Johnson and other No. 10 staff attending rule-breaking social events have both seen the Tories suffer in opinion polls. Conservative support has reached the lowest since the 2019 general election, and gives Labour its largest polling lead since 2013. With inflation likely to remain elevated and fiscal tightening set to take place from April, it could be a long road back to popularity.
Helped by better Covid-19 trends, sterling shrugged off a soft period late last year and, despite recent wobbles, has been one of the stronger major currencies so far in 2022. We have fine-tuned our view of the UK unit and now expect a slightly faster path towards our end-2022 target of $1.48. Our forecast for the euro-sterling rate for the end of the year remains 81p. Our respective forecasts for end-2023 are $1.53 and 82p. We do not consider current political issues to be a material threat to the currency, principally as the potential replacement of the prime minister from his own party would be unlikely to result in a sterling unfriendly reorientation of policy.
Get more FX market insights
Stay up to date with our FX insights hub, where our dedicated experts help provide the knowledge to navigate the currency markets.
Browse articles in
Please note: the content on this page is provided for information purposes only and should not be construed as an offer, or a solicitation of an offer, to buy or sell financial instruments. This content does not constitute a personal recommendation and is not investment advice.