
1 Jun 2026
Technical Services valuation update – Q1 2026
Sector multiples have reset above the long-term median – but the index average masks the real story.
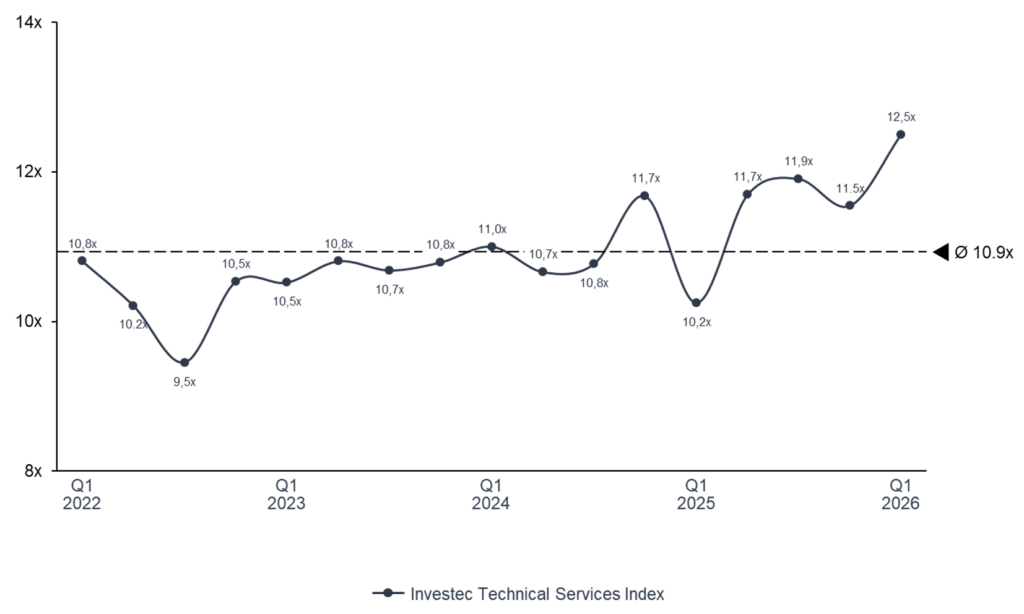
The Technical Services Index is trading at 12.5x EV/EBITDA in Q1 2026, +1.6x above the long-term average of 10.9x and +2.3x above Q1 2025.
Investors are no longer pricing technical services as a single cyclical block. After three years of selective re-rating, the market has unbundled the index into four distinctly priced narratives – power, project execution, recurring service quality, and engineering scarcity – andthe spread between them is at its widest of the cycle.
Resilient deal volumes (67 European transactions in Q1) and a step-up in cross-border participation (40%, vs. low-30s through 2025) confirm that buyer appetite remains intact, but selectivity has sharpened materially.
What’s behind the re-rating
The index has rebuilt steadily since the Q4 2022 reset, but the path has not been linear. Multiples held in a narrow band through 2023–24 as investors worked through the rate-shock repricing, then accelerated through 2025 as backlog visibility, energy-transition capex and the AI infrastructure build-out translated into earnings upgrades – not just multiple expansion. The current premium to long-term mean is being underwritten by delivered earnings, not narrative. That distinction matters for what comes next.
The market is rewarding service models that combine recurring revenues, mission-critical exposure and demonstrable margin expansion – and applying a clear discount everywhere else.
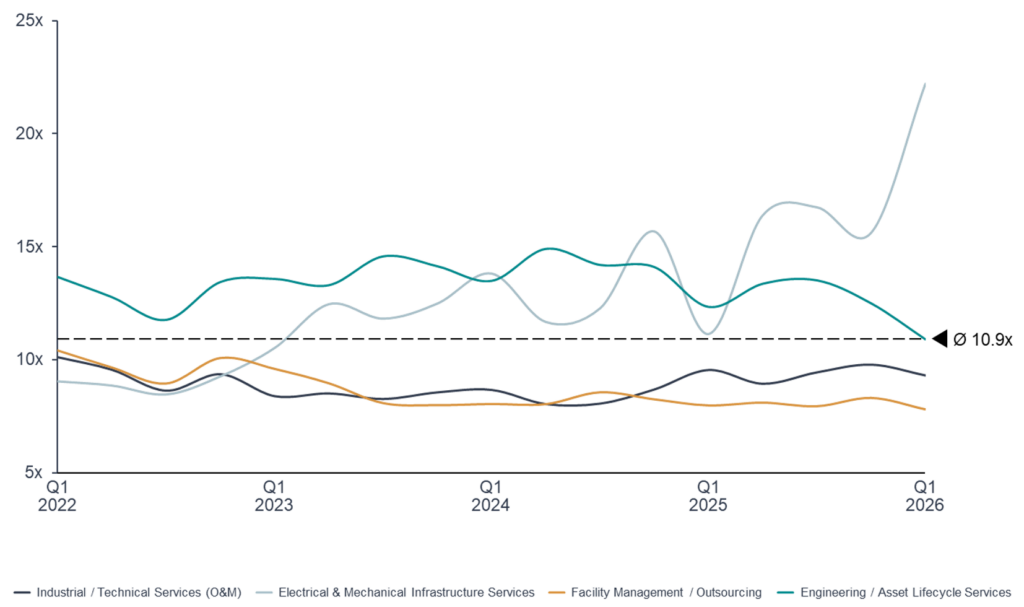
EV/EBITDA: Segment comparison Q1 2022 – Q1 2026
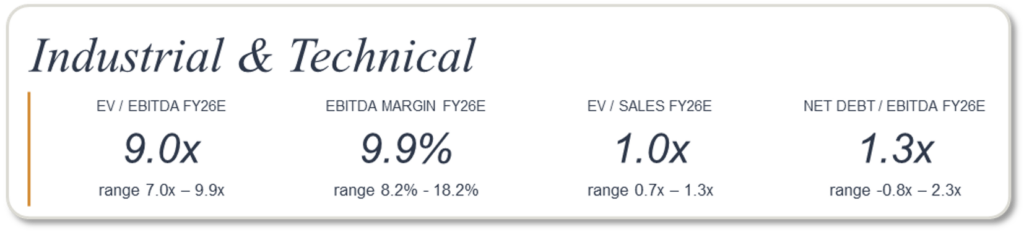
The segment trades broadly in line with the index, supported by a clear and increasingly consistent strategic playbook across the leading platforms.
- Margin ambition has reset structurally upwards across the multi-technical platforms – medium-term EBITA targets now cluster in the 8–9% range, a step-up from the 6–7% delivered through the prior cycle, and forward 2027E multiples already compress to ~8.6x as the market underwrites delivery
- Portfolio repositioning toward energy transition, data centre and pharma end-markets is a segment-wide strategic priority, replacing legacy oil & gas and general industrial exposure
- Bolt-on M&A remains the primary growth engine – leading platforms are deploying capital at a pace materially above prior cycles, supplied by a still-fragmented European mid-market
- Pricing power has shifted to providers as labour scarcity in skilled trades has changed the negotiating dynamic on outsourced industrial maintenance contracts
- Mission-critical backlog mix is rising – multi-technical service contracts are increasingly anchored in regulated, safety-critical infrastructure, lifting the recurring component of revenue
Investors are paying for delivery on stated margin paths and continued M&A optionality. Tolerance for execution slippage is limited.
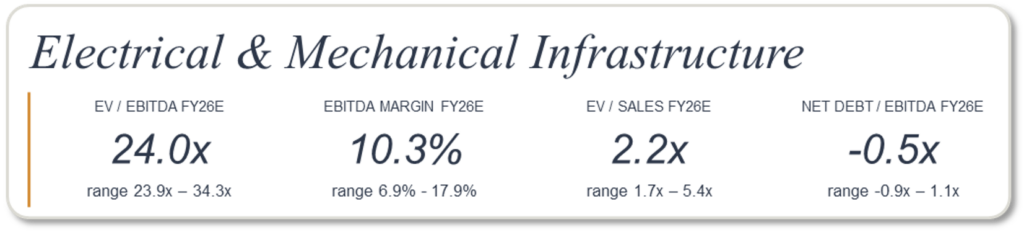
The standout segment of the cycle, with a valuation premium of ~16 turns versus Facility Management – pricing structural exposure to the most concentrated capex super-cycle in industrial services.
- Combined backlogs across the cohort have grown +34% year-on-year, with hyperscaler-driven data centre work the fastest-growing pocket and electric grid build-out providing a multi-year secondary leg
- Customer mix has pivoted decisively toward technology buyers across the cohort – hyperscaler and data-centre work is now a meaningful share of new awards across the cohort, with the most exposed names having moved from a structurally limited share of revenue to majority technology exposure inside two years
- Capacity expansion is the segment’s strategic priority – both physical capacity and contracted labour pools through master service agreements are being scaled materially across the cohort to convert record backlogs
- Selective M&A in specialty electrical and mechanical adjacencies is reinforcing premium positioning rather than diluting margin
- Margins are at or near cycle peaks and balance sheets are increasingly net cash, providing optionality without near-term re-leveraging risk
The risk is asymmetric: 24.0x embeds a multi-year continuation of current capex trajectories. Historical analogues from prior pauses suggest 30–50% multiple compression within weeks of any confirmed inflection. Investors are paying for backlog duration, not cycle-stage normalisation.
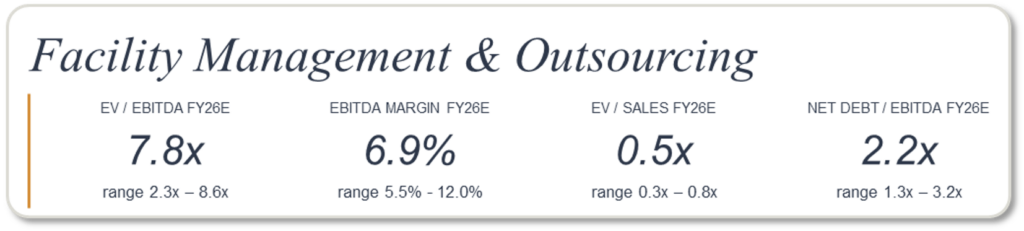
The structural laggard of the index – but the discount is becoming differentiated, and that bifurcation is the more important development.
- The segment-level discount reflects genuine fundamentals – lowest aggregate growth (4.8% in 2025/26), thinnest margins (6.9%) and highest leverage (2.2x net debt/EBITDA)
- Mix shift away from manned services toward technology-enabled and compliance offerings is the defining strategic playbook for the leaders
- Balance-sheet discipline through systematic capital return – sustained buyback programmes and progressive dividends – is increasingly part of the equity story
- Selective M&A in higher-margin adjacencies is repricing the leaders – security technology, integrated workplace technology, compliance and TIC services have transacted at multiples well into the teens
- Evidence of strategic delivery is accumulating at the leading end of the segment – long-stated medium-term margin targets are being hit, technology mix is now meaningfully contributing to profit pools, and contract pipelines have expanded materially through the most recent reporting cycle
- The laggards have validated the discount – material guidance downgrades among segment incumbents, including organic growth resets to near-flat and margin reductions of more than 100 basis points within a single fiscal year, reinforce the case for selectivity
Buyers are paying up for technology mix and recurring contract quality. Pure manned-services exposure remains comprehensively discounted.
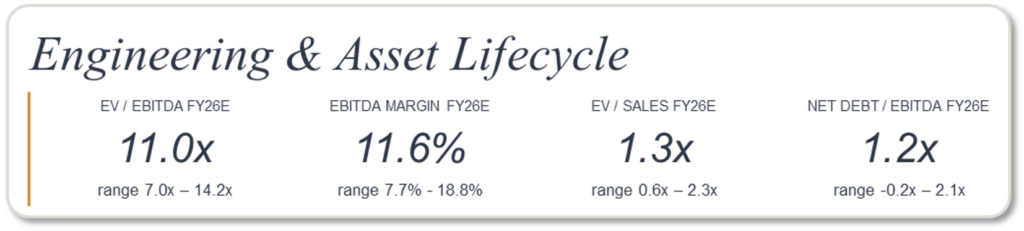
The most strategically coherent segment in the index, and the one where M&A is most actively reshaping the peer set.
- Three converging structural advantages underpin the premium – highest aggregate margins in the index (11.6% segment median FY26 EBITDA, with the upper quartile delivering 17–18%), multi-year backlog visibility through long-cycle programmes, and direct exposure to scarce specialist verticals
- Scarce-vertical exposure is the primary valuation driver – nuclear new-build and refurbishment, water infrastructure, grid and energy transition, and defence
- Strategic acquirers are paying materially for energy positioning – recent transactions in energy-transition consulting have priced at 14–15x pre-synergy EBITDA, well above the wider segment average
- A margin-convergence story is playing out across the leading end of the segment – platforms with publicly stated medium-term Adjusted EBITDA targets in the 17–20% range are now at or within 100 bps of those targets
- Capital allocation is broadening from M&A-only toward buybacks as platforms approach their margin targets, signalling cycle maturity at the leading end
Premium pricing of scarce specialist capability and disciplined margin convergence at the leaders will drive most of the stock selection within Engineering through 2026.
M&A activity – selectivity, scale, and the rise of cross-border
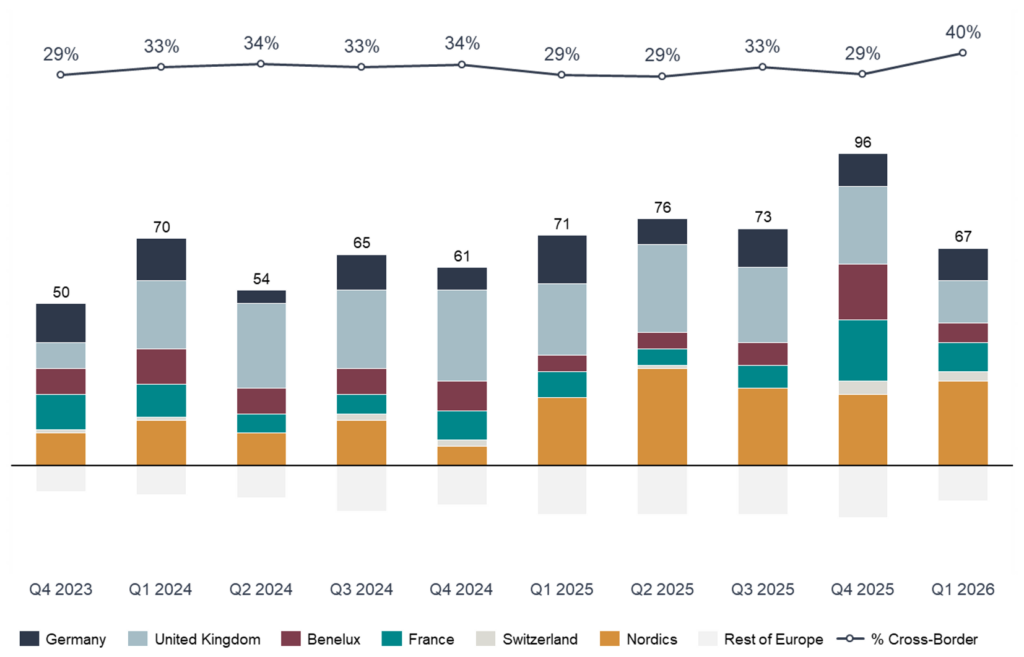
Q1 2026 confirmed two of our central theses on the European deal market. First, transaction volumes have remained resilient at 67 deals – broadly in line with the four-quarter average – despite higher financing costs, indicating that strategic and sponsor capital deployment is now structurally embedded rather than cycle-dependent. Second, and more importantly, cross-border participation rose to 40%, materially above the c.33% trailing pattern of the past two years.
The cross-border step-up reflects two reinforcing dynamics. Strategic acquirers – particularly those repositioning toward power, energy transition and nuclear – are reaching across borders to acquire specialist capability that cannot be built organically at the required pace. Sponsors, in parallel, are increasingly comfortable underwriting multi-jurisdictional roll-up theses where local-champion platforms can be combined into pan-European leaders. Recent benchmark transactions in the period – including a $3.3bn engineering acquisition disclosed at 14.5x pre-synergy EBITDA and a c.€4bn sponsor recapitalisation in European facility management at an estimated 12–13x – confirm both the depth of capital available and the multiples that scale platform assets continue to command.
For owners, this matters concretely: competitive tension in well-run sale processes is increasing, and the buyer universe for premium assets is materially larger today than in any year since 2021.
Investors reward profitable growth

The two charts make the underwriting model of today’s market explicit. Forward sales growth tracks tightly with FY26 trading multiples – each percentage point of expected growth corresponds to roughly half a turn of EV/EBITDA – while FY26 EBITDA margin shows no meaningful relationship at all. Read together, the pattern confirms what the segment commentary has set out: the market is paying for visible, contracted growth, with margin acting as the qualifier that separates underwritten growth from narrative growth, not as a primary driver in its own right.
What this means for owners and investors
For entrepreneurs, the message is sharper than at any point in the past three cycles. Premium valuation outcomes are increasingly driven by recurring revenues, demonstrable margin resilience, and the ability to articulate strategic relevance within a defined value chain – not by aggregate growth. Top-line CAGR alone no longer commands a premium. Buyers are dissecting revenue mix, contract duration, and end-market exposure with substantially more discipline than they applied during the 2021 peak.
For investors and strategics, selectivity is paramount. Scaled platforms with clear consolidation theses, recurring service exposure, and defensible end-market positions continue to attract the deepest pools of capital and the highest exit multiples. Generic exposure – to construction cyclicality, to manned-only services, to government-revenue concentration, to mid-cycle margin levels – is being systematically discounted.
In today’s market, valuation premiums are not driven by growth in isolation. They are driven by visibility, resilience and strategic scarcity – and the index dispersion at the close of Q1 2026 is the clearest evidence yet that buyers are pricing accordingly.
The Investec Technical Service Index tracks daily developments across the technical services landscape, covering sectors such as Maintenance & Repair, Installation & Commissioning, Engineering Services, Asset Management and Field Services. The index includes valuations, growth projections, profitability margins and other key metrics. You can find more information on our website and specific industry insights in our latest Industrial Services Report.
Investec has a senior team in Technical Services, who are experienced experts in selling, buying, and financing businesses. If you have questions and would like to know more about valuations, buyer activity and current opportunities in the market – please get in touch: [email protected], [email protected], [email protected], [email protected], [email protected]