For each, a road; For every man, a religion; Find everybody and rule; Everything and rumble; Forget everything and remember; For everything, a reason.
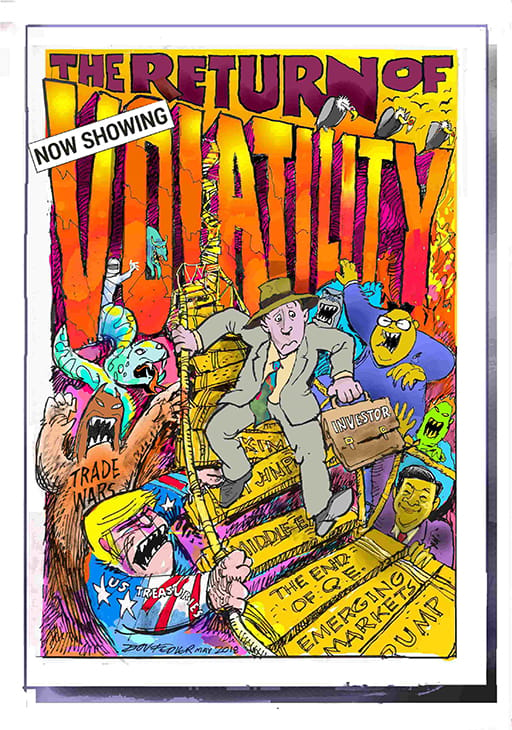
One of the clearest characteristics of financial markets this year has been the return of volatility (and fear), after a long layoff. By many measures, 2017 was one of the least volatile years on record, so its return in 2018 has certainly shaken many investors.
But as we hope to demonstrate in this article, volatility is not the enemy of investing. Indeed, because it is so intrinsic to financial markets, it can present a useful opportunity to astute investors. Furthermore, high levels of volatility do not necessarily translate into worsening returns.
Before going into why we should not necessarily fear volatility, let’s look at a few concepts about volatility and markets.
Volatility, simply put, describes the amount by which the price of a security varies over a given period of time. Large rises and falls on a day-to-day basis will characterise a volatile share, index, currency or bond. However, because as humans we tend to feel the pain of a loss more acutely than the joy of a gain, we tend to notice volatility more when shares fall than when they rise. So we associate volatility with the risk of loss, rather than the potential for gain.
Higher volatility can be a useful tool for the smart investor or trader. For a longer-term investor, volatility matters less, because solid fundamentals will always outweigh short-term effects over the longer period. To use the oft-quoted saying by Benjamin Graham: in the short-term the market is a voting machine, in the long term it’s a weighing machine.
Long-term investors will welcome bouts of volatility because they see sharp falls as an opportunity to buy a share at a cheaper price. A common lament among leading investors goes along these lines: “I really like this company, but at this price / valuation I can’t justify buying it.” Volatility gives such investors the chance to buy previously expensive shares.
For traders, volatility provides the opportunity to make money from betting on short-term moves, often through derivatives like futures or options, or through contracts for difference. Of course it also gives the opportunity to lose large sums of money too, so you really need to know what you’re doing. Professional traders will adopt various strategies for playing volatility in different ways. It’s not a game for the fainthearted.
For the purposes of this article, we’ll be focusing on the importance of understanding volatility for investors who take a longer view. But first, a few definitions.

Ways of measuring volatility
Investors typically look at the standard deviation of a stock, index or any other price over a period of time. Standard deviation is a statistical measure of how much a price has differed from its mean over a given period of time.
Various measures that use volatility as their core have been adopted by the investment industry to quantify how much risk was taken to realise a gain. These include the Sharpe ratio and the Sortino ratio. The greater the volatility, the greater the risk taken.
Implied volatility
Markets are forward looking, so historical volatility measures don’t necessarily tell you much about how a share will behave in the future. So many analysts therefore look at measures of how much volatility the market is expecting. A good way to do this is to look at option prices, and the amount of volatility that is priced into them. Volatility is the lifeblood of option pricing: the premium (the right to buy or sell a security at a set price sometime in the future) will rise or fall based on the implied volatility of the underlying security.
Implied volatility is thus a good measure of how skittish or relaxed the market is about future price movements. And numerous exchanges now publish indices of such volatility, that one can further trade in.
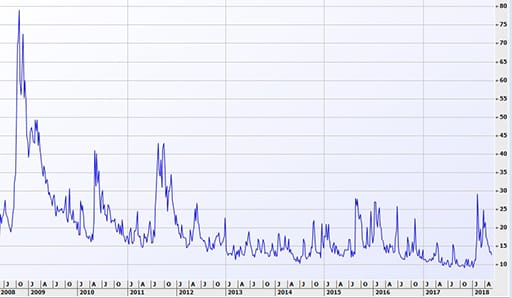
The most famous of these is the Chicago Board Options Exchange (CBOE) Volatility Index, better known as the VIX. The VIX, introduced in 1986, measures the volatility implied by the price of options on the S&P 500, and is often called the “fear index” because it is a good barometer of investor sentiment. The higher the VIX, the more fearful the market is of losing money; the lower it is, the more relaxed markets are.
Similar indices exist for other stock markets around the world, but because global stock markets tend to move together and the S&P 500 is the largest, the VIX is used as the standard for equity markets generally. Volatility indices also exist for bond and currency markets.
VIX over the years

Source: Iress
As the chart above shows, 2017 was one of the least volatile years for the market. It hit an all-time low of 9.14 in November, and fell by about 17% over the course of the year. It fell below 10 a total of 52 times in 2017 – this compares with nine times over the previous 27 years. It fell below 10 another five times at the start of the year, before spiking again to over 30, as our chart shows (including an intraday high of 50). It has since settled again, but it does appear as if we are back into a higher volatility phase.
None of this should be a surprise when we consider some of the market moves over the last few months. US dollar strength, rising US yields and uncertainty over the outlook for US short-term rates (three rate hikes or four this year is the big question), together with the breakdown in the synchronised growth story that defined the world economy over the second half of last year, have all contributed.
So too have the ongoing geopolitical events around North Korea, trade tensions between the US and China and political upheaval in Europe. But what does this mean for market returns from here on?
Forget everything and remember
We forget that market turning points have often come when fear and overconfidence have been at extreme levels. We need to look beyond the emotion that indicators portray. Just as there was no reason to be complacent during last year’s period of low volatility, one should not fear the worst just because of a spike in volatility.
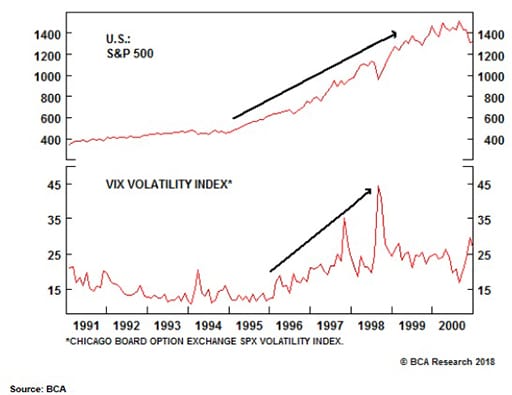
As the chart below shows, periods of heightened volatility have often been associated with rising market returns. Those of us with long memories will remember the 1990s as a period of major market upheavals, including the Asian currency crisis of 1997 and the Russian debt crisis of 1998 (both clearly identifiable in the VIX chart), yet the S&P 500 set a number of record highs over that period, despite these bumps in the road.
Volatility over the years

It’s also interesting to note that US equities have often done well in the six months after a VIX spike. For example, the S&P 500 rose 23% after the Asian debt crisis in October 1997 (VIX at 38.2), 17% after the 9/11 attack in September 2001 (the VIX hit 43.7) and 21% in August 2011 (when fears about the European periphery were high and the VIX hit 48). Even in the six months after the VIX hit 80 in October 2008 at the height of the financial crisis, investors would have come out even after six months (note: equity markets bottomed in March 2009, before rebounding strongly – at its bottom, the S&P 500 was over 30% down on the previous six months).
When investors should perhaps be rightly fearful is when a VIX spike leads into a recession. However there are few indications that we are into that scenario here. Central banks are still largely cautious about moving too quickly from their previously very loose monetary policy stance, into a more normal stance.
So far, the European Central Bank and Bank of Japan are still engaging in asset repurchases, though the pace of the former has slowed and there is talk that it may scale it back further this year. The US Fed is the only major central bank in a tightening cycle, but these are still at very low interest rates.
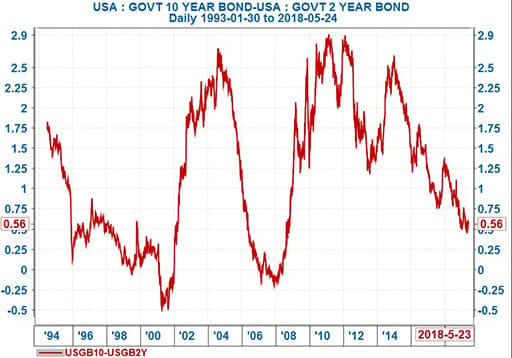
History shows that the warning sign is the yield curve, rather than the VIX. The last seven US recessions have followed a yield curve inversion, usually when the Fed is deep into a hiking phase. This is the point when short-term interest rates are higher than long-term rates. The chart below (the difference between US 10-year and two-year Treasuries), shows the last two of these inversion points, when the gap fell below 0, in 2001 and 2007. Both were followed by recessions. With 10-year rates still about 0.5 percentage points above two-years, we should still have some way to go.
US yields 1994 to 2018

Source: Iress, I-Net
Conclusion – the only thing we have to fear is fear itself
The current bout of volatility is not remarkable by historical standards. However we appear to have noticed it more, simply because of the unusually low volatility period that preceded it. Measured volatility rates do however tend to be mean reverting, in other words they usually swing back to close to their average levels whenever they’ve been out of kilter for a while. It’s also important to keep an eye on other market indicators before making conclusions about what they are signalling.
About the author

Patrick Lawlor
Editor
Patrick writes and edits content for Investec Wealth & Investment, and Corporate and Institutional Banking, including editing the Daily View, Monthly View, and One Magazine - an online publication for Investec's Wealth clients. Patrick was a financial journalist for many years for publications such as Financial Mail, Finweek, and Business Report. He holds a BA and a PDM (Bus.Admin.) both from Wits University.
Receive Focus insights straight to your inbox


