Market and economic snapshot:
- The JSE All Share returned 3.4% in April (year-to-date +8.7%).
- The JSE All Bond Index fell 1.1% in April (year-to-date +2.2%).
- The rand weakened significantly against the US dollar, falling from around R17.80 to R18.30, while Brent crude fell to US$78.08/barrel from US$81.50/barrel.
- SA consumers are likely to come under pressure, with the impending petrol price increase in May, driven primarily by the performance of the currency.
- The best performing sectors in April were consumer discretionary (+5.7%), resources (+4.1%) and health care (+3.6%).
- The worst-performing sectors in April were communication services (+1.8%), general retailers (+1.5%) and industrials (+3.1%).
- The SA Reserve Bank surprised markets with the decision to hike interest rates by 50bps (consensus expectations of 25bps).
- The SA Reserve Bank plans to adjust its interest-rate model and sees a better core CPI – but Eskom outages remain a material upside risk to inflation outcomes.
- SA risks worsening trade relations with the West over its position on the Russia/Ukraine war and threats to withdraw from International Crime Court (ICC) over the Putin arrest warrant.
- US authorities took over First Republic Bank and sold most of its operations to JPMorgan – this against a backdrop of a confidence crisis in regional banks, rising interest rates and questions around US banking regulation. We view the swiftness of the resolution of First Republic Bank by the Federal Deposit Insurance Corporation (FDIC) as testament to the improvements in the regulatory environment since the Global Financial Crisis.
- Chinese GDP came out at 4.5% in the first quarter, slightly below the government’s forecast of 5%. The reading is a strong indicator of the strength of the China reopening trade and is positive for countries such as South Africa, which could benefit from increased demand in China.
- Increased geopolitical fragmentation, as 19 countries express a desire to join the BRICS bloc.
- De-dollarisation trend picks up steam as countries reduce their US dollar reserves.
- The property sector around the world faces rising office space vacancies in the new post-Covid era as more employees embrace working from home.
- South Africa’s National Treasury passed and then withdrew temporary regulations barring state-owned enterprises Eskom and Transnet from disclosing irregular expenditures in financial statements.
Thematic view: Turning the inflation corner
The inflation story continues to dominate headlines globally. The pace at which inflation moderates is a central theme for central banks because of its implications for monetary policy globally, in the light of central banks’ aggressive hikes in interest rates to bring inflation under control. At the moment, inflation remains above most central bank targets but continues to move in the right direction for most countries. However, the sticky nature of inflation has forced central banks to continue hiking rates. The questions now are, when will the present hiking cycle come to an end? When will central banks begin to cut interest rates? And what are the implications for broader market performance?
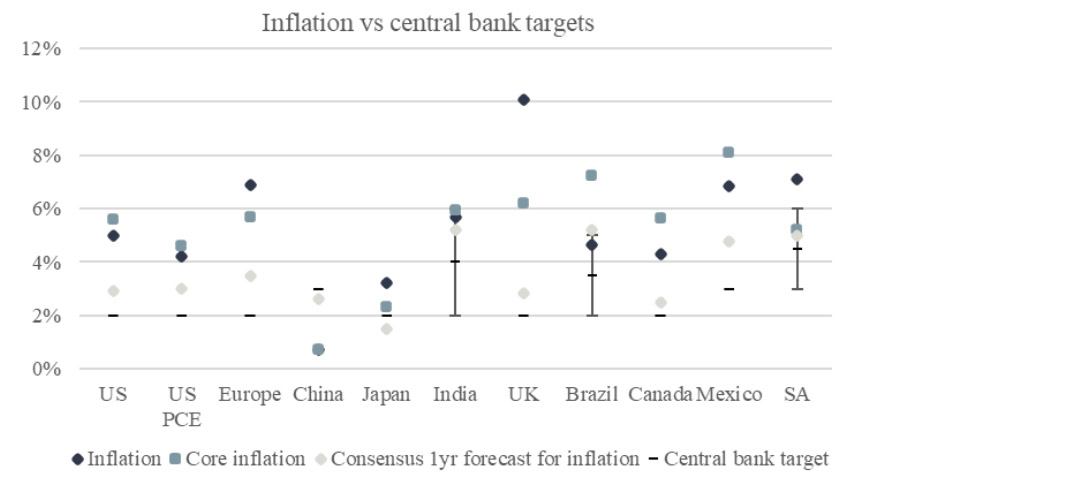
Chart 1: inflation versus central bank targets
Date sampled: 2 May 2023
Source: Investec Wealth & Investment, Bloomberg
Chart 1 illustrates where inflation is across a select group of developed and emerging market economies and where we would expect inflation to be in a year’s time relative to central bank targets. Most emerging markets are expected to have inflation under control by this time next year, except for Mexico. The opposite is true for the select group of developed markets where inflation is expected to remain above the central bank target one year from now. This has significant implications for central banks.
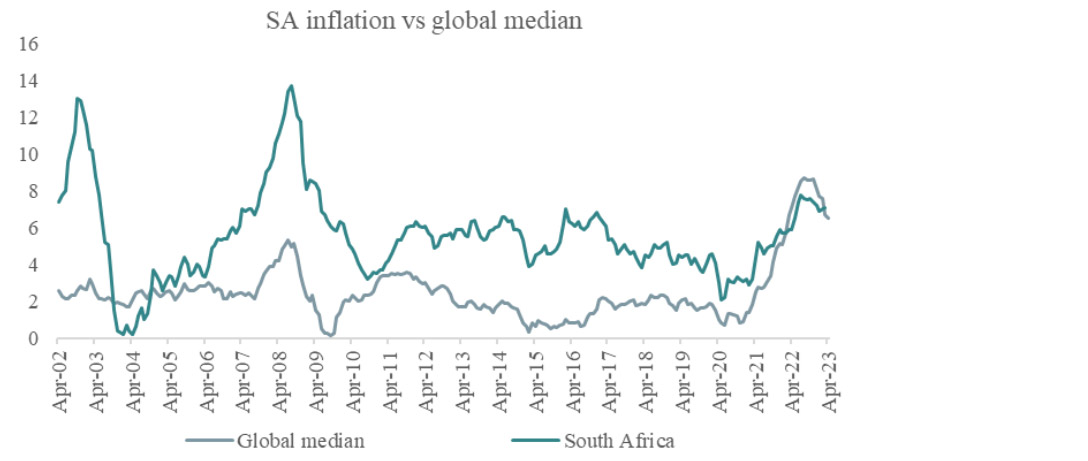
Chart 2: South Africa versus global inflation
Date sampled: 2 May 2023
Source: Investec Wealth & Investment, World Bank, Bloomberg
The UK and South Africa stood out in April when their relative inflation prints for March came out ahead of expectations. The higher-than-expected inflation prints flag the risks attached to continuing interest rate hikes. Chart 2 above shows South African inflation relative to the global median. South Africa’s inflation for March came in above the global inflation median for the first time in several months, remaining sticky even as inflation across the globe has been falling rapidly.
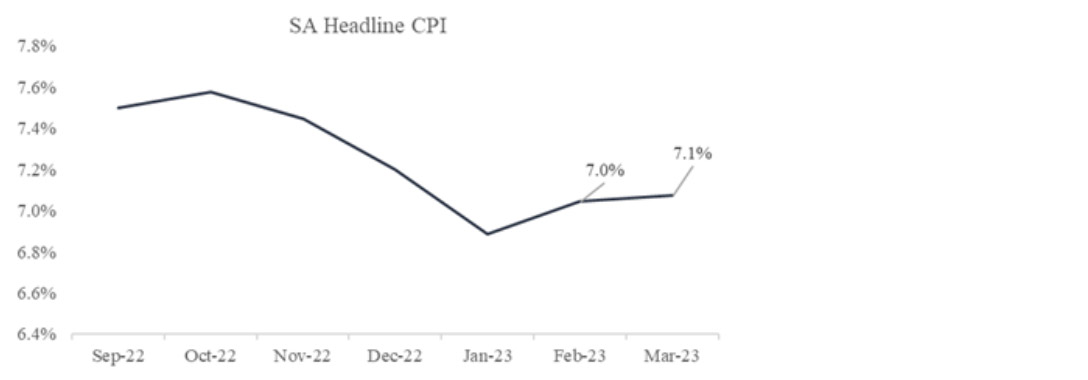
Chart 3: South African headline CPI
Date sampled: 19 April 2023
Source: Investec Wealth & Investment, StatsSA
It’s worth looking more closely at what’s been driving South African inflation. Transport inflation, primarily driven by fuel prices, has continued to move in the right direction thanks to a lower Brent crude oil price. Transport inflation came out at 8.9% for March versus 9.9% in the previous month. However, the real problem child in the headline inflation series was the category food and non-alcoholic beverages, which hit its highest reading since 2009 in March, at 14%. It’s safe to assume that load-shedding is having an impact on the production process and that producers are passing higher production costs onto the consumer. Note that global agricultural commodity prices have seen sustained decreases in recent months.
At the April SA Reserve Bank Monetary Policy Committee (MPC) press conference and interest rate announcement, the Bank indicated that it expected food inflation for 2023 to be 9.9% (we have a lower forecast). However, the apparent current sticky nature of food inflation poses significant upside risks to the inflation trajectory and therefore the interest rate outlook.
Our base case is for food inflation to cool to between 5% and 8%. Wandile Sihlobo of AgBiz SA recently came out with a base case estimate for food inflation being between 7% and 8%, so we are more or less in line with his outlook. Fuel does not appear to be an issue. Brent crude is still trading around US$80/barrel and the rand/US dollar exchange rate is around R18. However, our exchange rate and the price of fuel do have significant implications for inflation, especially when coupled with the energy crisis in South Africa. April inflation, particularly food and non-alcoholic beverages inflation, will be under scrutiny when the MPC meets later in May to decide on interest rates.
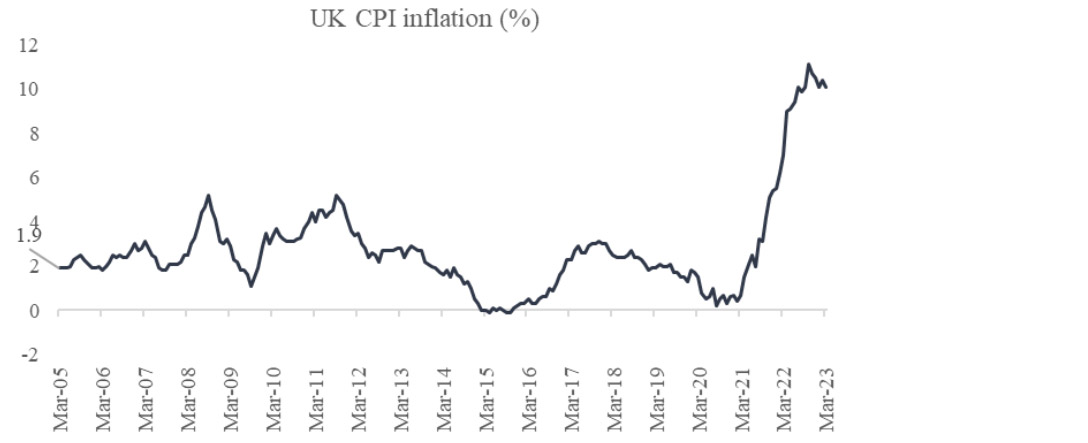
Chart 4: UK inflation
Date sampled: 2 May 2023
Source: Investec Wealth & Investment, Bloomberg
Looking elsewhere, UK inflation came out at 10.1% for March and continues to prove to be sticky at these elevated levels. The Bank of England is expected to raise rates by 25bps (0.25 of a percentage point) at its next meeting on 11 May, which will be its 12th consecutive interest rate hike.
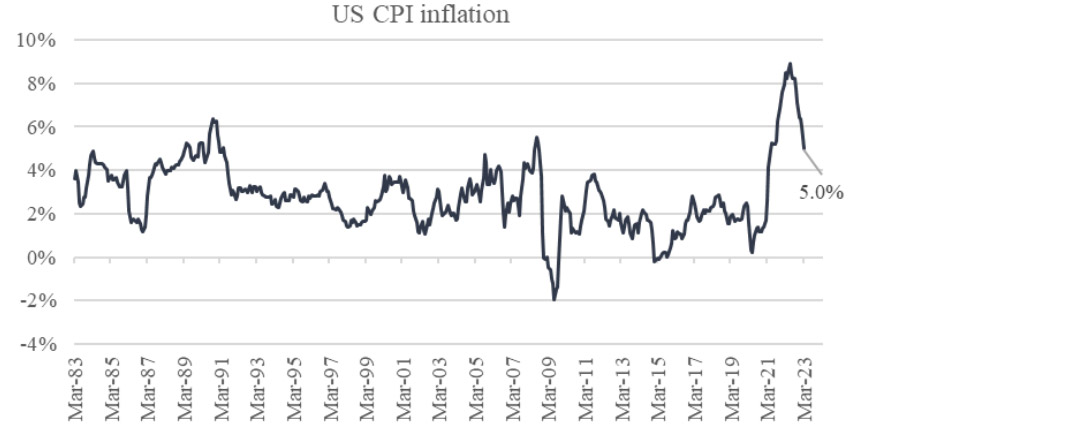
Chart 5: US inflation
Date sampled: 2 May 2023
Source: Investec Wealth & Investment, Bloomberg
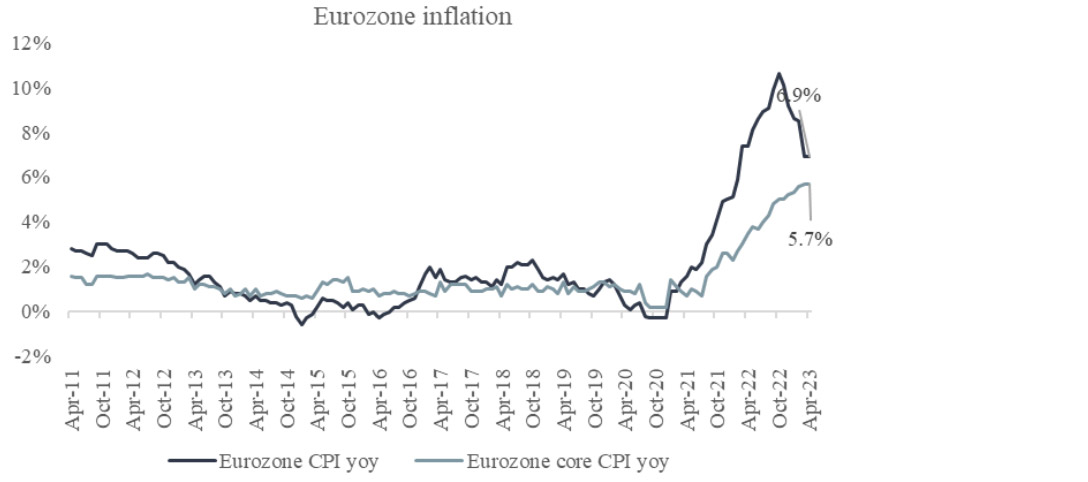
Chart 6: Eurozone inflation
Date sampled: 2 May 2023
Source: Investec Wealth & Investment, Bloomberg
Broadly speaking, inflation in most of Europe and the US continues to move in the right direction but remains uncomfortably higher than their respective central bank targets. The US Federal Open Markets Committee made unsurprisingly hiked rates by 25bps (0.25 of a percentage point), as per consensus expectations. What’s less clear is whether there will be a definitive pause in the interest rate hiking cycle. The future direction of rates (pause or continuing to hike) will be primarily driven by the pace at which inflation continues to roll over in the US, although the latest reading, at 5%, is still too high relative to the central bank target. Headline CPI in Europe has turned around sharply, but core CPI remains an issue, indicating that the components of core (mainly services) have remained relatively elevated in comparison to headline components (food, alcohol and tobacco remain high in the Eurozone while energy inflation has softened). The European Central Bank (ECB) is also expected to make an interest rate decision this week with expectations of a 25bps hike.
Table 1: S&P 500 (SPX) trough relative to interest rate cuts
| SPX Trough (Months after first rate cut) | |
|---|---|
| 30-11-71 | 3 |
| 30-09-74 | 3 |
| 31-07-82 | 14 |
| 30-11-87 | 8 |
| 31-10-90 | 17 |
| 30-09-02 | 21 |
| 28-02-09 | 14 |
| 31-03-20 | 9 |
| Median | 11 |
| Current | 0 |
Date: 2 May 2023
Source: Investec Wealth & Investment, Bloomberg
Given the inflation outlook, and returning to our earlier questions, we found that in the US, the S&P 500 typically bottoms around 11 months after the US Fed starts cutting rates. Since the Fed hasn’t yet started cutting interest rates, this means we should expect weak market performance for the foreseeable future. The outlook for interest rate-sensitive and cyclical sectors is particularly dim and should remain so until we get to peak short-term interest rates.
Get Focus insights straight to your inbox
Disclaimer
Although information has been obtained from sources believed to be reliable, Investec Wealth & Investment International (Pty) Ltd or its affiliates and/or subsidiaries (collectively “W&I”) does not warrant its completeness or accuracy. Opinions and estimates represent W&I’s view at the time of going to print and are subject to change without notice. Investments in general and, derivatives, in particular, involve numerous risks, including, among others, market risk, counterparty default risk and liquidity risk. The information contained herein is for information purposes only and readers should not rely on such information as advice in relation to a specific issue without taking financial, banking, investment or other professional advice. W&I and/or its employees may hold a position in any securities or financial instruments mentioned herein. The information contained in this document does not constitute an offer or solicitation of investment, financial or banking services by W&I . W&I accepts no liability for any loss or damage of whatsoever nature including, but not limited to, loss of profits, goodwill or any type of financial or other pecuniary or direct or special indirect or consequential loss howsoever arising whether in negligence or for breach of contract or other duty as a result of use of the or reliance on the information contained in this document, whether authorised or not. W&I does not make representation that the information provided is appropriate for use in all jurisdictions or by all investors or other potential clients who are therefore responsible for compliance with their applicable local laws and regulations. This document may not be reproduced in whole or in part or copies circulated without the prior written consent of W&I.
Investec Wealth & Investment International (Pty) Ltd, registration number 1972/008905/07. A member of the JSE Equity, Equity Derivatives, Currency Derivatives, Bond Derivatives and Interest Rate Derivatives Markets. An authorised financial services provider, license number 15886. A registered credit provider, registration number NCRCP262.


