

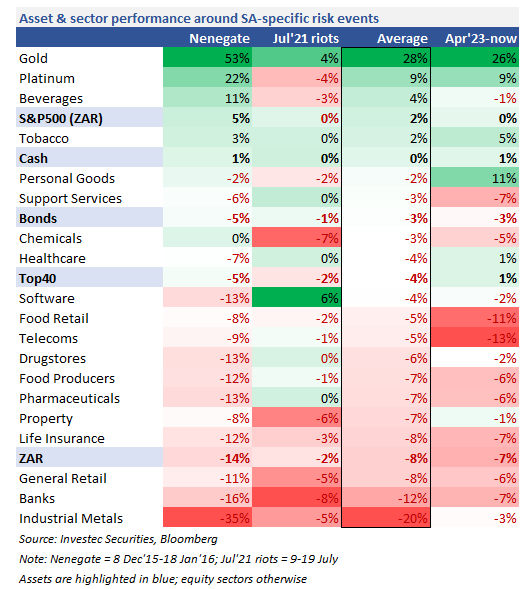
Bottom-line: Yesterday’s ZAR sell-off exacerbated the running theme of ZAR weakness and the outperformance of ZAR hedges vs. SA Inc. Compared to historical SA-specific risk events: food retail, telcos & Bidvest have been hit harder than usual; banks, property & drugstores have room to fall. ZAR stages impressive recoveries after blowouts (1985, 2001, 2008, 2015) but this isn’t a proper blowout yet; 2% depreciation on the day and -7% since April’s 17.80 turning point (Nenegate: 4% move on the day, and ZAR bottomed over a month later). Headwinds to SA Inc remain, even if/when the Russian-related newsflow fades: higher loadshedding stages (beyond 8), 50bp SARB hike in May (Investec forecasts +25bp), US debt ceiling, global recession. Long term investors can use the current weakness to build positions in best of breed stocks within SA Inc, but should take into account higher estimates for the risk-free rate (12.5%) and cost of equity (17%). Recent email raised our USDZAR range to 17.00-20.00 (previously 16.50-19.00). Reiterating ZAR trades: 1. USDZAR fence with strikes at 15.00 / 17.00 / 21.30 (28 Dec expiry); 2. 3-month 1-touch USDZAR trade
Sector performance … 1 April-to-date (recent ZAR turning point at 17.80): Outperformers = gold, PGMs, non-commodity ZAR-hedges. Underperformers = ZAR, SA Inc (across the board). Compared to historical SA-specific risk events: food retail, telcos & Bidvest have been hit harder than usual; banks, property & drugstores have been more resilient (table 1)
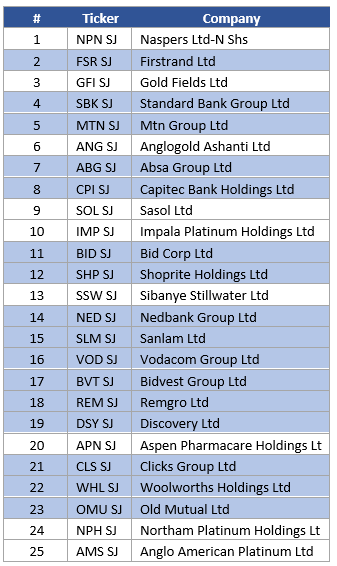
Foreign selling … Stocks most at risk = highest-weighted SA Inc stocks in MSCI SA (highlighted in blue in table 2). Note ZAR190bn outflow from SA equities & bonds YTD. SA comprises 3.5% of the MSCI EM index but only 0.4% of the MSCI All Country World index; i.e. the opportunity cost for offshore investors to wait until performance confirms a turnaround is low
ZAR pass-through to inflation … 10% ZAR depreciation = +2ppt to inflation over time. FRAs are now pricing in a 50bp hike for 25th May MPC
Higher cost of equity … SA 10y bond yield fair value estimate (table 3) = 12.5%; cost of equity = 17%. This takes into account local & global risks, of which there are many. Analysts have been using ~15% (range: 14-16%)
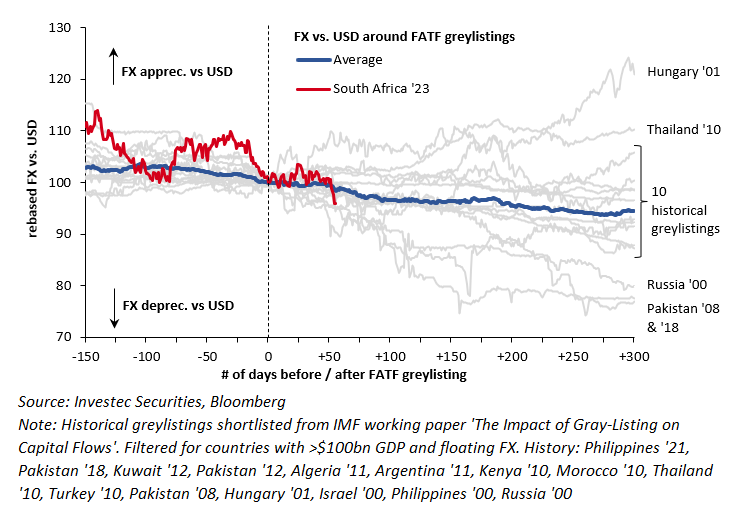
Consider FATF Greylisting as ‘sanctions lite’ … comparing the US sanction list with the FATF grey list shows that the bar for actual sanctions looks high / it’s not a decision that’s taken lightly, while the FATF grey list changes quicker, and covers a wider range of missteps. Added ZAR to our Oct’19 greylisting chart below. Note that the latest available data shows that SA was the biggest exporter to the US under AGOA (USD2.7bn)
Are we past the worst? History says ZAR recoveries are as impressive as the blowouts (1985, 2001, 2008, 2015 … many will recall my ‘M-shaped ZAR recovery’ chart). But this isn’t a blowout yet … we’ve had a 2% ZAR depreciation on the day; -7% since the April turning point. Nenegate: 4% move on the day; and ZAR bottomed over a month later. Headwinds: higher loadshedding stages (beyond 8), 50bp SARB hike in May (Investec forecasts +25bp), US debt ceiling, global recession. USDZAR at 19.20 is ~14% above PPP though, so long term investors can use the current weakness to build positions in best of breed within SA Inc
Reiterating our ZAR trades …
- Zero-cost USDZAR fence with strikes at 15.00 / 17.00 / 21.30 (28 Dec expiry)
Client sells 15.00 put (to help lift the upper bound while keeping overall structure at zero-cost), buys 17.00 put, sells 21.30 call
- 3-month 1-touch USDZAR trade
Pay ZAR53,500 premium for a ZAR1mn payout if ZAR touches 22.00 in 3 months

Best,
Nadeem