
StatsSA today published the results of the rebased and benchmarked GDP data. The revised data shows the size of the economy was 11% larger in 2020. Changes to the composition of the demand and supply side have raised the contribution from the (1) financial services and personal care industries on the supply side. On the demand side, the contribution from household consumption increased. Our takeaway from the changes in the economy's composition is that the economy's structure is even more biased towards consumption than the productive sectors of the economy. Fixed investment's share in the economy has moderated by nearly 2ppt to 14% from 16%. This indicates that potential GDP is possibly even lower than expected. However, the positive developments pertain to key ratios using nominal GDP as the denominator. The budget deficit, gross debt and current account balance as a percentage of GDP have all improved. The improvement in the fiscal ratios could conceivably remove the risk of further downgrades over the next 18 months or so. However, reviving the underlying growth trend through the speedier implementation of structural reforms and considering relaxing labor laws, with the expanded unemployment rate rising to 44% in Q2 21, remain critical to avoid a debt trap.
StatsSA noted that the "differences between previous and revised levels are a typical outcome of rebasing and benchmarking exercises. When Nigeria overhauled its GDP in 2014, it discovered that its economy was about 60% to 90% larger than previous estimates. The average increase between previous and revised GDP estimates across OECD countries was 3. 8% in 2010. This ranged from 0,2% for Luxembourg to 7,8% for South Korea.2 Latin America recorded an average increase of 8,8%3, and closer to home, Botswana revised the size of its economy down by 10%." South Africa is the third largest economy in Africa, after Nigeria and Egypt.
Key ratios
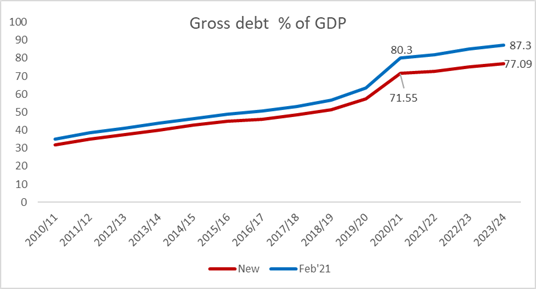
The increase in nominal GDP has improved key ratios such as the main budget deficit, gross debt, and the current account. However, the trends and patterns remain largely unaffected.
Figure 1: Fixed investment as % of GDP is lower
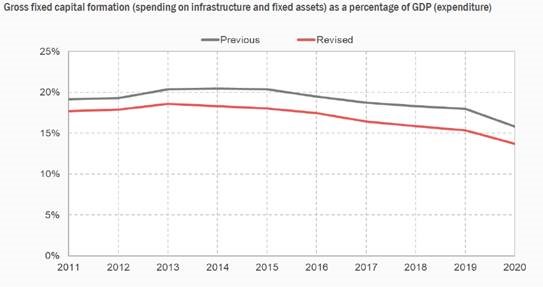
Figure 2: Gross debt-to-GDP (% of GDP) looks better: FY20/21 at ~71.6% (previously 80.3%) and in F23/24F at 77.1% (from 87.3%) (Note that the Nov '21 trajectory could be slightly lower)
What we are watching:
StatsSA publish Q2 21 GDP on 7 September 2021