Key focus points – A hawkish 75bps rate hike as Dot plot forecast is raised
• FOMC hiked the Fed funds target rate for a third successive time by 75bps to a range of 3.0% to 3.25%, the highest level since January 2008.
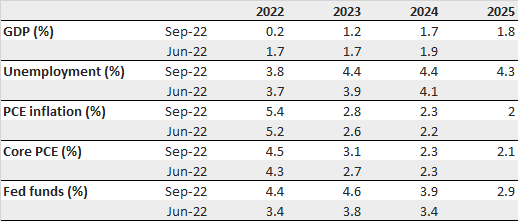
• Inflation/growth forecast: The faster pace of rate hikes has been accompanied by shifts to the Fed's SEP projections. Core PCE inflation was revised higher to 4.5% (P: 4.3%) and 3.1% (P: 2.7%) in 2022 and 2023 before receding to 2.3% in 2024. A "healing" in the supply side of the economy has not resulted in a corresponding easing in inflation. Core CPI inflation has remained sticky on a 3, 6, and 12-month annualised trailing basis of 4.8%, 4.5% and 4.5%, respectively. A more restrictive monetary policy is needed to reduce growth below the trend of 1.8%. The credibility of the Fed's forecast has improved with a continuation of frontloaded rate hikes leading to an increase in the unemployment rate to 4.4% from 3.9% in 2023 (currently 3.7%). The GDP growth forecast was below trend of 1.8% at 0.2% (P: 1.7%), 1.2% (P:1.7%) and 1.7% (1.9%) in 2022, 2023 and 2024.
• Chair Powell cited three reasons for a relatively more resilient labour market compared to previous business cycles:
o Labour supply remains less than vacancies (vacancy rate is 1.8 times), with a softer labour market leading to more balance between demand and supply without a meaningful increase in unemployment.
o Anchored inflation expectations are important, as this could make it easier to restore price stability.
o The Russian/Ukraine war amplified the acceleration in inflation. Some consequences, such as increased commodity prices and supply chain disruptions, have started to ease.
Figure 1 – SEP forecasts: September 2022 vs. June 2022
• Pace and number of rate hikes: The rate hike of 75bps was backed up by a significant upward revision of the Dot plot forecast out to 2024, with 2025 added to the medium term forecast. The median terminal rate forecast has been raised to 4.625% from 3.375% (150bps from the current 3.125%) by the end of 2023. A rate cutting cycle could commence in 2024, totaling 75bps but with a higher year-end rate of 3.875% than the July forecast of 3.375% in 2024 and 2.875% in 2025.
o End-2022: Nine of the 19 FOMC members projected a 2022-year end Fed funds rate of 4.37% (upper bound of 4.50%), 125bps higher than the current Fed funds rate. With two FOMC meetings scheduled for the remainder of 2022, the aggressive rate hiking cycle could continue, with 75bps rate hikes at each meeting. However, with eight members forecasting a year-end rate of 4.125%, total rate hikes of 100bps could consist of a combination of two 50bps or 75bps and 25bps.
o End 2023: The median forecast by the end of 2023 was raised from 3.75% to 4.625%. While this shows a moderation in the pace of rate hikes of 25/50bps, with most heavy lifting down by the end of 2022, rates could stay higher for longer in the restrictive territory. Stickier inflation and a more resilient economy require higher rates to grow the economy below trend, estimated at 1.8%, to decrease inflation. Moreover, the Fed intends not to cut rates prematurity as unemployment rises to 4.4%. This creates concern for a hard landing, leading to a more inverted yield curve. In 1980, the Fed cut rates too early, only to be reversed a few months later at an ever more aggressive pace and magnitude (see Figure 2).
• The focus of the FOMC is shifting monetary policy into restrictive territory until there is "compelling evidence" that inflation is on the way to 2%: The tone of the Q&A session with Chair Powell was hawkish, with his statement that the policy rate will get to the appropriate level to rein in inflation. While interest rate sensitive sectors in the economy, such as housing, and the USD, are responding to higher interest rates, the jobs market remains resilient. Incoming indicators to monitor are the underlying trend in labour market data, such as the quits, vacancy rates, and monthly inflation readings.
• MPC implications: The hawkish stance from the FOMC implies that the USD is likely to remain on the front foot, with further downward revisions to growth forecasts. Currencies such as the ZAR could remain under pressure, with a 75bps rate hike in response to the Fed's hike expected from the MPC at Thursday's meeting. With the Fed emphasising the need for a more restrictive monetary policy, the MPC's view on the stance of monetary policy after tomorrow's rate hike will be interesting. Firstly, the view from several MPC members has been that stance of monetary policy remains accommodative with the repo rate at 5.5%, as consumers have not been resisting higher prices. The rise in unit labour costs has countered the effect of higher interest rates on disposable income. The SARB's QPM model forecasts a neutral rate, averaging 6.75% (3m JIBAR rate of 7.0%) in 2024 to return inflation to the mid-point of the target band of 4.5%. With the aggressive frontloaded rate hike path, the MPC has raised the repo rate by 200bps since November 2021, suggesting the rate could be reached by November 2022. The MPC's guidance on how fast they would like to see a positive policy rate will be important in gauging if the terminal rate could be higher. The FRA curve is pricing at a terminal rate of 8.25%.
Figure 2 Hawkish DOT plot median forecast: Meaningful increase in end-2022/23 Fed funds rate
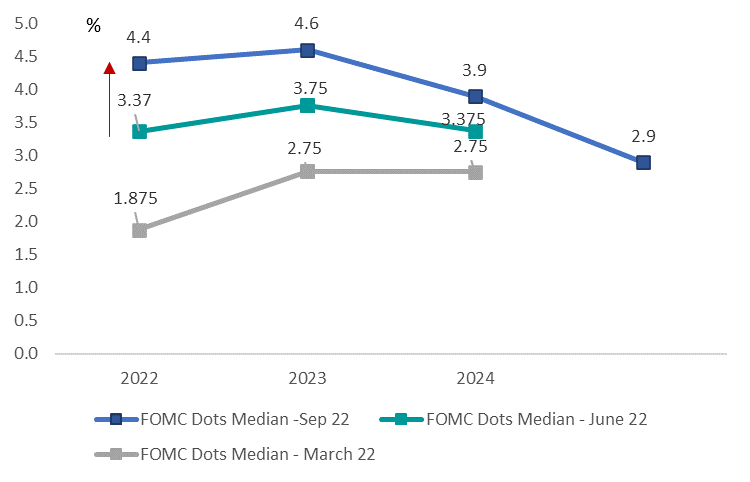
Figure 3 CPI inflation and Fed funds target rate: Dot plot forecast shows reluctance of premature rates on higher unemployment and weaker economic growth as in 1980
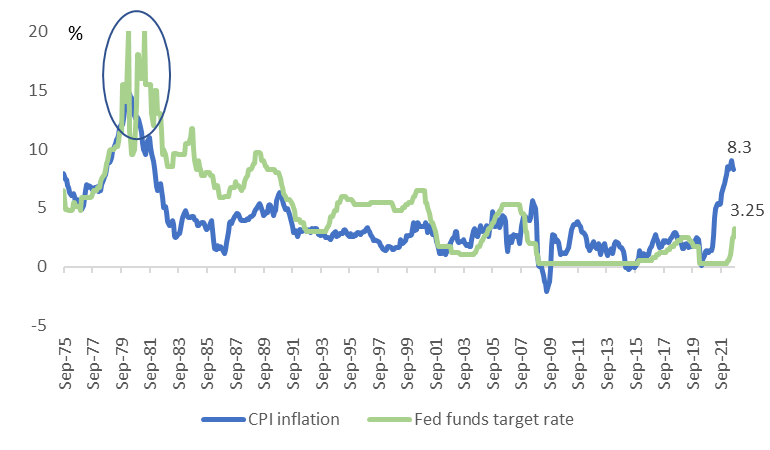
Figure 4 Implied Fed funds rates rise in 2H 23 on more hawkish Dot plot forecast
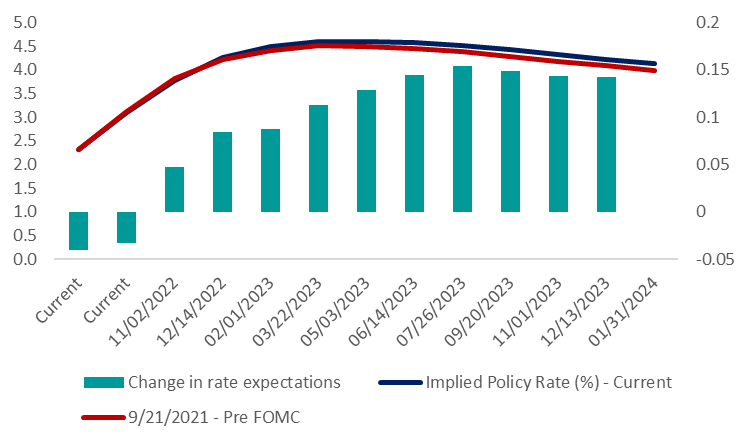
Figure 5 Implied Fed funds pricing after FOMC for 4.50% terminal rate by May 2023:
2 Nov’22 (+69bps); 14 Dec’22 (+49bps); Jan’23 (+23bps), March (+10bps)
H2 23 inversion: Dec’23 rate of 4.22% (-25bps rate cut)
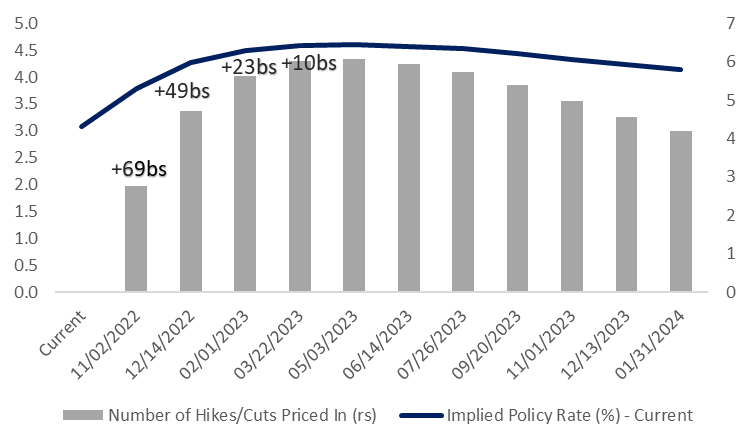
Figure 6 Bloomberg consensus 2023 GDP forecast revised lower as yields rise
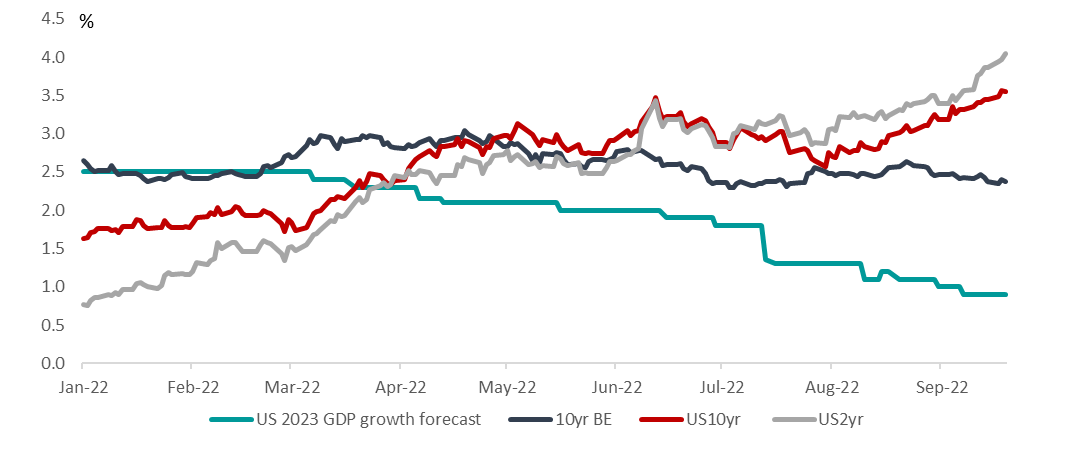
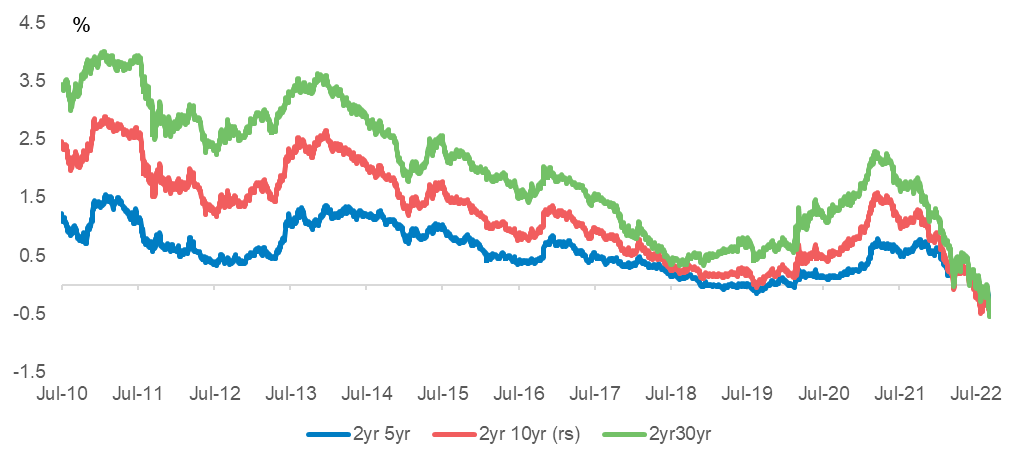
Figure 7 US Treasury yields return to levels pre-GFC
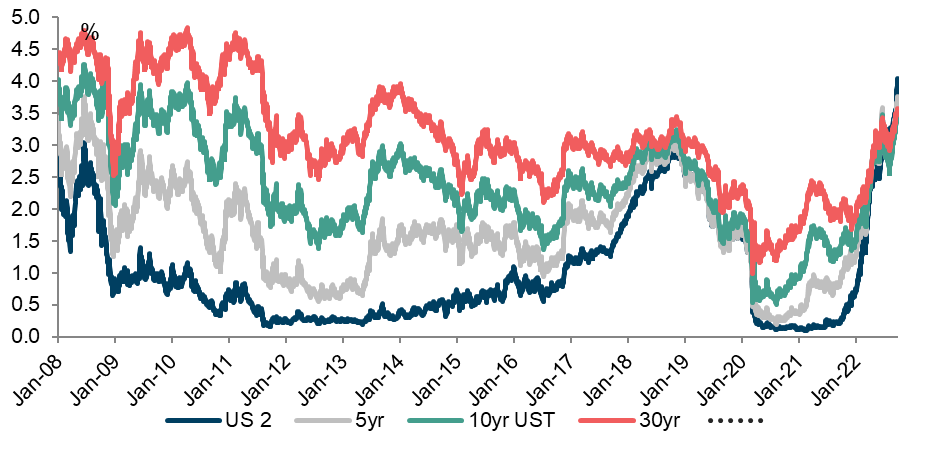
Figure 8 Yield curve inverts further as recession risk rises
