


How are governments and their central banks responding to the damage caused by the lockdowns forced upon their economies and their citizens? Are they doing all they can to minimise the damage to incomes sacrificed during the lock downs?
There is certainly no reluctance to spend. The issue is not about how much but rather how best to spend. Restraints on fiscal deficits and money creation have been abandoned – rightly so in the circumstances.
When so much central bank lending is to the government, even via the secondary market that replaces other lenders, the distinction between monetary and fiscal policy falls away. The UK government made this clear when it exercised its right to a large overdraft on the Bank of England. The Bank could not and would not say no to such a demand for funding, given the state of the economy. The US Fed has added over US$2 trillion of cash to the US banking system over the week to 10 April. It increased its balance sheet by 50% over a very busy week. The federal government has budgeted for trillions of dollars of extra spending, including spending to cover possible losses on the Fed’s loan book.
Issuing money is usually the cheapest way for any government and its taxpayers to fund such emergency spending. When interest rates on long-term government debt are close to zero or even negative in parts of the developed world, issuing debt is almost as cheap as issuing money. Though the question should be asked: where would interest rates settle without the huge loans provided to governments and banks by their central banks?
This is not the case in SA and many other emerging economies. Issuing long-term debt at around 10% is an expensive exercise. Issuing three-month Treasury Bills at 5% is also expensive. For central banks to create money for their governments and taxpayers, would be a cheaper option. Is there not the same good reason for them to support government credit in the same exceptional circumstances as vigorously as is being done in the developed world to universal investor approval?
There is every reason for the SA government to rely heavily on its central bank at a time like this, with the same proviso as applies in the developed world. When the economy is again running at close to its potential, the stimulus should be withdrawn to avoid inflation. That test however will come later. There is an immediate challenge to be met now, and spending and lending without usual restraint is rising to the challenge.
How much economic output and income will be sacrificed over the period of the lockdown and the gradual recovery after that? A broad-brush comparison between what might have been without the coronavirus and what may yet happen to the SA economy can be made. The loss in output as a result of the shutdowns – the difference in what might have been produced and earned had GDP performed as normal in 2020 and 2021, and what now is likely to be produced, can be estimated, as we do below.
What might have been
We first estimate economic output and incomes (GDP at current prices measured quarterly), had the economy continued on its recent path, unaffected by the pandemic. To do this, we use the standard time series forecasting method. We extrapolate what might have transpired had GDP in money of the day continued to grow at its very pedestrian recent pace of about 4%-5% per annum. GDP inflation in recent years has been of the order of 4% per annum, indicating very little real growth was being realised. We then make a judgment about how much of this potential output will be lost due to the shutdowns. We estimate a GDP loss ratio for the quarters between Q1 2020 and Q4 2021 to calculate this difference between pre and post pandemic GDP.
The cumulative difference – the lost output and incomes over the next two years – we estimate as R1,071 trillion of lost output that will be sacrificed to contain the spread of the virus. This is equivalent to approximately 24% of what might have been the GDP in 2020
GDP and GDP after Covid-19 (quarterly data using current prices)
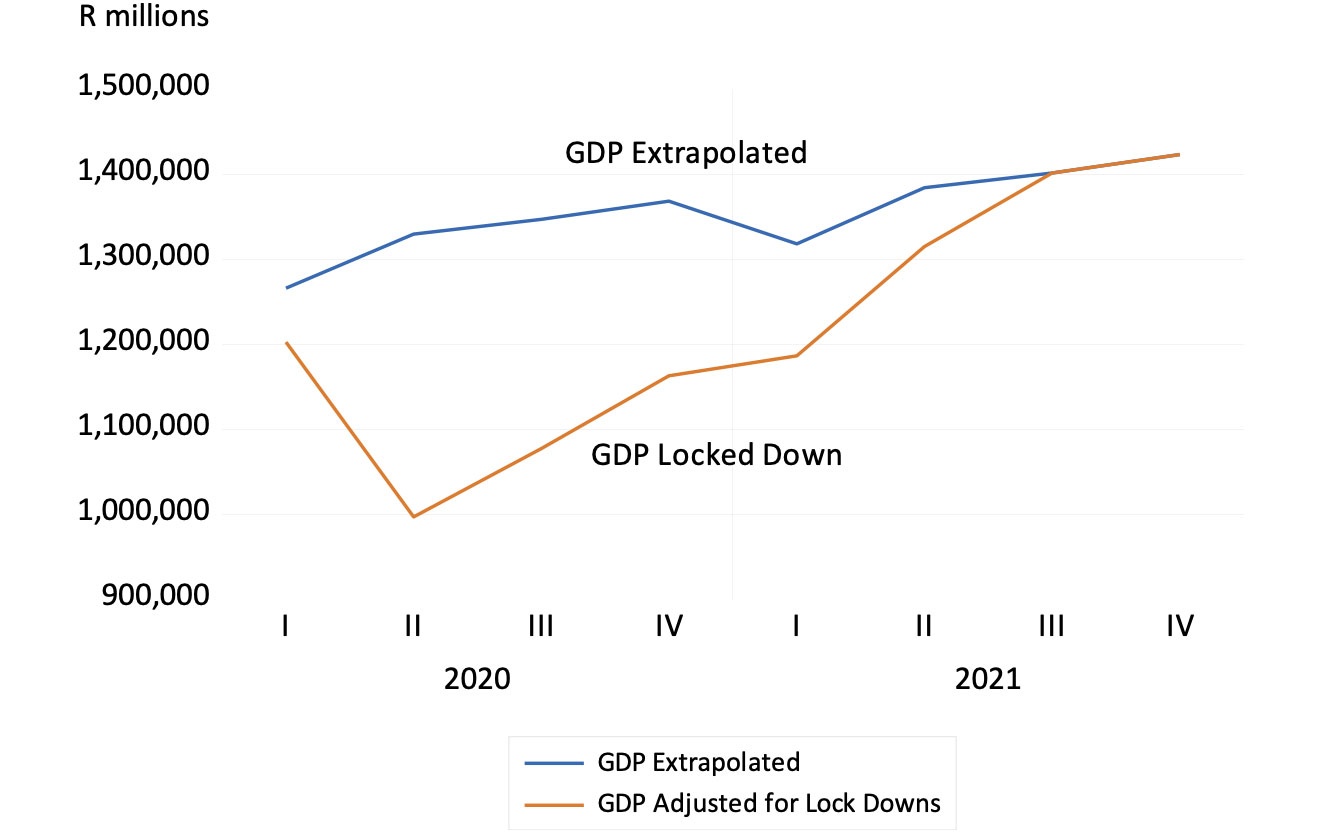
Source: SA Reserve Bank and Investec Wealth & Investment
The loss ratio – the percentage of the economy that remains after the shutdown – is the crucial judgment to be made. We have assumed that the economy operated at 95% of its pre-pandemic potential in Q1 2020. Then, as the impact of the lockdown intensifies through much of Q2, we estimate the economy will utilise only 75% of capacity in Q2. This, we assume, will be followed by somewhat less damage in Q3 when we assume the economy will operate at 80% of potential capacity as the lockdown is gradually relieved. We expect conditions to continue to improve by the equivalent of 5% each quarter, until the economy gets back to where it might have been without the lockdowns. We assume that to be in the second quarter of 2021.
This almost V-shaped recovery might well be too optimistic an estimate. The losses in 2020 may well be greater and the recovery slower than estimated. But the output gap – the difference between what could have been produced and what will be produced – will be a large one.
Loss of output ratio – GDP-adjusted/GDP estimate (pre-Covid-19)
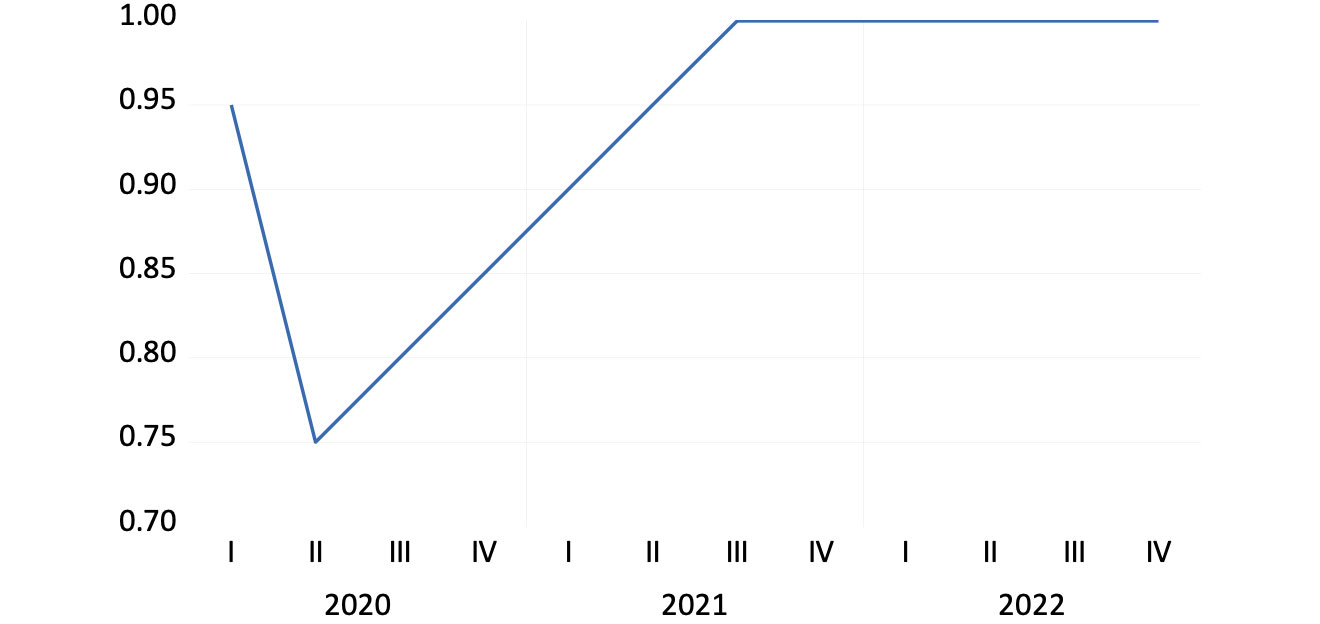
Source: SA Reserve Bank and Investec Wealth & Investment
Estimated loss in GDP per quarter in millions of rands (sum of losses 2020-2021 = R1,071 trillion)
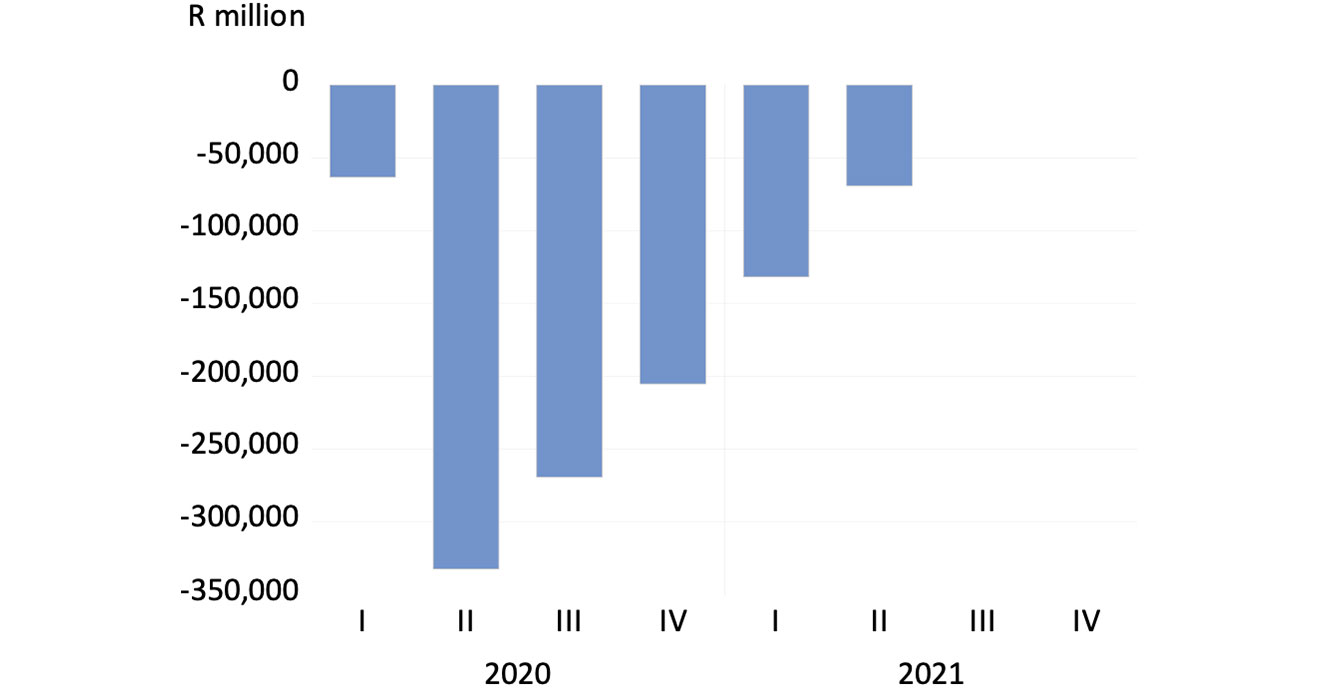
Source: SA Reserve Bank and Investec Wealth & Investment
Don’t hesitate to act boldly
The pace of recovery will depend in part on how much the government spends and how much the Reserve Bank supports the government and private sector with extra cash. The more support provided to the economy by the government and the Reserve Bank, the more demand will be exercised and the smaller will be the eventual loss of output. Any reduction in economic damage of the likely large order estimated is a clear gain to the economy.
Any additional utilisation of what would otherwise be wasted capacity comes without real economic cost. That extra demand can bring forth extra supplies that would be a pure gain to the economy, especially if funded with central bank money.
The Reserve Bank has the opportunity to create more of its own money, without any cost, to help borrowers. This includes not only the banks and the government, but also private businesses directly through its lending. Any inflation that may come along later with a recovery in the economy, can be dealt with in its own good time.
Unlike its peers in the developed world, it also has scope to significantly lower short-term interest rates, all the way to close to zero if needs be. It has rightly taken a step on the way with its emergency meeting recently and the welcome decision to cut rates by a further one percentage point (100bps). We would hope further cuts are on the way. A mixture of aggressive QE and lower interest rates are the right stuff for the SA economy.
Postscript on growth rates: they will not mean what they usually do after the crisis
GDP growth rates are most often presented as the annual percentage growth from quarter to quarter, adjusted for seasonal influences and converted to an annual equivalent. This is the growth rate that attracts headlines.
Two consecutive negative growth rates measured this way are regarded as indicating a ‘technical recession’. The implication is that quarterly growth will continue at that pace for the next year. Under the a lockdown scenario, growth measured this way is likely to become much more variable than it usually is.
This will be especially true in Q2 2020, when the impact of the lockdown will be at its most severe, maybe reducing growth to an annual equivalent negative rate of growth of 50% or so. Estimating growth on this quarter-to-quarter basis over the next few years will however be a poor guide to the underlying growth trends. It may show a very sharp contraction in Q2 2020, followed by positive growth of 40% in Q3 and Q4, 10% in Q4 and then as much as 50% again in Q2 2021. The recession will seemingly have been avoided and the economy will soon be recording boom time growth rates. A likely but highly misleading account of what will be going on with the economy, it must be said.
If GDP is compared to the same quarter a year before, we will get a much smoother series of growth rates. It is likely to show negative growth throughout 2020, (down by as much as -20% in Q2) with strong growth of 30% only resuming in Q2 2021, off a highly depressed base of Q2 2020 when the lockdown was at its most severe.
The better way to calculate the impact of the lockdown in terms of growth rates, would be to calculate the simple percentage change in GDP from quarter to quarter as the impact of the lockdown unfolds and gradually, we hope, dissipates. The worst quarters measured this way will be Q2 and Q3 2020, after which quarter-to-quarter growth in percentage terms will become positive.
Estimated quarterly growth rates between 2020 and 2022 under alternative conventions
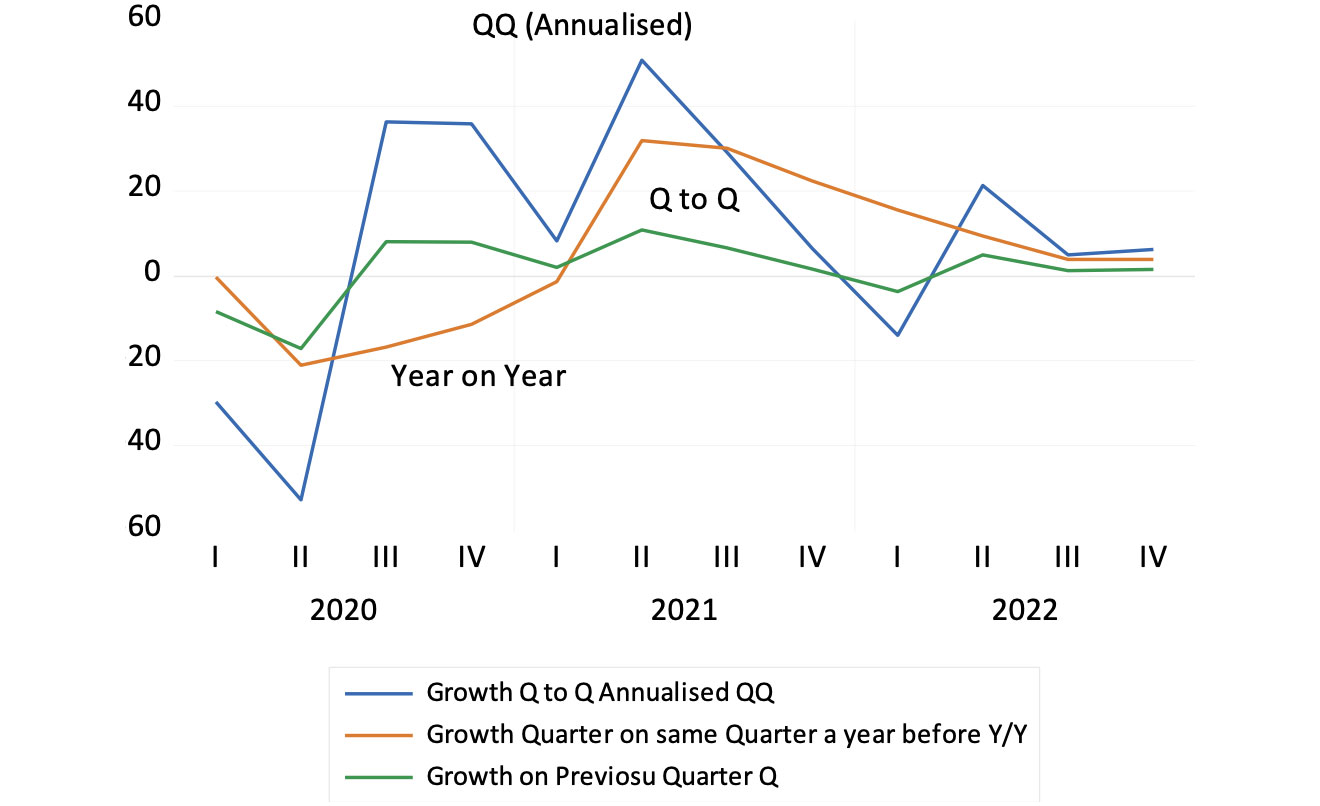
Source: SA Reserve Bank and Investec Wealth & Investment
The upshot of this is that growth rates will not be able to tell us what has happened to an economy subject to a severe supply side shock that is temporary in nature. Measured in absolute terms, in money of the day GDP sacrificed each quarter, as we have attempted to do, will tell the full tale of economic destruction.
About the author

Prof. Brian Kantor
Economist
Brian Kantor is a member of Investec's Global Investment Strategy Group. He was Head of Strategy at Investec Securities SA 2001-2008 and until recently, Head of Investment Strategy at Investec Wealth & Investment South Africa. Brian is Professor Emeritus of Economics at the University of Cape Town. He holds a B.Com and a B.A. (Hons), both from UCT.
Get Focus insights straight to your inbox
Investec products you may be interested in

Wealth Management
We work with some of South Africa’s most successful individuals and families to preserve and grow their wealth. Let us do the same for you.
Portfolio Management
Whether you’re wanting to grow your wealth or generate income, tap into our expertise to help realise your investment goals.

Offshore Investments
Global diversification is a must. Investec’s offshore investments give you access to the world’s leading companies and fund managers.
Wealth Management
We work with some of South Africa’s most successful individuals and families to preserve and grow their wealth. Let us do the same for you.
Portfolio Management
Whether you’re wanting to grow your wealth or generate income, tap into our expertise to help realise your investment goals.
Offshore Investments
Global diversification is a must. Investec’s offshore investments give you access to the world’s leading companies and fund managers.
Browse further in