

The names Alessandra Perilli, Gian Marco Berti and Myles Amine may not be household names, but perhaps they should be. Perilli and Berti (shooting) and Amine (wrestling) won three medals at the recent Summer Olympics in Tokyo, placing their tiny nation of San Marino at the top of the list of medal winners by population size.
With a population of 33,000, San Marino is the smallest country by population to have won a medal at an Olympic Games, beating previous holders of the accolade Bermuda (Summer Olympics) and Lichtenstein (Winter Olympics). At the Tokyo Games, the medal table by population size sees San Marino leading, followed by Bermuda (see table 2).
Such an exercise is great fun (especially if you are from one of the smaller countries on the list), but for most, the official tally still counts. There, population size and economic heft still count the most.
Table 1: Medal ranking Tokyo 2020
| Rank | Country | Gold | Silver | Bronze | Total | Rank by total |
| 1 | United States of America | 39 | 41 | 33 | 113 | 1 |
| 2 | People's Republic of China | 38 | 32 | 18 | 88 | 2 |
| 3 | Japan | 27 | 14 | 17 | 58 | 5 |
| 4 | Great Britain | 22 | 21 | 22 | 65 | 4 |
| 5 | ROC | 20 | 28 | 23 | 71 | 3 |
| 6 | Australia | 17 | 7 | 22 | 46 | 6 |
| 7 | Netherlands | 10 | 12 | 14 | 36 | 9 |
| 8 | France | 10 | 12 | 11 | 33 | 10 |
| 9 | Germany | 10 | 11 | 16 | 37 | 8 |
| 10 | Italy | 10 | 10 | 20 | 40 | 7 |
| 11 | Canada | 7 | 6 | 11 | 24 | 11 |
| 12 | Brazil | 7 | 6 | 8 | 21 | 12 |
| 13 | New Zealand | 7 | 6 | 7 | 20 | 13 |
| 14 | Cuba | 7 | 3 | 5 | 15 | 18 |
| 15 | Hungary | 6 | 7 | 7 | 20 | 13 |
| 16 | Republic of Korea | 6 | 4 | 10 | 20 | 13 |
| 17 | Poland | 4 | 5 | 5 | 14 | 19 |
| 18 | Czech Republic | 4 | 4 | 3 | 11 | 23 |
| 19 | Kenya | 4 | 4 | 2 | 10 | 25 |
| 20 | Norway | 4 | 2 | 2 | 8 | 29 |
| 21 | Jamaica | 4 | 1 | 4 | 9 | 26 |
| 22 | Spain | 3 | 8 | 6 | 17 | 17 |
| 23 | Sweden | 3 | 6 | 0 | 9 | 26 |
| 24 | Switzerland | 3 | 4 | 6 | 13 | 20 |
| 25 | Denmark | 3 | 4 | 4 | 11 | 23 |
Source: International Olympic Committee, 8 August 2021
Notes:
Performances are ranked by seniority of medals, starting with golds won, followed by silver and then bronze.
ROC – Russian Olympic Committee.
Table 2: Medals per capita Tokyo 2020
| Rank | Country | Medals | Population | Population per medal |
| 1 | San Marino | 3 | 33,931 | 11,310 |
| 2 | Bermuda | 1 | 63,918 | 63,981 |
| 3 | Grenada | 1 | 112,523 | 112,523 |
| 4 | Bahamas | 2 | 393,244 | 196,622 |
| 5 | New Zealand | 20 | 4,822,233 | 241,111 |
| 6 | Jamaica | 9 | 2,961,167 | 329,018 |
| 7 | Slovenia | 5 | 2,078,938 | 415,787 |
| 8 | Fiji | 2 | 896,445 | 448,222 |
| 9 | Netherlands | 36 | 17,134,872 | 475,968 |
| 10 | Hungary | 20 | 9,660,351 | 483,017 |
Source: Medalspercapita.com, 8 August 2021
Table 3: Weighted medals by GDP Tokyo 2020
| Rank | Country | Weighted medals(2) | Gold | Silver | Bronze | GDP(1) | GDP per weighted medal(1) |
| 1 | San Marino | 4 | 0 | 1 | 2 | 1.63 | 0.41 |
| 2 | Jamaica | 22 | 4 | 1 | 4 | 14.78 | 0.67 |
| 3 | Georgia | 19 | 2 | 5 | 1 | 15.08 | 0.79 |
| 4 | Fiji | 5 | 1 | 0 | 1 | 5.06 | 1.01 |
| 5 | Grenada | 1 | 0 | 0 | 1 | 1.13 | 1.13 |
| 6 | Kyrgyzstan | 5 | 0 | 2 | 1 | 7.56 | 1.51 |
| 7 | Bahamas | 8 | 2 | 0 | 0 | 12.16 | 1.52 |
| 8 | Bermuda | 4 | 1 | 0 | 0 | 7.48 | 1.87 |
| 9 | Armenia | 6 | 0 | 2 | 2 | 11.54 | 1.92 |
| 10 | Serbia | 19 | 3 | 1 | 5 | 41.43 | 2.18 |
Source: Medalspercapita.com, 8 August 2021
(1) current US$ billions
(2) gold = 4, silver = 2, bronze = 1
According to The Economist magazine (‘Olympic glory tends to go hand-in-hand with economic clout’, The Economist, 8 August 2021), economics trumps most other factors in ensuring success. The publication tested success in the Olympic Games against a host of variables, including healthcare, education and population, and found that global share of GDP was the single biggest determinant of success, accounting for 55% of the variation in medals won since 1960.
“On average, holding other things constant, a two percentage-point share of global GDP (measured at purchasing-power parity) translates to a three percentage-point share of Olympics medals,” the magazine notes.
This makes intuitive sense. Where a country has a large number of people who enjoy relatively high incomes and access to facilities and coaching, it stands to reason that it will do better across a range of sports.
Bang for buck
Sometimes, however, countries are able to defy the economic odds and, at least in medal terms, get bigger bang for their buck, while others underperform. The list of medal winners by population above gives a good example of this. By specialising in one or two sports, preferably ones in which individuals can win more than one medal (team sports like hockey or football are less useful), a country can ensure a decent medal haul.
Good examples of this are Jamaica (21st in Tokyo), with its long tradition of excellence in sprint events in athletics (or track and field, as the Americans like to call it) and Kenya (19th in Tokyo), with its dominance in middle and long distance events.
Another one to note is Kyrgyzstan (population 6.5 million), with three medals in Tokyo, all in wrestling. Indeed, the former republics of the Soviet Union usually do well, thanks to the infrastructure and traditions established under the Soviet regime, concentrating on individual sports like weightlifting, wrestling and gymnastics.
Historically, the Soviet Union used to slug it out with the US at the top of the medals table, despite its economy being much smaller. This was the result of state resources being channelled into Olympic sports, a type of arms race acted out on the track, pool and gymnastics arena. The historical investment in sports still carries through today, with Russia (despite recent controversies over doping) and the other former republics still performing well across a range of sports.
What does it cost to achieve success? The Economist has also run an exercise of the cost per medal, to calculate this bang for buck. Looking at the countries that have won at least 10 medals since 1992, it calculates that each medal costs an average of US$120m in GDP, at 2011 prices. On this basis, the US is not very efficient: it cost S$200m in output to achieve each gold medal. Jamaica was the most efficient, with a cost of only US$3m in GDP per gold.
Perhaps the country that gets the worst bang for its buck is India, with a GDP cost of US$3.5bn per gold medal. India, with a 7% share of global output, has been a perennial underperformer at the Olympics, but it has been showing steady improvement. Its seven medals put it 48th in the official count but 33rd in number of medals won, its best performance yet, up from 51st in 2008. India is clearly one to watch in the future.

Jamaica usually does well in the sprint events, even against the likes of athletics powerhouses, the US and Great Britain.
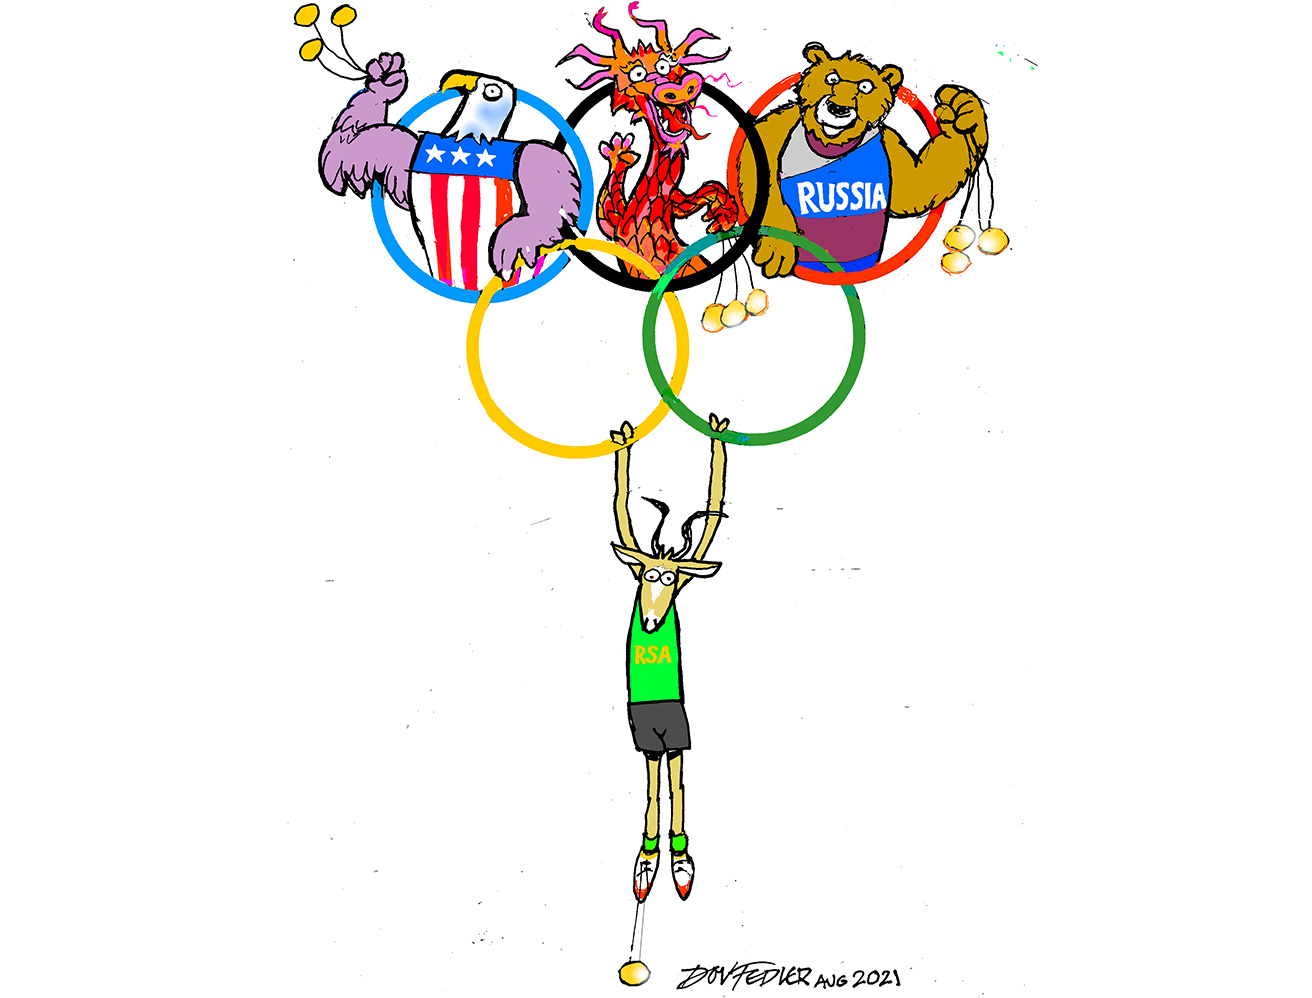
South Africa’s performance
Much has been made of South Africa’s haul of three gold medals (a gold and silver in swimming by Tatjana Schoenmaker and a silver by Bianca Buitendag in surfing), the country’s worst performance since Beijing 2008 and a big fall from the 10 medals in 2016. The failure to secure a single medal in athletics, where South Africa has traditionally done reasonably well, was particularly noteworthy.
Yet by the measures above, South Africa’s performance was not out of line. On a medals per capita basis, South Africa was 81st, compared with China, which was just three places above, at 78th. Weighted by GDP, South Africa was 78th, ahead of Germany (79th), China (80th) and the US (83rd).
The bad and the good
The Olympics feature many of the worst and the best aspects of society. Regarding the former, we can mention the misallocation of resources, doping and mistreating of young athletes over the years, simply to achieve a few more medals at a tournament that only comes around every four years. This was particularly true during the Cold War, when the Olympic Games were a kind of proxy war between West and East.
Countries such as the UK and Australia, both wealthy OECD nations, have benefited in recent decades from the extra allocation of resources to Olympic sports and regularly feature high up the medals tables. Many South Africans have pointed to these countries as models for South Africa to follow. It is hard, however, to justify further allocations to sport when the country has so many other pressing needs to deal with, such as poverty, unemployment, access to healthcare and education. At the same time, resolving these issues would lead to better sporting outcomes. Economic hardship is no help to a young athlete’s career.
Yet the Olympic Games also bring out the best in us. Participants in most of the events at the Games earn a pittance when compared with the big money sports such as football, tennis, golf and basketball. For many, their sport is a part-time activity that they have to fit into a busy schedule. Yet for two weeks every four years (and at the Paralympics that follow) it’s the exponents of these sports that get the attention, many with inspiring stories of overcoming adversity. In this, the Olympic Games have a lasting value.
About the author

Patrick Lawlor
Editor
Patrick writes and edits content for Investec Wealth & Investment, and Corporate and Institutional Banking, including editing the Daily View, Monthly View, and One Magazine - an online publication for Investec's Wealth clients. Patrick was a financial journalist for many years for publications such as Financial Mail, Finweek, and Business Report. He holds a BA and a PDM (Bus.Admin.) both from Wits University.
Receive Focus insights straight to your inbox
Investec products you may be interested in

Offshore investments

Global Investment Strategy Group

Portfolio Management
Offshore investments
Global Investment Strategy Group
Portfolio Management
Browse further in