
South Africans travelling abroad should not blame the rand for their lack of purchasing power, at least not lately. In mid-January 2016, a US dollar exchanged for R16.80, a British pound then cost R24. Observers of the gyrations of the foreign exchange value of the rand should know that its exchange rate has had very little to do with the differences in inflation between SA and its trading partners. The rand has consistently bought less abroad than it has at home.
The exchange value of the rand with the US dollar or sterling has been weaker than its purchasing power parity (PPP) equivalent rate of exchange ever since 1995, when SA’s capital market was opened up, though with varying degrees of weakness. Had the rand simply followed the ratio of the SA consumer price index (CPI) to the US CPI since 1995 a dollar would now cost a mere R8. Similarly, since 1995 the difference between SA and UK inflation has been an average of 3.3% a year while the pound on average has cost an average 8.2% extra a year in rands since 1995.
Rand exchange rates against the US dollar (1995-2022)
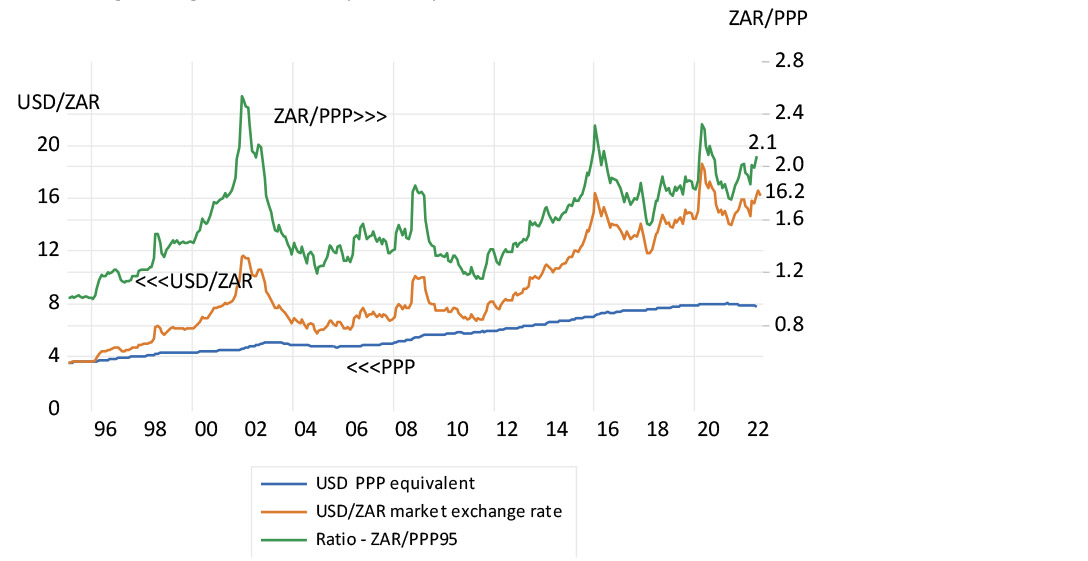
Source: Federal Reserve Bank of St Louis, Bloomberg and Investec Wealth & Investment, 17/08/2022
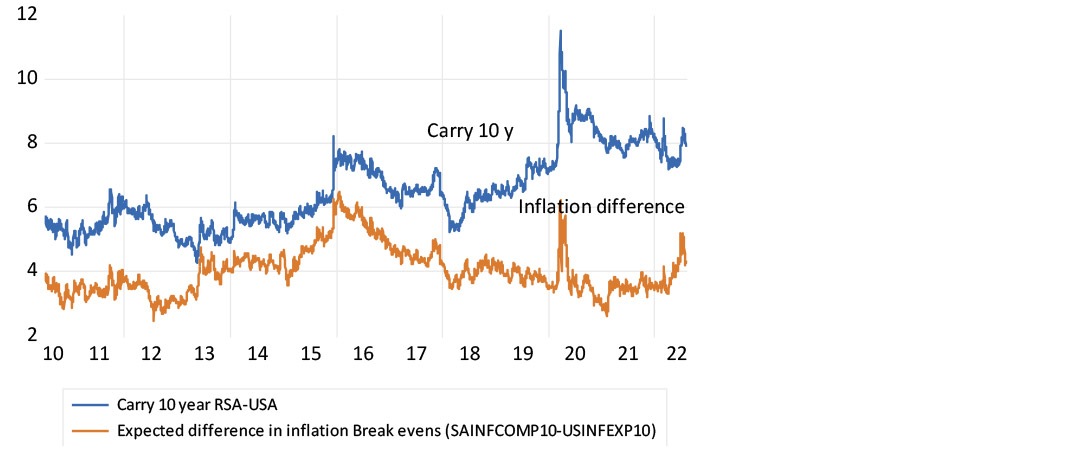
Yet not only has the rand depreciated by more than the differences in inflation over the past 27 years, it is also expected to carry on weakening by more than the expected differences in inflation. The rand is expected to lose its dollar value by an average rate of 7.6% a year over the next 10 years and at an average 6% rate a year over the next five years. This is known as the interest carry: the current differences between the market established rand yields on an RSA bond and the dollar yields on the US Treasury bonds of the same duration. While helpful to exporters and import replacers competing in the home and foreign markets (and to incoming tourists) this expectation of further consistent rand weakness has a damaging downside. It raises the cost of funding rand-denominated debt, increasing the required return on securities. Expected rand weakness sharply reduces the expected return from the RSA (government) 10-year bond to under 3% a year (10.4% nominal yield less 7.6%). This is less than the same return in US dollars offered by a US Treasury.
The expected rate of inflation can be accurately estimated or implied in the same bond markets. It can be measured as the difference between a vanilla government bond and an inflation-protected alternative of the same duration. The compensation to investors in the US accepting inflation risk is an extra 2.65% a year for a five-year bond and 5.91% a year extra for rand investors in RSA bonds. This difference in expected inflation of 3.2% a year is significantly less than the 6% rate at which the rand is expected to weaken against the dollar over the same five years. PPP does not only not hold, but it is not expected to hold in the future. Sadly therefore, even reducing expectations of inflation may not much improve the outlook for the rand – a major issue if the cost of raising foreign or domestic capital is to be reduced.
Inflation compensation in SA and US 10-year bond markets and differences in expected inflation
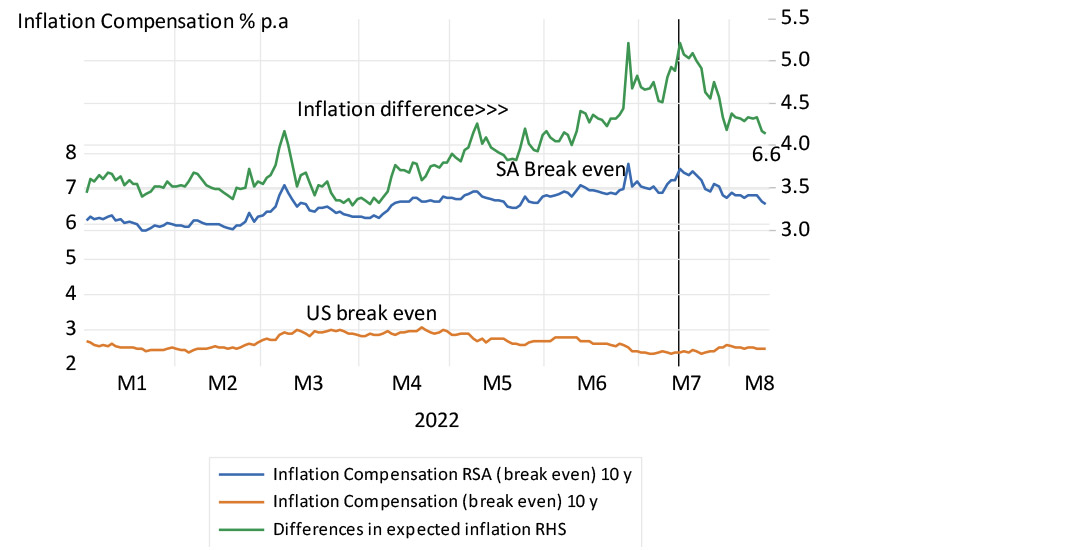
Source: Bloomberg and Investec Wealth and Investment, 17/08/2022
The interest carry (difference in nominal yields) and the difference in inflation expected (2010-2022)
Source: Bloomberg and Investec Wealth and Investment, 17/08/2022
The full explanation for the exchange value of the rand is thus not to be found in the PPP rate but much more in the varying flows of capital into or out of emerging markets generally and to or away from the dollar. SA-specific risks move the ratio of the rand to other emerging market currencies about this long-term one-to-one ratio. Both the rand and the other emerging market currencies respond similarly to the same degrees of global risk tolerances that drives the US dollar stronger or weaker.
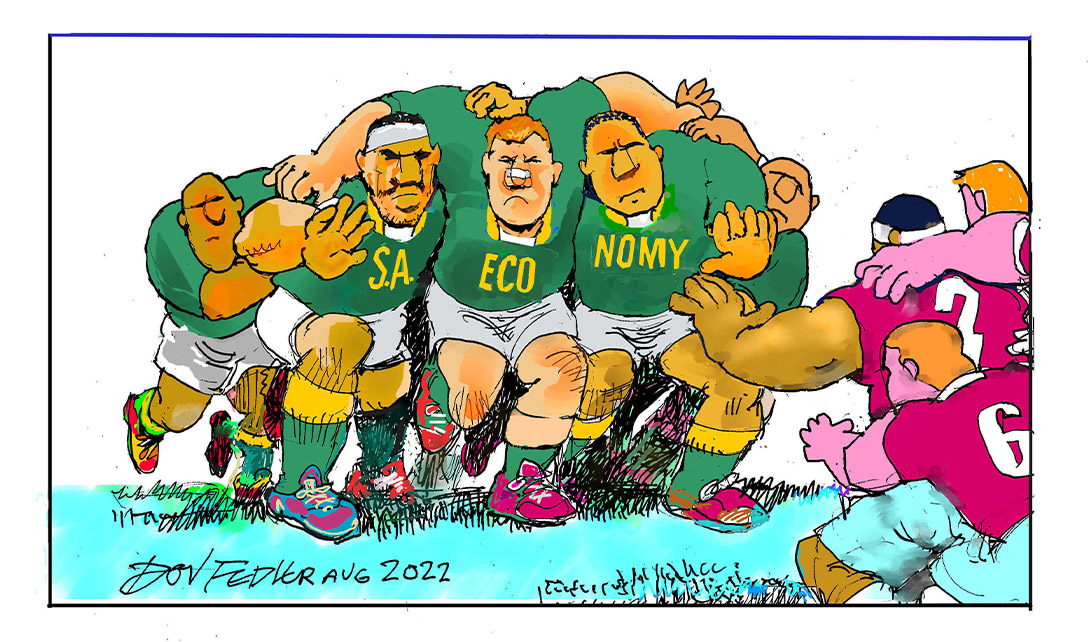
The task for SA lies in promoting capex (and so economic growth) by improving the outlook for the rand. It could do so by adopting policies that would make SA a superior emerging market attracting a much lower risk premium. SA’s recent impressive successes in the competitive businesses of international rugby and cricket, provide the case study to be emulated widely.
The exchange value of the rand vs other emerging market currencies (1996-2022)
(Higher numbers indicate rand weakness)
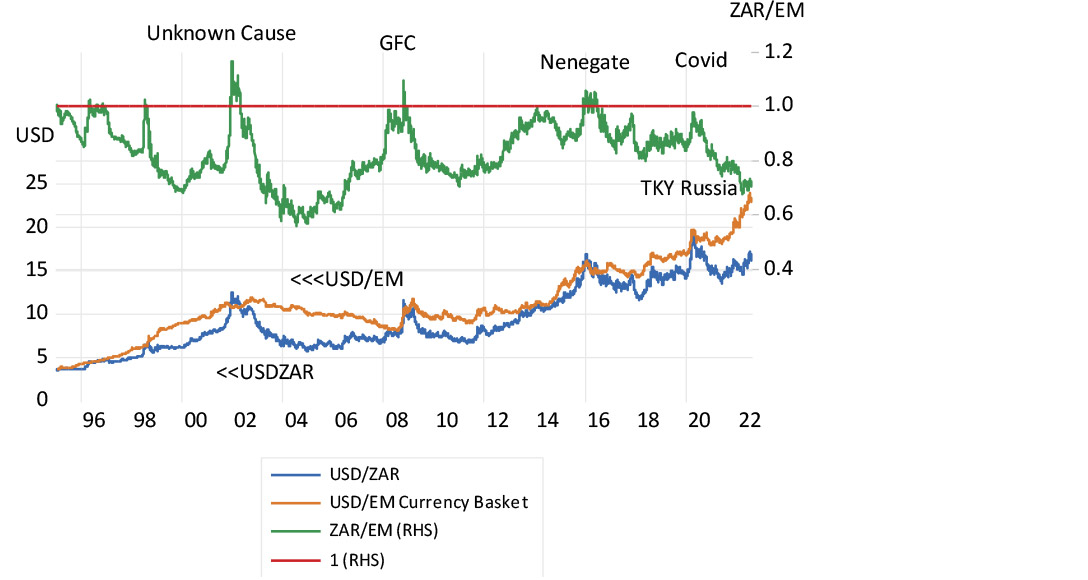
Source: Bloomberg, Investec Wealth & Investment, 17/08/2022
About the author

Prof. Brian Kantor
Economist
Brian Kantor is a member of Investec's Global Investment Strategy Group. He was Head of Strategy at Investec Securities SA 2001-2008 and until recently, Head of Investment Strategy at Investec Wealth & Investment South Africa. Brian is Professor Emeritus of Economics at the University of Cape Town. He holds a B.Com and a B.A. (Hons), both from UCT.
Get Focus insights straight to your inbox
Disclaimer
Although information has been obtained from sources believed to be reliable, Investec Wealth & Investment International (Pty) Ltd or its affiliates and/or subsidiaries (collectively “W&I”) does not warrant its completeness or accuracy. Opinions and estimates represent W&I’s view at the time of going to print and are subject to change without notice. Investments in general and, derivatives, in particular, involve numerous risks, including, among others, market risk, counterparty default risk and liquidity risk. The information contained herein is for information purposes only and readers should not rely on such information as advice in relation to a specific issue without taking financial, banking, investment or other professional advice. W&I and/or its employees may hold a position in any securities or financial instruments mentioned herein. The information contained in this document does not constitute an offer or solicitation of investment, financial or banking services by W&I . W&I accepts no liability for any loss or damage of whatsoever nature including, but not limited to, loss of profits, goodwill or any type of financial or other pecuniary or direct or special indirect or consequential loss howsoever arising whether in negligence or for breach of contract or other duty as a result of use of the or reliance on the information contained in this document, whether authorised or not. W&I does not make representation that the information provided is appropriate for use in all jurisdictions or by all investors or other potential clients who are therefore responsible for compliance with their applicable local laws and regulations. This document may not be reproduced in whole or in part or copies circulated without the prior written consent of W&I.
Investec Wealth & Investment International (Pty) Ltd, registration number 1972/008905/07. A member of the JSE Equity, Equity Derivatives, Currency Derivatives, Bond Derivatives and Interest Rate Derivatives Markets. An authorised financial services provider, license number 15886. A registered credit provider, registration number NCRCP262.
Investec products you may be interested in

Wealth Management
We work with some of South Africa’s most successful individuals and
families to preserve and grow their wealth. Let us do the same for you.
Portfolio Management
Whether you’re wanting to grow your wealth or generate income, tap into our expertise to help realise your investment goals.

Offshore Investments
Global diversification is a must. Investec’s offshore investments give
you access to the world’s leading companies and fund managers.
Wealth Management
We work with some of South Africa’s most successful individuals and
families to preserve and grow their wealth. Let us do the same for you.
Portfolio Management
Whether you’re wanting to grow your wealth or generate income, tap into our expertise to help realise your investment goals.
Offshore Investments
Global diversification is a must. Investec’s offshore investments give
you access to the world’s leading companies and fund managers.
Browse further in