

Inflation in the US will average 4.4% in 2022, according to the consensus view. With monthly increases in consumer prices still well above those of a year ago, inflation may well again surprise on the upside.
Inflation in the US – monthly (LHS) and annual (RHS) movement
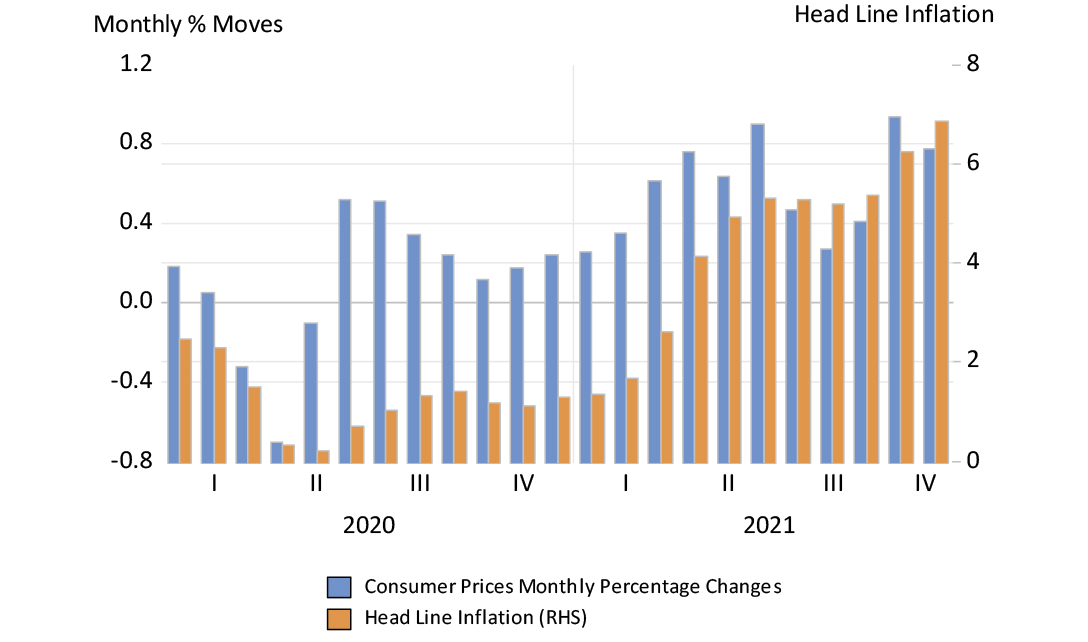
Source: Federal Reserve Bank of St Louis, Investec Wealth & Investment, 12/01/2022
Prices, as always, depend on demand and supply. The aggregate demand for goods and services in the US will continue to be stimulated by the vast amounts of extra money that is now waiting on the sidelines. At the same time, suppliers may continue to struggle to satisfy their customers, especially if workers continue to be forced to isolate, adding a further temporary, supply side push to prices.
The increase in the supply of deposits held with US banks by households and firms, in response to the Covid-19 lockdowns, has been of a previously unimaginable magnitude. One blinks more than once when confronted with the enormous scale of the flow of cheques from the Treasury to US households and firms since March 2020. In April 2020, the supply of short-term bank deposits held in banks by households and businesses increased by as much as US$11 trillion. Short-term bank deposits have increased further since, and were worth over US$20 trillion by November 2021, compared with a mere US$4 trillion supplied in early 2020.
The Federal Reserve (Fed) has played its part in this process of extraordinary money creation by supplying extra cash reserves to private banks when buying bonds and making loans to the banks. The cash reserves of the banks, sometimes described as high-powered money – because they facilitate the supply of extra deposits – have more than doubled since early 2020, and are up by US$2.54 trillion.
Growth in US M2, M1 and cash reserves
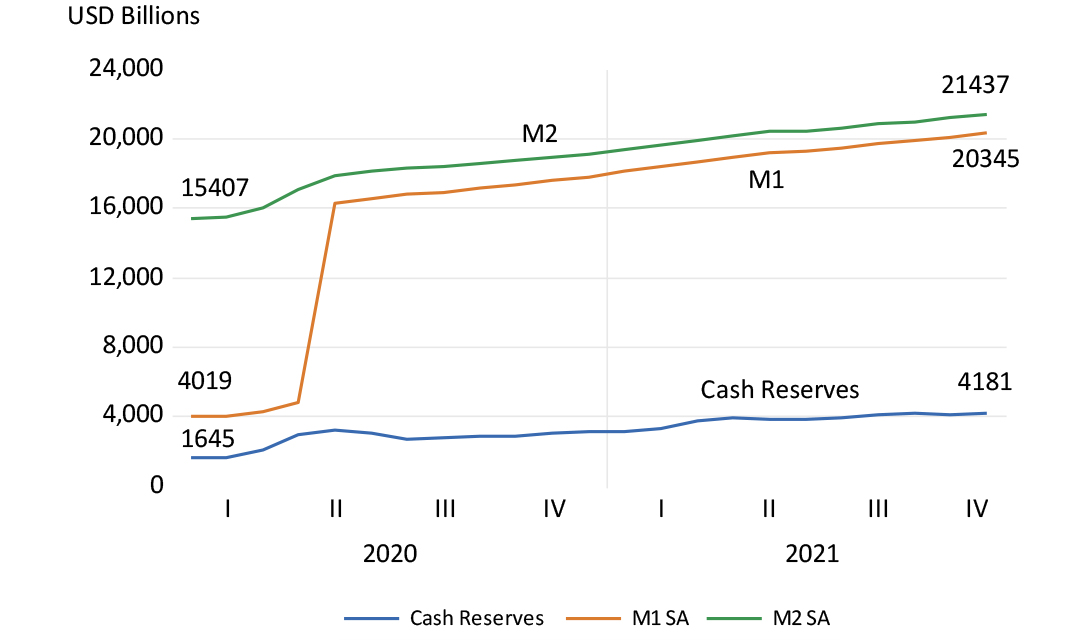
Source: Federal Reserve Bank of St Louis, Investec Wealth & Investment, 12/01/2022
The banks have ample scope to undertake more lending, reducing their abundant excess cash reserves, in excess of the requirement to hold minimum cash as a reserve. Indeed, unlike their behaviour after the Global Financial Crisis (GFC) when they first built up their cash reserve ratios, they have increased their supplies of credit to their customers by over US$2 trillion (17%) since January 2020. The deposit multiplier, the ratio of M1 or M2 (deposits) to the cash reserves held by banks, though much diminished since the GFC, is rising again. This time there has been no financial crisis to frighten the vulnerable banks into holding much more cash in reserve. Aggregate bank deposits, once supplied and in the system, are never likely to decline or be paid back in cash.
The ratio of broadly defined money (M2) to incomes (GDP) increased after the GFC and has increased by a further 30% since early 2019. If the long history of inflation is anything to go by, it will take higher prices and a higher GDP (measured in current prices) to bring this relationship between money and money income closer in line. Excess supplies of money – more than are willingly held, given incomes, prices, wealth and the outlook for inflation – are exchanged for other assets, such as equities and bonds, and for goods and services. The switch out of money inevitably causes the prices of goods, services and of assets (including homes) to rise and yields to fall. At the same time, the wealth effect of more valuable portfolios further encourages spending. The evidence of the recent monetary and fiscal causes and effects on equity and bond valuations has never been more obvious. House prices and rents have also risen sharply. This is not surprising given that is the extremes of the policy responses to the recent lockdowns have arguably worked too well to revive the US economy.
The ratio of money (M2) to GDP (2019=100)
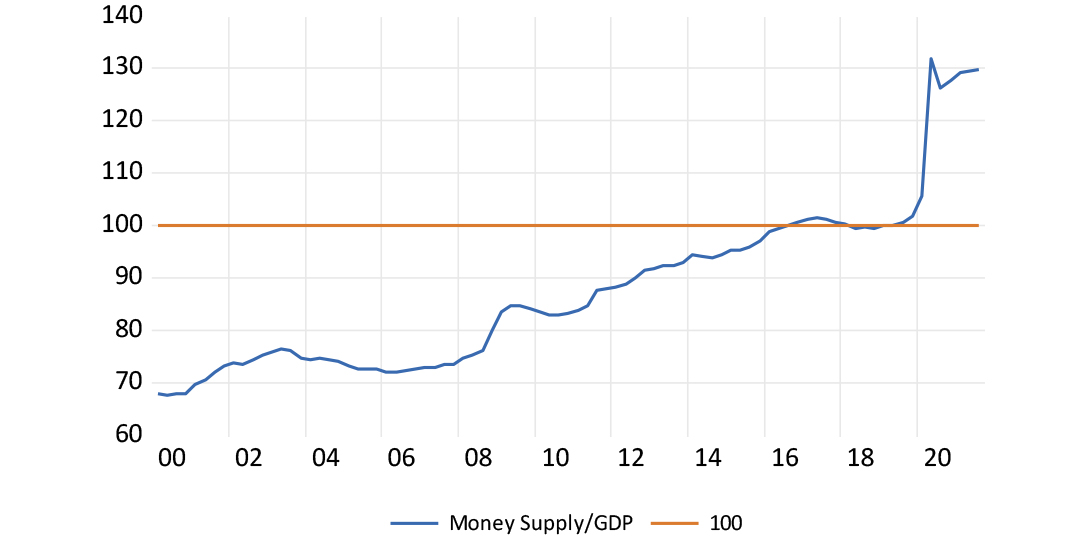
Source: Federal Reserve Bank of St Louis, Investec Wealth & Investment, 12/01/2022
The US debt-to-GDP ratio is now well out of line with long-term norms, at over 120% of GDP. Total Federal debt is a mind-boggling US$28 trillion and still rising.
Fiscal deficit as a percentage of GDP 1960-2020
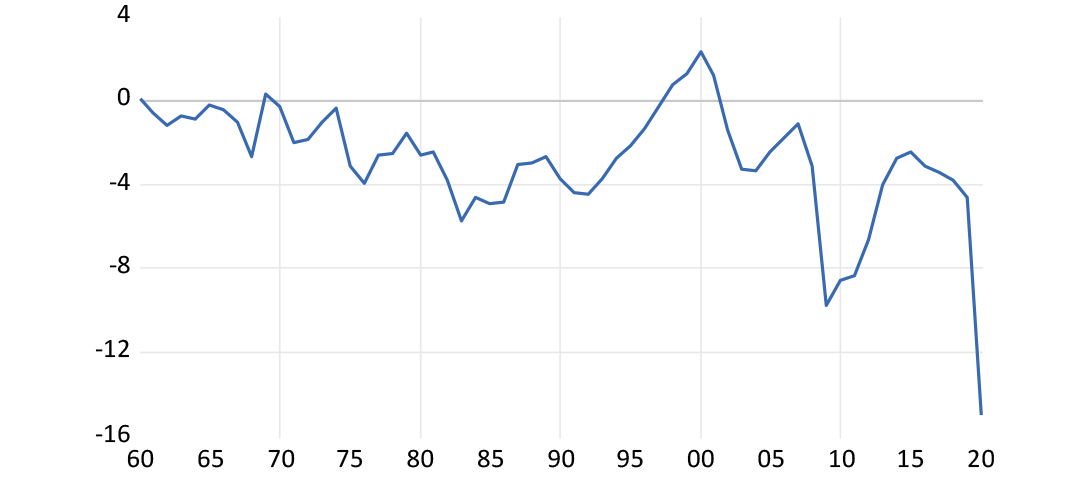
Source: Federal Reserve Bank of St Louis, Investec Wealth & Investment, 12/01/2022
20% of this debt is now held by the Fed – a government agency whose books should be consolidated with those of the Treasury. In effect, the extra debt is being funded in important part very cheaply with the cash reserves of the banks held with the Fed that earn a very low rate of interest. A powerful burst of government spending, mostly in the form of providing direct income support, and funded with additional debt and extra money supplied by a central bank rather than by higher taxes, is a highly inflationary combination. The history of inflation worldwide attests to this.
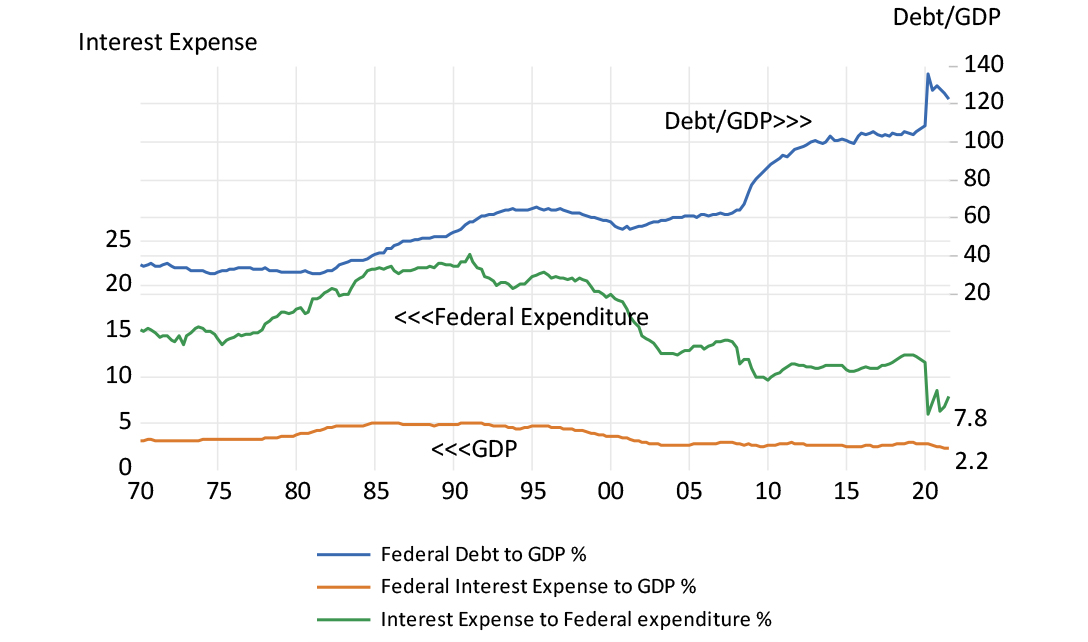
The saving grace for the US is that interest rates and borrowing costs have remained so low, consistent with the current abundance of money. The average annual yield on this debt is now a mere 1.8% (interest paid/debt Issued) and the percentage of the US budget used to pay interest is a mere 7.8% - equivalent to a manageable 2.2% of GDP. Historically these are very low ratios, despite the much-elevated levels of debt.
US Federal debt – key ratios to GDP
Source: Federal Reserve Bank of St Louis, Investec Wealth & Investment, 12/01/2022
Therefore, all is fiscally well in the US for now, provided short and long-term interest rates stay as repressed as they have been. But policy determined short-term interest rates will have to rise if the strength of spending is to be restrained to hold down inflation. One problem with rising interest rates comes in the form of lower present discounted values for the income flows from assets, which are likely to reduce their market valuations (other things equal, including the outlook for earnings and fiscal policy). The other problem is that higher interest rates put pressure on Treasury budgets and on the taxpayer.
The interest expense on the total federal debt is now running at approximately US$500 billion a year, equivalent to 1.8% of issued debt, which is low by the standards of history. This interest expense ratio was over 20% in 1990.
A modest one-percentage point increase in average interest rates paid on the debt will increase the interest paid by the Fed by 50%, to approximately US$750 billion a year. While having to pay an extra two percentage points a year on the current debt would cost Uncle Sam over US$1trillion a year, equivalent to about 15% of all Federal spending. Higher interest rates with large national debts, especially with very short duration, is as much a fiscal as a monetary policy event. And using taxes to pay interest rather than to provide valuable benefits or subsidies to voters, is never a popular option.
But any unwillingness to bite the proverbial fiscal bullet will sooner or later encourage expectations of more inflation. This will have to be compensated for in higher long-term interest rates and borrowing costs, especially as the Fed reduces its support for the long end of the Treasury bond market. Yet long-term inflation expectations, while they have risen recently, remain subdued. They imply that the US should make a gradual return to sustainable fiscal and monetary norms. It will be a politically exacting task – the success of which should not be taken for granted. The markets will be watching action more than words.
US long term interest rates and inflation compensation
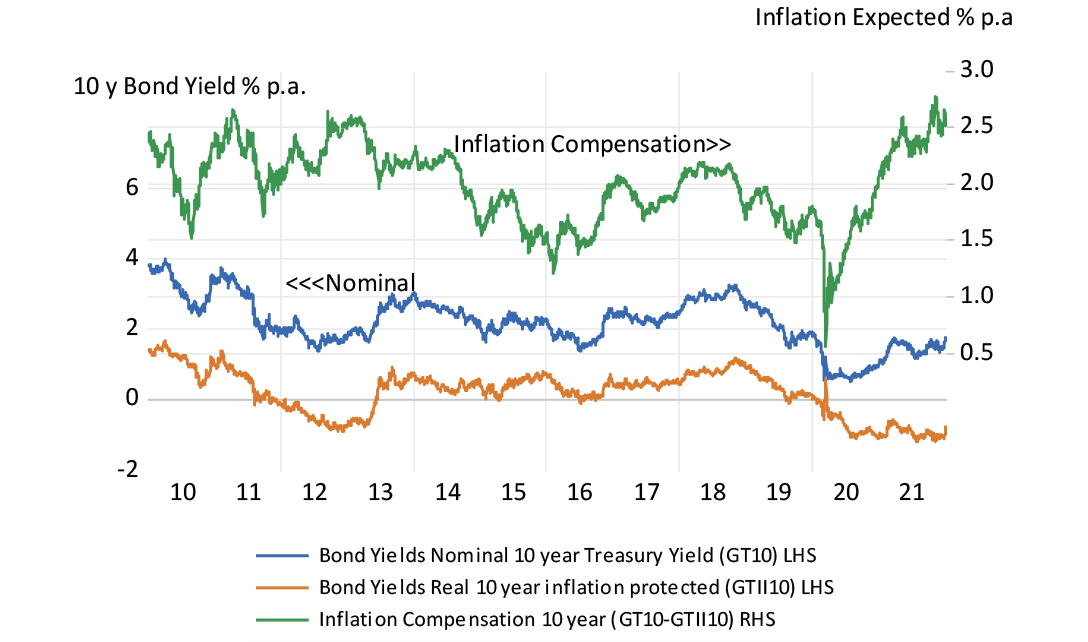
Source: Bloomberg and Investec Wealth & Investment, 12/01/2022
About the author

Prof. Brian Kantor
Economist
Brian Kantor is a member of Investec's Global Investment Strategy Group. He was Head of Strategy at Investec Securities SA 2001-2008 and until recently, Head of Investment Strategy at Investec Wealth & Investment South Africa. Brian is Professor Emeritus of Economics at the University of Cape Town. He holds a B.Com and a B.A. (Hons), both from UCT.
Get Focus insights straight to your inbox
Investec products you may be interested in

Wealth Management
We work with some of South Africa’s most successful individuals and
families to preserve and grow their wealth. Let us do the same for you.
Portfolio Management
Whether you’re wanting to grow your wealth or generate income, tap into our expertise to help realise your investment goals.

Offshore Investments
Global diversification is a must. Investec’s offshore investments give
you access to the world’s leading companies and fund managers.
Wealth Management
We work with some of South Africa’s most successful individuals and
families to preserve and grow their wealth. Let us do the same for you.
Portfolio Management
Whether you’re wanting to grow your wealth or generate income, tap into our expertise to help realise your investment goals.
Offshore Investments
Global diversification is a must. Investec’s offshore investments give
you access to the world’s leading companies and fund managers.
Browse further in