

It’s been said that your experiences in your formative years can shape your outlook and attitudes for the rest of your life. Worse, it can make us less capable of connecting with those from another generation who may have had a very different formative upbringing from our own.
Thus it is that the music we listened to in our teenage and adolescent years tends to stick with us for life and anything else that follows just doesn’t seem to measure up to the quality of music (in our own eyes) of our youth.
Financial markets are not very different. If your early years of trading or investing were characterised by a bear market in equities, then you’re likely to have a jaundiced view of equities forever. If your formative years were characterised by strong performing tech shares, then you’ll probably be a tech bull for the rest of your life.
The longer-term cycles in the gold market have had a similar impact on people. In my own case and for others who were shaped by the market trends of the 1990s, gold was something of a peculiarity, the “barbarous relic” described by John Maynard Keynes. The yellow metal had been in a slump since its heady days of the 1970s and its all-time high reached at the start of 1980 was a distant memory.
Our generation had a low opinion of commodities in general and gold in particular. However, at least copper, aluminium and iron ore had their uses in the products we used or in construction. Apart from jewellery and fillings, gold had no practical value. Far better, we felt, to back new technologies and the people behind them. We put our money into IT shares and dotcoms instead.
We viewed the older generation of gold bulls with a mix of pity and scorn: where they saw each rally in the bullion price as a sign of a new dawn, we saw only false dawns. For a long time we were right.
Unfortunately, the problem with having such an outlook of markets hardwired into our psyches at a young age was that we perhaps stopped paying attention to the asset class that we scorned the most.
Often, we could end up missing a long-running bull market completely.
20 golden years
The dotcom crash of early 2000 was a setback for the tech-loving generation. However it also signalled the start of a decent run for gold – if only those of my generation had been awake to it. While much has been made of gold’s surge in recent months to the record highs hit in early August, in truth gold has had a pretty decent 20 years, delivering a compound annual return of 10.2% in US dollars and 15.2% in rands (compare this with the JSE’s compound annual return of 13.4% and the local bond market’s 10%).
Even gold shares have not been slouches, delivering a compound annual return of 11.2% over 20 years. Not bad for a local sector that’s had to deal with problems like declining ore grades, rising costs and electricity shortages to name just a few.
These issues have seen SA’s gold production decline steadily over the years – from being the world’s largest producer a few decades ago, producing over 1000t a year in the 1970s, SA now sits in eighth position, having produced 124t in 2018.
From FAANGs to HAGs
A point to make about gold is that its gains have often been in short bursts, rather than a sustained, steady upward trajectory. This year has been a case in point. Much has been made of the performance of the Nasdaq this year, led by the famous FAANGs (Facebook, Amazon, Apple, Netflix and Google/Alphabet). Tech shares have been beneficiaries of the lockdown, with the pandemic having given e-commerce, cloud computing, digital media and online applications a permanent boost.
But the JSE’s own HAGs (gold counters like Harmony, AngloGold, Gold Fields, as well as the likes of DRDGold and others) deserve some credit too. Gold shares have flown high since lockdown started, thanks to the gold price hitting new record highs earlier in August, surging 91% year-to-date. Again, this is despite Covid-19 and the lockdowns curtailing their production.
What’s driving the gold price right now?
There’s a fair amount of consensus about what has been lifting gold. Ultra-loose monetary and fiscal policy in response to the shutdowns implemented globally from March onwards, have pushed down interest rates and raised the spectre of an inflation surge sometime in the future. When cash or bonds are offering investors zero or negative yields, the fact that gold earns no income becomes less of a hindrance for investors. This is clear from the charts below.
Gold and US interest rates
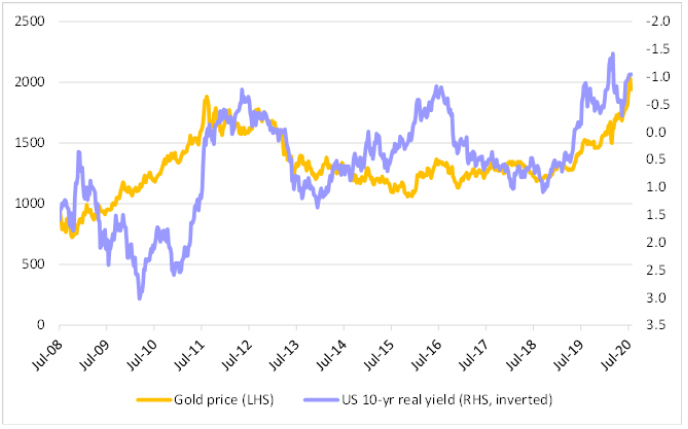
Source: Bloomberg, Investec Wealth & Investment
Gold and negative interest rates
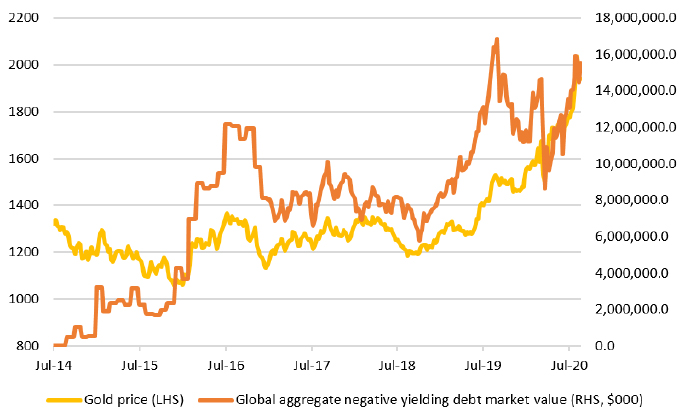
Source: Bloomberg, Investec Wealth & Investment
In this sense, gold’s role as a currency comes into play, since gold holders compare its returns with those from major currencies.
And because gold is never consumed as such, there is plenty of gold sitting in the form of gold bars, jewellery or coins in vaults around the world. According to the World Gold Council, about 197,576t of gold was sitting above ground in January this year (21.6% is private investment, 17.2% is in central bank and other official holdings, and 47% in jewellery). New mine supply is about 3,000t a year, or only 1.5% of the annual supply. As such, gold production from mines does little to change the dynamics of supply and demand.
This makes gold sensitive to short-term moves in US interest rates. This was clear through August, when the gold price pulled back after US Treasury yields began to rise. Inflation expectations, or rather expectations of how well the authorities are likely to control inflation in future. This brings us to our next question.
Where to from now?
One way to figure out how gold is likely to behave in the future is to take a look at how it’s behaved in the past. Many people associate rising gold prices with rising inflation, as was seen in the 1970s, but the picture is more complex than that. Many of gold’s best years have been during periods of low inflation, such as we have seen this year, or even during the previous rallies we’ve seen this century, when inflation has been very low or well-contained.
During its long bear market in the 1980s and 1990s, gold was a poor hedge against inflation. According to Larry Swedroe, writing in the publication Seeking Alpha, gold fell from its January 1980 high of US$850/oz to US$293/oz in March 2002. Inflation in that time averaged 3.9% in the US, meaning a loss in purchasing power of 85%.
In fact, one of gold’s best spells in real terms was during the deflationary 1930s (though it should be noted that the gold price was fixed during this period).
Gold price adjusted for inflation, 1915 to 2020 (log-scale, grey denotes recessions)
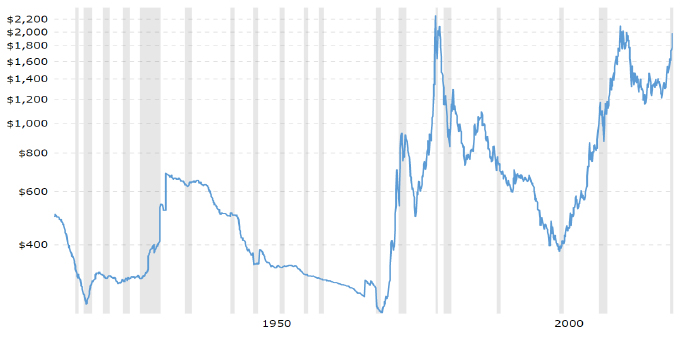
Source: Macrotrends.net
The current elevated levels for gold come against a backdrop of generally low inflation expectations. While inflation expectations may be ticking up, they remain contained below central bank target levels and are certainly not high by historical standards. Consensus forecasts are for inflation to reach 2% by the second quarter of next year in the US, China and the G20 median and then remain there.
So perhaps the better way of looking at gold is not as a bet on inflation, but rather a bet on financial market upheaval or a hedge against uncertainty. Stimulus programmes by governments and central banks, manifesting themselves in the form of vast amounts of liquidity into markets, understandably make investors edgy about how the whole thing unfolds in the coming years. So taking out some insurance through gold makes sense.
The caveat of course is that prices can be very volatile. Exchange-traded funds (ETFs) have in recent years become a popular way for investors to get exposure to gold. This poses a potential source of volatility should there be widespread selling of gold ETFs in response to a fall in the physical gold market.
Gold price and the rise of gold ETFs
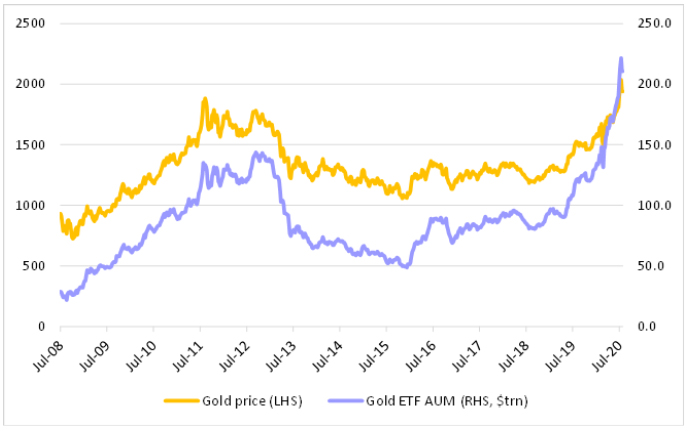
Source: Bloomberg, Investec Wealth & Investment
Periods of sharp rises in bullion have often been followed by lengthy periods of declines. Gold’s descent from its highs in 1980 was sharp, brutal and long-lasting, due in no small measure to the Fed’s determination to bring down inflation.
In the short to medium term, gold is likely to be sensitive to surprises, of both the pleasant and unpleasant variety, including the following:
- Progress in finding treatments or a vaccine for Covid-19 – here pleasant surprises may act against gold
- Inflation surprises and the impact on interest rates across the yield curve
- The willingness or ability of central banks and governments to unwind their spending and asset purchase programmes once the Covid-19 crisis is over – particularly if inflation starts to emerge.
About the author

Patrick Lawlor
Editor
Patrick writes and edits content for Investec Wealth & Investment, and Corporate and Institutional Banking, including editing the Daily View, Monthly View, and One Magazine - an online publication for Investec's Wealth clients. Patrick was a financial journalist for many years for publications such as Financial Mail, Finweek, and Business Report. He holds a BA and a PDM (Bus.Admin.) both from Wits University.
Get Focus insights straight to your inbox
Investec products you may be interested in

Wealth Management
We work with some of South Africa’s most successful individuals and families to preserve and grow their wealth. Let us do the same for you.
Portfolio Management
Whether you’re wanting to grow your wealth or generate income, tap into our expertise to help realise your investment goals.

Offshore Investments
Global diversification is a must. Investec’s offshore investments give you access to the world’s leading companies and fund managers.
Wealth Management
We work with some of South Africa’s most successful individuals and families to preserve and grow their wealth. Let us do the same for you.
Portfolio Management
Whether you’re wanting to grow your wealth or generate income, tap into our expertise to help realise your investment goals.
Offshore Investments
Global diversification is a must. Investec’s offshore investments give you access to the world’s leading companies and fund managers.
Browse further in