


Central Banks have more to offer a distressed economy than just lower interest rates. Interest rates cannot or will not be allowed to fall much below zero, however central banks can supply their economies with more of their own money, in the form of the deposits they supply to their private banks, if necessary. They can add money by lending more of their cash to their governments, private banks and even businesses. They may choose to buy back assets from banks or buy the debt or even the equity of private businesses.
Central bankers will hope that the banks will lend out more of the extra cash they will be receiving automatically from the central bank. If the banks and their borrowers respond favourably to these monetary injections, the supply of private bank deposits and of bank credit will increase by some multiple of the additional central bank money. The extra money (deposits) supplied will then not be hoarded by the public but exchanged for goods and services and for other assets. Higher share prices, more valuable long-dated debt and real estate will translate into more private wealth, leading to less saved and more spent (asset price deflation has the opposite, depressing impact on an economy).
An economy that delivers less income and output than it is capable of, is distressed. Lockdowns have disrupted output and sacrificed the incomes of businesses, households and governments in a serious way. Getting back to an economically normal state requires a mixture of increasing freedom and willingness to supply goods, services and labour. It also needs more spending to encourage firms to produce more and hire more people.
Money creation on a large and urgent scale is helping to stimulate demand almost everywhere. M2 in the US has grown by nearly 25% over the past 12 months. It has led to a more helpful response from US banks than occurred after the Global Financial Crisis (GFC), as the monetary statistics in figure 1 show.
Figure 1: Money supply growth in the US (M2)
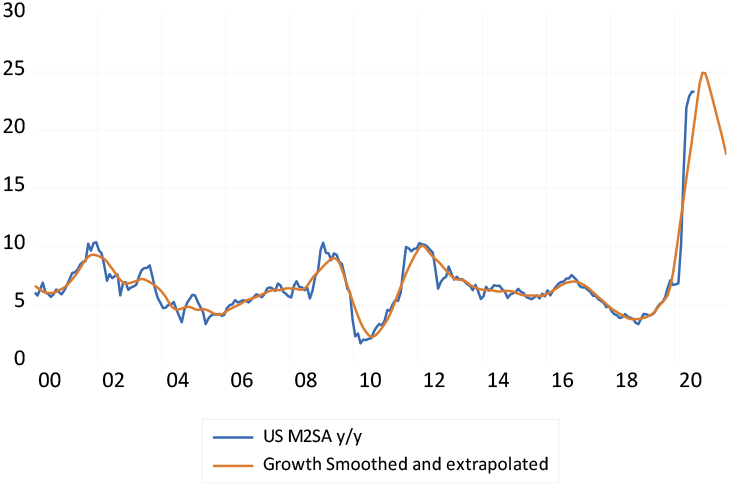
Source: Federal Reserve Bank of St.Louis and Investec Wealth & Investment
The SA Reserve Bank has adopted a very different strategy and rhetoric. It has decided that it has done all it can for the economy by cutting its repo rate associated lending rates by three percentage points, to 3.5%. It has rejected any quantitative easing (QE) that might have reduced pressure on interest rates at the long end of the yield curve. It argues that a structural inability to supply (over which it has limited influence), is the cause of our economic distress, not the state of demand, which it could influence if it chose to do so – with still lower repo rates and money creation. It is an argument that can be challenged.
Yet perhaps all is not lost on the SA monetary front. The deposit liabilities of the banks (M3) had grown by about 11% by August, compared to a year before, while the money base is up by 12.5%. This is a welcome acceleration, as figure 2 shows. Less helpfully, bank lending to the private sector was up by only 3.9%.
Figure 2: Growth in monetary aggregates
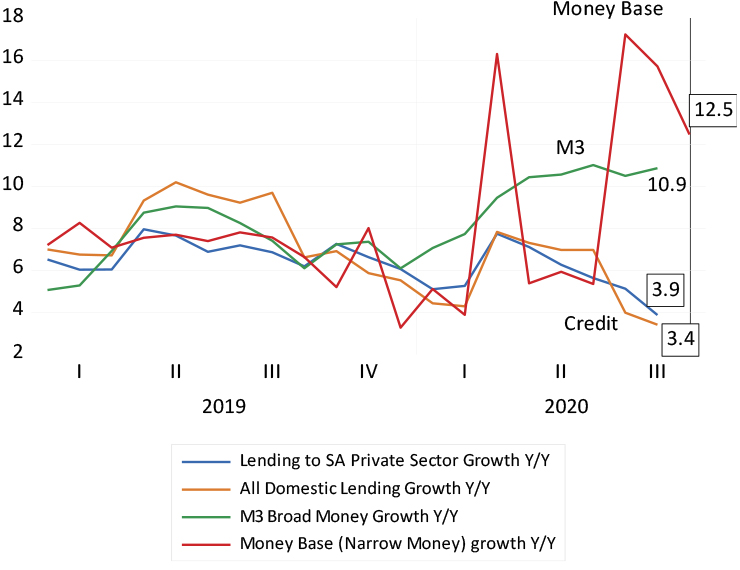
Source: SA Reserve Bank and Investec Wealth & Investment
It is possible to reconcile the faster growth in the deposit liabilities of the banks with the slower growth in the credit they have provided. The difference between the growth in bank deposit liabilities (up 11%) and assets (up by about 4%) is accounted for by a large increase in the free cash reserves of the banks. The negative difference between cash and repos narrowed by about a net R60bn in 2020. The banks have been provisioning against loan defaults on a large scale. These provisions reduce their reported earnings and therefore dividends, but it increases their cash and free reserves – represented as an increase in equity reserves. As figures 3 and 4 below show, the equity reserves and their provisions rise during times of stress, as they are doing now and did during the GFC, which led to a sharp recession in SA.
Figure 3: SA banks’ free reserves – cash less repurchase agreements with the Reserve Bank and others
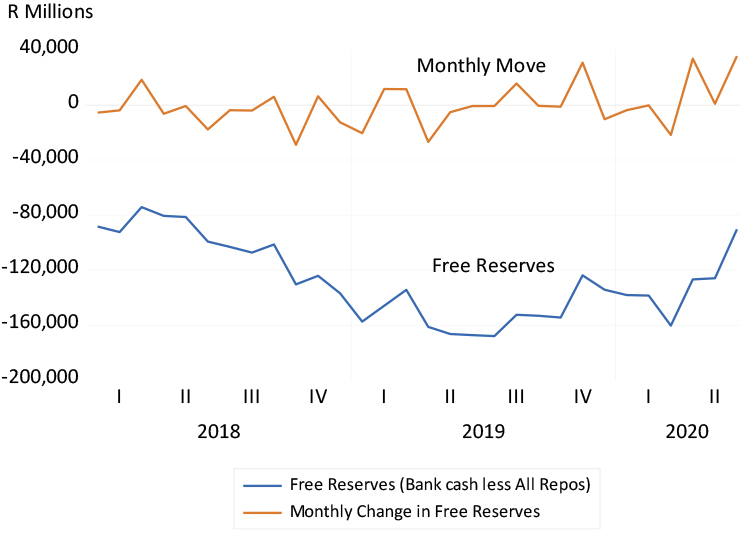
Source: SA Reserve Bank and Investec Wealth & Investment
Figure 4: SA banks’ capital and reserves (R millions)
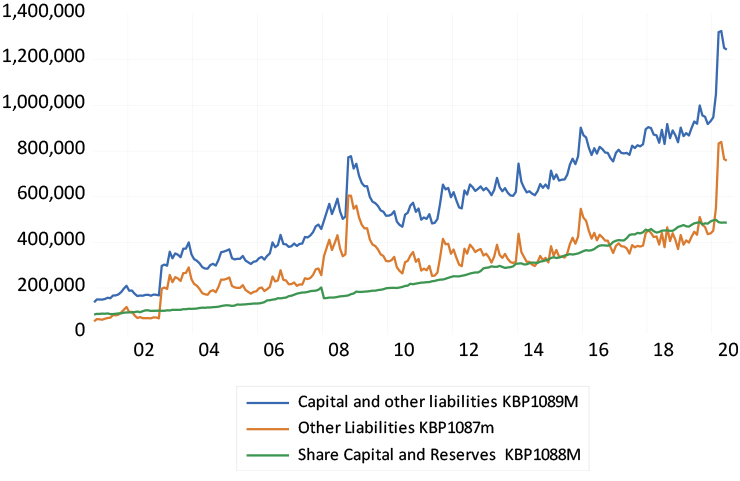
Source: SA Reserve Bank and Investec Wealth & Investment
The banks however have an attractive alternative to providing credit for the private sector. They borrow short (raise deposits) and can lend to the government at higher rates without risks of default. The currently very steep slope of the yield curve adds to this attraction as well as to the profitability of borrowing short and lending long. If long rates are the average of expected shorter term rates over the same period, the currently steep slope of the yield curve implies that short rates are expected to increase dramatically over the next five years. A one-year RSA bill is now offering 3.2%. A three-year bond currently offers 5.06% and a five-year bond 6.72% (all annual rates). The one-year rate would have to rise to more than 8.3% in three years’ time and to 11.3% in five years, to justify the current slope of the yield curve. Unless inflation or real growth surprise significantly on the upside, these higher short rates, as implied by the yield curve, make such outcomes unlikely. Borrowing short to lend long to the SA government looks like a good profitable strategy for SA banks, for now. Similarly, for the government, it favours a strategy of issuing short-term debt and then rolling it over, rather than raising long-term debt at much higher rates.
Figure 5: The spread between RSA 10-year bond yields and money market rates
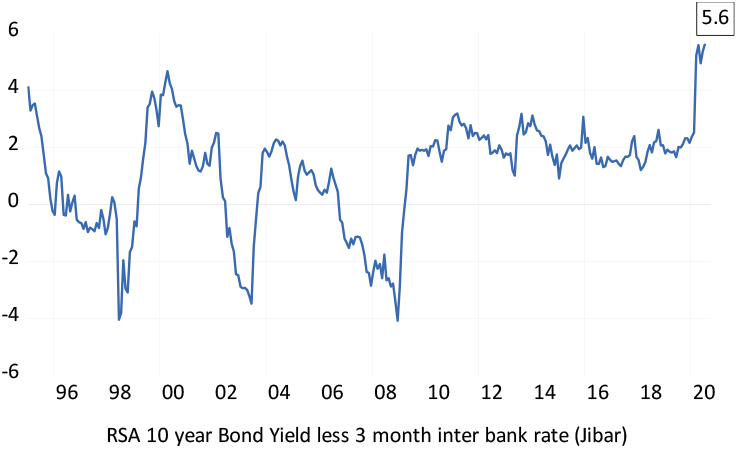
Source: Bloomberg, Iress and Investec Wealth & Investment
Figure 6: The RSA yield curve and the implicit one-year forward rates
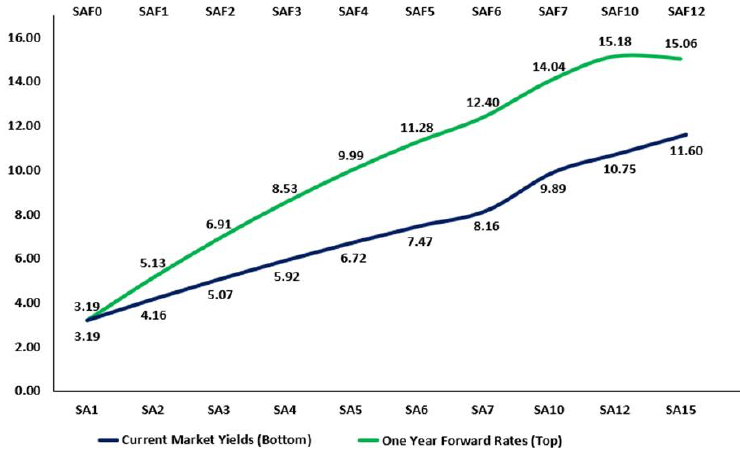
Source: Thompson-Reuters and Investec Wealth & Investment
The banks have been holding significantly more government paper over recent years in response to presumably weak demand for credit from private borrowers and the availability of relatively attractive interest rates on low-risk government paper. Government debt as a share of all bank assets is now 13%, a share that has doubled since 2010. The banks invested a further (and significant) R110bn in additional government debt between January and June 2020.
Figure 7: Bank lending to the government
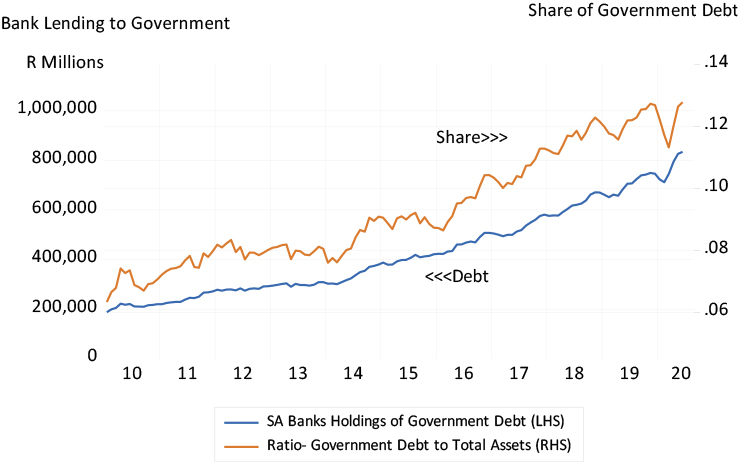
Source: SA Reserve Bank and Investec Wealth & Investment
Figure 8: Composition of bank lending to the SA government
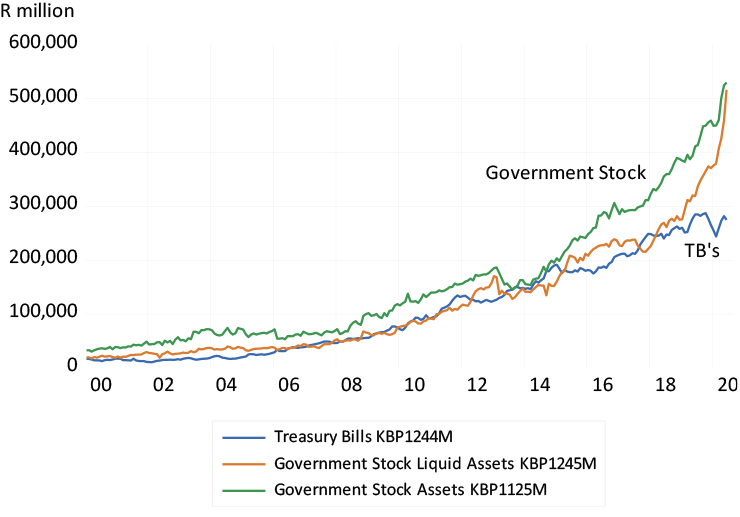
Source: SA Reserve Bank and Investec Wealth & Investment
Such extra investment in government bills and bonds by the banks is helpful to the government, given the ballooning deficit it has to fund one way or another. The growing deficits are the result more of a collapse in revenue than a surge in spending as the chart below shows. But for the banks to prefer government over private debt would effectively crowd out the lending to the private sector that could contribute to economic growth.
Figure 9: National government expenditure and revenue (monthly, seasonally adjusted and smoothed)
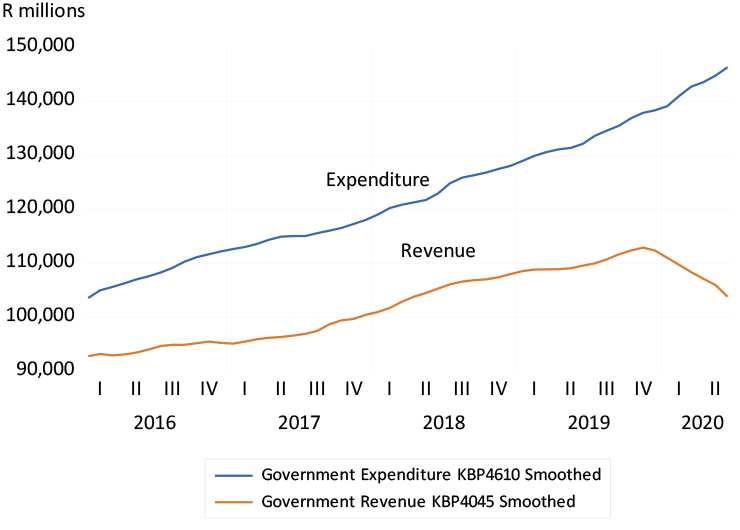
Source: SA Reserve Bank and Investec Wealth & Investment
Figure 10: Annual growth in government revenue and expenditure (smoothed)
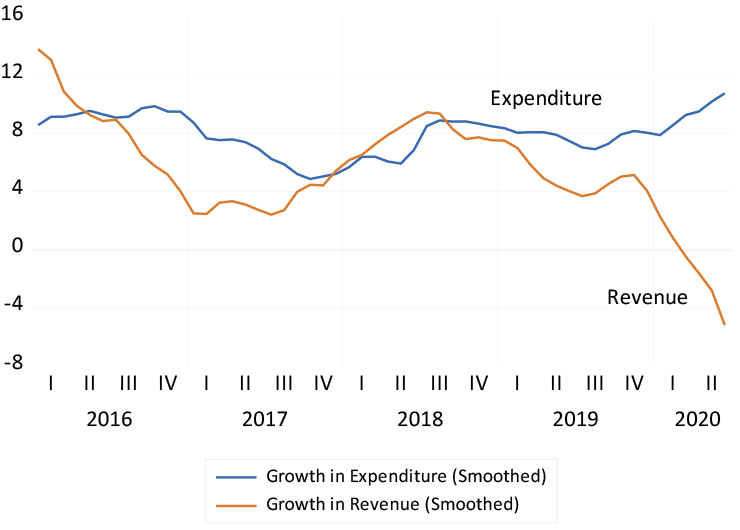
Source: SA Reserve Bank and Investec Wealth & Investment
Viewing all these forces at work leads to one important conclusion: any revival of the SA economy will depend on lower real long-term interest rates and less expensive debt for the government and taxpayers. It will also mean lower real required returns for any business. These required returns are currently extremely high, given high nominal bond yields, low inflation and the additional equity risk premium. The returns required to justify an investment in the SA economy are thus of the order of a prohibitive 10% or more after inflation. The Reserve Bank can help in the short run by managing long rates lower. However only a credible commitment to restraining government spending over the longer run can lead SA out of the burden of expensive debt.
About the author

Prof. Brian Kantor
Economist
Brian Kantor is a member of Investec's Global Investment Strategy Group. He was Head of Strategy at Investec Securities SA 2001-2008 and until recently, Head of Investment Strategy at Investec Wealth & Investment South Africa. Brian is Professor Emeritus of Economics at the University of Cape Town. He holds a B.Com and a B.A. (Hons), both from UCT.
Get Focus insights straight to your inbox
Investec products you may be interested in

Wealth Management
We work with some of South Africa’s most successful individuals and families to preserve and grow their wealth. Let us do the same for you.
Portfolio Management
Whether you’re wanting to grow your wealth or generate income, tap into our expertise to help realise your investment goals.

Offshore Investments
Global diversification is a must. Investec’s offshore investments give you access to the world’s leading companies and fund managers.
Wealth Management
We work with some of South Africa’s most successful individuals and families to preserve and grow their wealth. Let us do the same for you.
Portfolio Management
Whether you’re wanting to grow your wealth or generate income, tap into our expertise to help realise your investment goals.
Offshore Investments
Global diversification is a must. Investec’s offshore investments give you access to the world’s leading companies and fund managers.
Browse further in