
A consumer-led UK recession is not inevitable
With UK inflation at its highest in four decades and further price increases in sight, living costs have moved firmly into the limelight. In their latest research, our economists analyse the implications that high inflation will have for the finances of UK consumers.
Surging inflation and tax hikes will inevitably result in a squeeze on discretionary spending for some UK households, particularly those on lower incomes and with few or no assets. Despite this, at the aggregate level, we expect that the hit to consumer spend will be cushioned by the extremely tight labour conditions and sound household balance sheets. As such, although we do foresee a slowdown in household consumption over the coming year, we do not expect that a consumer-led UK recession is inevitable.
Still, accelerating inflation will have important repercussions for Gross Domestic Product (GDP) more broadly, and for whether the economy can avoid a recession. After all, household consumption is the largest component of GDP by expenditure – some 61% in the first quarter of 2022. There are also sectoral implications: the higher the share of household incomes that has to be used to cover essential bills, such as food, energy and housing, the greater the squeeze will be on discretionary spending on other goods and services.
Accelerating inflation will have important repercussions for whether the economy can avoid a recession.
In general, there are three ways for households to fund their consumption: through disposable income; from prior wealth; or through borrowing. Out of these, disposable income is typically the key component. For most households, labour is the primary source of income. Therefore, employment and wage growth matter. At first glance, the current labour market conditions suggest support for incomes and thus consumption. Indeed, the UK is experiencing the tightest labour market in decades, as illustrated by the ratio of just over one-to-one in vacancies to unemployment. Intense competition for workers should exert upward pressure on wages. Aside from the direct boost this gives to nominal incomes, it may also entice more people back into the labour force, helping to lift the UK’s stubbornly low post-pandemic participation rate. In the event of a plunge in GDP, labour demand could plummet too, reversing these dynamics; but despite a fall in confidence, there is certainly no sign of that yet.
What is key for consumption, however, is real disposable income. Here, the outlook is less rosy for the UK consumer. Given the surge in inflationary pressures and fiscal tightening, we are looking for a near 2.5 percentage point contraction in real disposable income over the course of this year. This encompasses our expectation that Consumer Price Index (CPI) inflation will peak at 10.2% in October 2022 as well as the 1.25 percentage point National Insurance (NI) contribution hike that came into effect last month.
All else equal, a contraction of this size would weigh on household consumption and would likely exacerbate inequality. The government has announced some targeted measures to mitigate part of the utility bill hit. Lower income households are also aided by the 6.6% increase in the National Living Wage in April. Additionally, those earning below £35,000 will be protected from the 1.25 percentage point NI hike and will actually see their bill fall this year thanks to the increase in the threshold for NI payments from July, as estimated by the Institute for Fiscal Studies. However, many argue that these measures are not enough to support households struggling with the soaring costs of necessities and do not help those that do not receive any labour income. On this point, benefits were only uprated by 3.1% at the Spring Statement, whereas the annual rate of CPI inflation hit 9.0% in April. In real terms, benefits are falling.
Meanwhile, for the approximately 25% of households with mortgages, rising mortgage rates will act as another squeeze on household budgets. As per estimates by UK Finance, although only 25% of UK mortgages are variable and thus immediately exposed to rising rates, of the 75% of mortgage holders on fixed-term contracts, there are 1.5 million expiring in the UK this year and a further 1.5 million next year. Those currently looking to renew an expiring two-year fixed contract are facing an increase in rates of one percentage point, whilst for a five-year contract this is 0.3 percentage point, which is set to rise further. How households mitigate the increased cost burden will be crucial for the outlook on household consumption.
Chart 1: Those on expiring fixed-term mortgages face substantial increase in rates
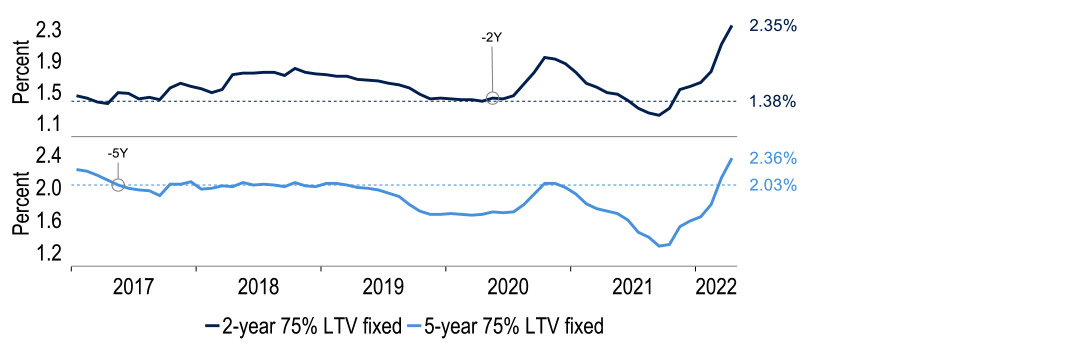
Sources: Macrobond, Investec
However, in aggregate, consumption and income do not move one-to-one, as consumers – except those at the lowest end of the income distribution – tend to save some of their income. Faced with an unexpected jump in inflation, households may therefore initially choose to save a smaller share of their current income than they would have done otherwise. This is a type of ‘consumption smoothing’ in the face of income fluctuations that economic theory predicts. (If inflation persists, households may factor this into their expectations and over time actually raise their saving rate. But we do not anticipate inflation to persist long enough for this to occur.) At the latest data point – in the fourth quarter of 2021 – the household saving ratio was 6.8%. As recently as in the first quarter of 2017, it was at a trough of 3.5%; and in the first quarter of 1999 it plummeted to 2.8%. Our forecasts envisage a trough of 3.9%, to be reached in the second quarter of 2023. Under this assumption, household consumption growth is predicted to run at +3.9% in 2022, even though real household disposable incomes should fall by 2.4%.
Chart 2: As the cost-of-living crisis bites, real household consumption growth stalls
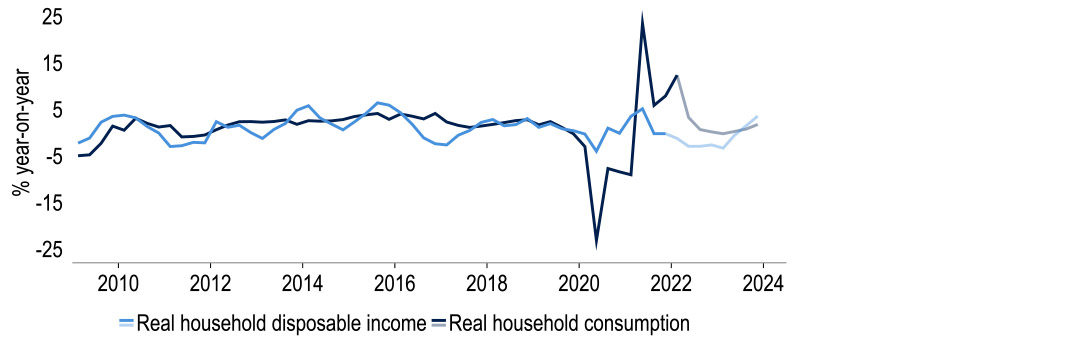
Sources: Macrobond, Investec
This sort of gap looks staggering. But in fact, it is boosted by base effects from the paths of real incomes and consumer spending through 2021. Mathematically, were both consumption and household disposable income to remain steady at their first quarter level throughout 2022 (this is an estimate, as first quarter disposable income data is not yet published), their annual rates would show a rise of +4.1% and zero growth, respectively. This makes it clear that in our forecasts we are actually looking for the level of consumption to fall below its current level for the rest of the year, although only slightly; and we see a further clear hit from inflation on real incomes, on top of what has taken place already.
Another way to put our forecast into context is to consider, instead, a case in which the saving ratio stays at what we estimate it to have been in the first quarter of the year, i.e. consumption changes at the same pace as incomes from here. If so, our forecast real income growth of -2.4% would yield real household consumption growth that is 2.25 percentage points lower than in our base case, at just +1.6%. In other words, our forecasts rest heavily on the assumption that the saving ratio can and will fall to sustain consumption.
Chart 3: A smaller proportion saved would help households sustain consumption
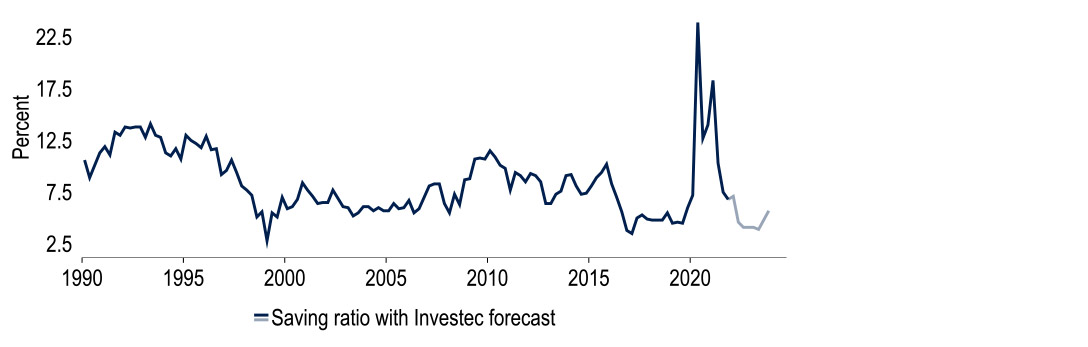
Sources: Macrobond, Investec
Moreover, it is not just the flow of savings out of current income that households can adjust, but the stock of savings previously built up that they can draw down. Such ‘rainy day funds’ can help fund consumption in the face of the unexpected inflation surge. As it happens, the pace at which households have added to their savings, in the form of cash in bank accounts, jumped during the pandemic – a legacy of incomes being largely maintained, with government support through furlough schemes, but certain goods and services being unavailable. We have described this build-up of bank deposits beyond its previous trend as ‘excess savings’. We estimate that currently, these amount to £158bn (equivalent to nearly £2,400 per head), down only marginally so far (by £2.1bn) from their October 2021 peak. These excess savings alone would cover 11% of total annual household consumption, equivalent to nearly 6.5% of GDP. And of course, household bank deposits more generally, not just excess ones, can represent a buffer to smooth over income volatility – and the excess is just 9% of the total.
Related to this, and a significant counterweight to the rising mortgage payment burden noted above, it is in fact not clear that the rise in interest rates will be a net negative for the cash flow of the household sector as a whole. Indeed, households currently receive almost as much in interest as they are paying out to service debt. (Unsurprisingly, gross flows of interest paid and received by households evolve closely in line with interest rates.) It is non-financial firms and the government, both net payers of interest, for whom higher interest rates are a negative; to the UK household sector, they are largely neutral. Even so, higher interest rates may yet hurt total consumer demand: though ample in aggregate, savings are not equally distributed. Indeed, it is the least well off that tend to have the fewest savings in proportion to their income, and thus the smallest buffer.
Chart 4: In aggregate, households receive virtually as much interest as they pay
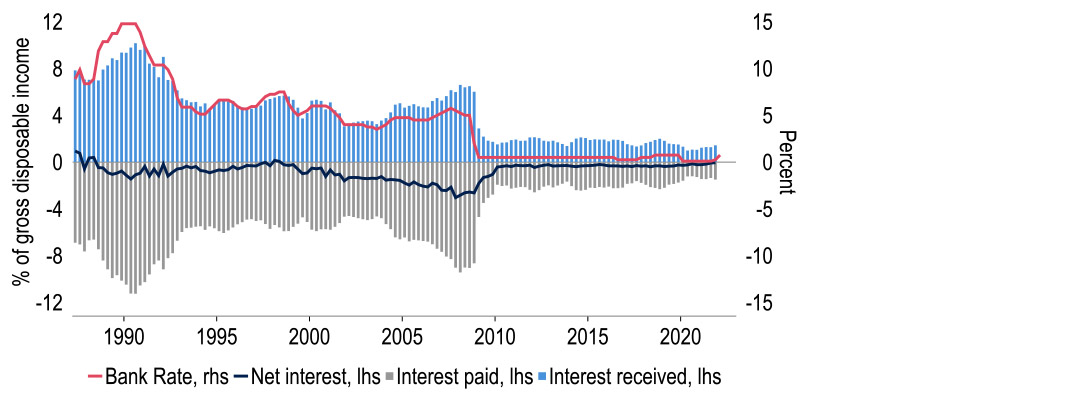
Sources: ONS, Macrobond, Investec
Nor is it clear in general to what extent households will draw down their assets to fund spending. Academic studies give a wide range of estimates for ‘wealth effects’ measuring how much of an extra £1 in wealth is consumed. A reasonable ballpark figure appears to be a so-called ‘marginal propensity to consume’ of 6p for every £1 of additional financial wealth. The extra utility bills of April alone amount to around £20bn – and of course these are only one of several sources of price rises. Were 6% of excess savings spent (£9.5bn), this would only absorb a small portion of the extra living costs. In that case, sharp cutbacks in discretionary spending could follow. But consumers may be able to draw down excess savings far more easily than other financial wealth. Additionally, our hunch is that, given these savings were unplanned, households may be prepared to spend a far larger part of them than usual rather than sacrificing discretionary spending. And of course, it is not just excess bank deposits but also rising housing and stock market wealth that needs to be considered. Both of these are up relative to pre-pandemic levels, which will provide a further potential source of funding (or at least extra collateral for borrowing, for those households that own these assets). Finally, even those without such assets who have little choice but to use unsecured debt may find access to credit easier, and the terms at which it is offered better, given the very strong labour market.
In conclusion, the double whammy of surging inflation and tax hikes is undoubtedly hitting UK consumers and making for a tough backdrop, as is widely discussed in the press. Some squeeze on discretionary spending looks inevitable for certain households – especially those on the lower end of the income distribution and with few or no assets. Even in aggregate, the share of disposable income spent on energy alone stands to jump from 5.6% pre-pandemic to 9.0% by the fourth quarter of 2022, its highest since 1985 according to our estimates. This will, in our view, make additional government support beyond that already announced inevitable, at the latest in the autumn if utility bills surge once again, but quite possibly beforehand. However, we believe even the gloomiest scenarios underestimate the extent to which the extremely tight labour market and sound household balance sheets can provide a counterweight. It is by no means certain, but it looks plausible to us that a lower saving rate will prove enough of a buffer against most of the hit, leaving consumer spending only slightly lower through the remainder of 2022. Even if the path to a consumer-led recession narrows the higher inflation turns out, it is not inevitable. But a period in which inequality and societal pressures will be exacerbated looks highly likely. These are key issues in their own right, beyond GDP.
Chart 5: By October households are expected to spend 9% of disposable income on energy*
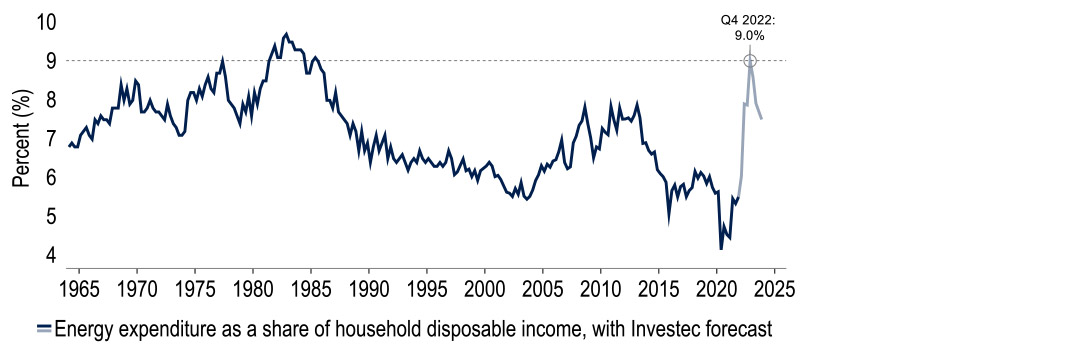
* Assumes volume of energy consumed remains constant from Q4 2021. Household disposable income excludes imputed transactions.
Sources: ONS, Macrobond, Investec
From the current £1,971 to about £2,800, Chancellor Rishi Sunak significantly upped the UK government’s response to the cost-of-living crisis. In total, the measures outlined added up to a further £15bn of government spending.
The package is skewed towards extra help for those outside the labour market and not benefitting from the current wage and employment gains. Aside from a £500m rise in the Household Support Fund administered by local councils, it has three key planks: eight million people on means-tested benefits will receive a one-off £650 payment into their bank accounts; around eight million pensioners will receive an additional winter fuel allowance of £300; and around six million disabled people will receive an extra £150.
Together with previous measures, this means some of the most vulnerable households will receive total help worth £1,200 – covering the energy price cap rises of April 2022 and the likely October 2022 increase in full. But the cost-of-living crisis will nevertheless be felt: other parts of the expenditure basket – including food – are now visibly more expensive.
The government has also turned what was in February intended as a repayable zero-interest £200 loan to every household via their electricity bill from October into a non-repayable grant, and doubled its size to £400. Arguably, this makes the true fiscal support now relative to what was put on the table in February some £5bn higher.
Another U-turn has come on the funding side. Having voted down Labour’s call for a windfall tax on North Sea oil and gas producers as recently as 17 May, the chancellor imposed just that, at a rate of 25%. He also did not rule out the possibility of extending this at a later stage to electricity generators. However, he also introduced 91% tax relief on such investments.
In total, the government hopes to raise £5bn through the windfall tax. Set against all the measures to address the cost-of-living crisis – £37bn or around one and a half percent of GDP – this is by no means sufficient to cover all of them. The rest would appear to come from higher borrowing and using some of the ‘war chest’. Bringing the public finances into better shape has been de-prioritised in light of the size of the squeeze to household budgets.
It is not obvious how the announcement will be treated in the CPI. The Council Tax rebate in April was regarded as a fiscal transfer to households rather than affecting consumer prices. In light of the initially proposed £200 loans from October, the CPI forecast was not lowered either. If the £400 grant is treated in the same way, the announcement may not impact measured CPI inflation at all.
That is not to say that the burden of higher consumer prices is not being alleviated. Unquestionably, what Sunak has put on the table represents a meaningful step up in the government’s response to an issue at the centre of public attention, which is felt by all – most so the least well off. The case for avoiding a consumer-led recession looks even stronger now. Nevertheless, some of the burden of the terms of trade shock will continue to fall on households, and taxpayers will shoulder more of the pain.
Get more FX market insights
Stay up to date with our FX insights hub, where our dedicated experts help provide the knowledge to navigate the currency markets.
Browse articles in
Please note: the content on this page is provided for information purposes only and should not be construed as an offer, or a solicitation of an offer, to buy or sell financial instruments. This content does not constitute a personal recommendation and is not investment advice.