
Bonds and swaps have been volatile with multi-year high yields seen in early July, but which have retraced thanks to comforting inflation figures for June. A further moderation in inflation, our base case, is expected to allow central banks to reach terminal rates this summer. However cumulative tightening over the last 18-months is expected to generate a slowdown in activity, with recessions in the US and UK still our central view. Our view on global growth is unchanged at 2.7% (2023) and 2.9% (2024). However China is a concern given signs of a stalling recovery, with our forecast for 2023 downgraded to 5.1%. Additionally, a weakening property sector and pressures on developers adds to the risks. And whilst a Politburo meeting this week stated that it would step up support for the economy via the implementation of ‘macro adjustments in a precise and forceful manner’, the details on actual policies were lacking. These could be key determinants of China’s macro outlook this year.
Inflation is moderating decisively, including various categories where price pressures had remained stubbornly firm, including shelter. Although ‘official’ data are mixed, the Atlanta Fed index points to some moderation in wage growth, which if accurate, should help the medium-term inflation outlook. High levels of vacancies are impacting labour force dynamics, probably limiting any rise in unemployment. Furthermore we estimate that US households still (in aggregate) have $1.9trn left of pandemic related savings, which continue to support consumer spending. We have pushed back our view of the timing of a likely (mild) recession to Q4 this year but overall we maintain our call that a Fed funds target range of 5.25-5.50% will prove the top of the cycle. We also see 125bps of rate cuts over 2024, a similar outlook to that currently priced in by markets.
There has recently been a shift in tone from even the most hawkish ECB Governing Council members, indicating greater optimism that inflation could fall towards target sooner than the latest (June) Staff Projections envisaged. This, along with some more promising actual and underlying core HICP figures and also signs that bank lending is being scaled back amid subdued growth, suggests that what looks the ECB’s next rate hike (this week) could also be its final one for the current cycle. The ECB will no doubt stress data dependency rather than firmly commit to this. But a below-trend growth outlook (our forecasts remain 0.5% for 2023 and 1.2% for 2024, as before) may well allow a pause in September that could then turn out to be prolonged.
There was finally some more encouraging news on the inflation front since the last Global with headline CPI for June cooler-than-expected at 7.9%. Alongside a slight rise in the unemployment rate and a soft set of PMIs, the question has been raised whether the Bank of England will lift the Bank rate by another 50bps at its next meeting (3 Aug) or opt for a smaller 25bp increase. Although we think it is a tough call, we are leaning towards the view that the Bank’s concern over sticky services price inflation and persistent private sector regular wage growth will on balance lead the majority on the MPC to vote to do more now. Our base case is for a half point move to 5.50%, on the assumption that if this does prove to be too much, it can be undone at a later date.
Global
Over June and early July the main market theme was a global sell-off in bonds, driven by a run up in rate expectations. Nowhere was this more evident than in the UK as the risk of a 6.75% terminal Bank rate was priced in and 2y gilt yields surpassed the post ‘mini’-Budget peak. However multi-year highs in yields were not limited to the UK. 2yr US Treasury yields for example breached 5%, levels not seen since 2007. We questioned these moves given the macro newsflow at the time and indeed there has subsequently been a retracement, with UK peak rate pricing easing to 5.75%-6.00% (see UK section), led by encouraging inflation news on both sides of the Atlantic.
Chart 1: Bond yields and swap rates have eased from their highs
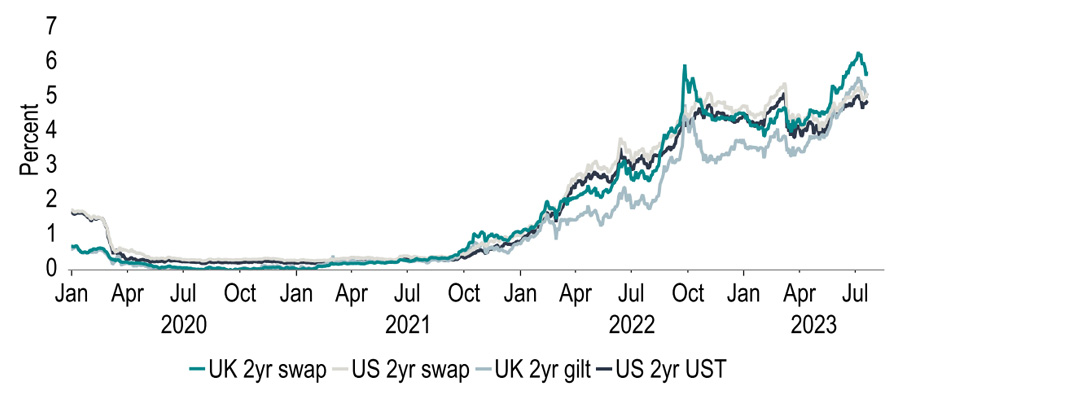
Source: Investec Economics, Macrobond
Certainly, some comfort can be taken from the latest global inflation readings. June’s US CPI inflation moderated to 3.0% and the core measure fell to 4.8%, its lowest level since Oct-21. More welcome still has been the UK breaking its run of four consecutive above consensus readings for headline and core inflation. Broadly, sentiment is latching onto the prospect that global underlying price pressures, whilst still elevated, are beginning to turn lower and that we may be close to peak interest rates. Indeed, our central view (as at 25 July) continues to be for just one more 25bp hike from both the Fed and the ECB, based on our forecasts for more benign inflation.
Chart 2: Globally, we expect inflation to continue lower
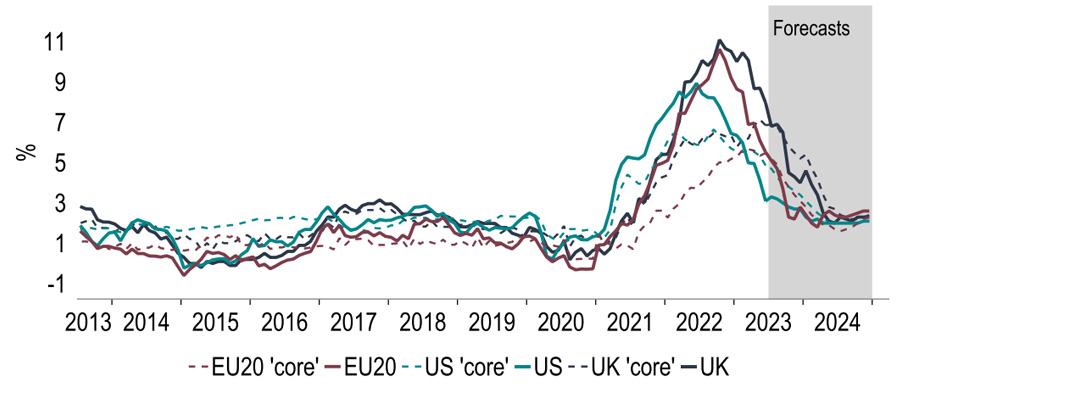
Source: Investec Economics, Macrobond
A hope is that easing inflation pressures allow central banks to avoid the need for a material further tightening, fostering a soft landing, given that growth is holding up, albeit uninspiringly so. However we are doubtful that inflation will return to 2% sustainably without some form of slowdown. Indeed we continue to expect a US recession, although we have moderated the extent of the expected contraction, pushing up our 2023 GDP forecast to 1.5%. An area of the global economy that is more of a worry is China, where there are clear signs that the recovery is stalling. We have downgraded this year’s forecast to 5.1% (from 5.5%). In the context of our global growth forecasts, these two changes effectively offset each other, with 2023 and 2024 unchanged at 2.7% and 2.9%.
Chart 3: Global growth: US upgrades offset a weaker China outlook
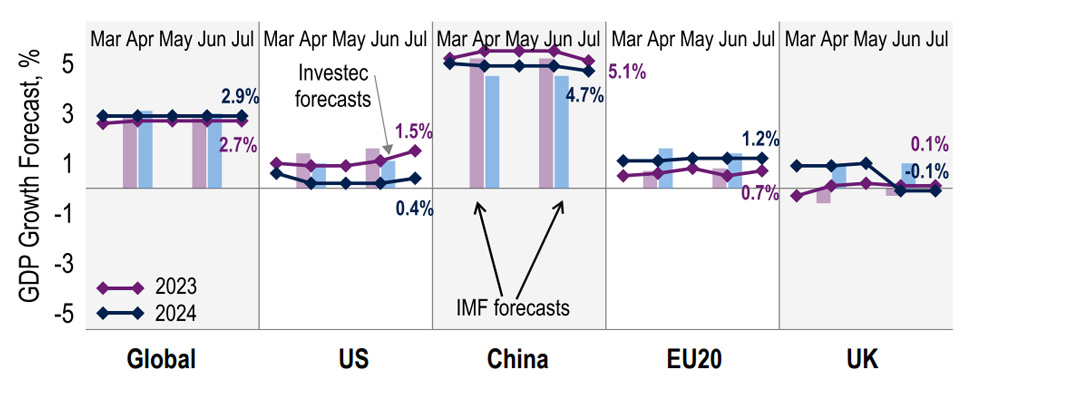
Source: Investec Economics, Macrobond
We are relatively downbeat on China, particularly in light of recent data that point to an economy struggling for momentum. In Q2, GDP growth stood at 0.8% (q/q), a sharp deceleration from Q1 (2.2%). Hampering the recovery are both external trends- world trade is currently below Nov-22 levels- and domestic demand, with consumers reluctant to spend pent up pandemic savings. Problems in the property market are an additional issue and risk to the outlook. Following some stabilisation earlier this year, signs of weakness are appearing again. Home prices fell in June, whilst sales are declining, a backdrop which is putting pressure on developers and their funding. This in turn has triggered worries over defaults, pressuring bonds and equities.
Chart 4: Chinese housing market stabilisation looks to have been short lived
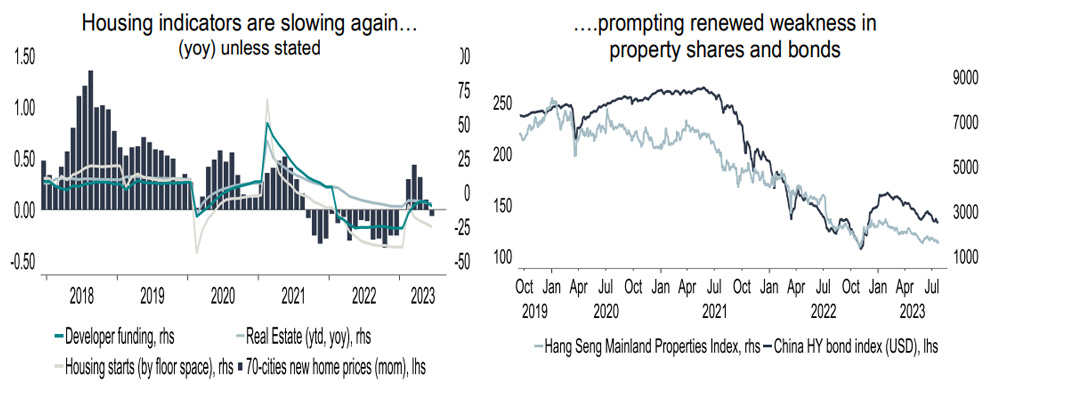
Source: Investec Economics, Macrobond
In the global context, the dynamic between inflation and rates clearly has a macro relevance, but also of course implications for various markets. In the equities space we would point to the latest research from our Equity Strategy team. This highlights the correlation between the FTSE 250 and UK peak rate expectations, which given the potential for the latter to ease further as inflation retreats, lends a positive case for UK midcap stocks. This assessment is further supported on valuation grounds given that UK equities are ‘cheap’ not only relative to historic multiples, but also attractive on a relative basis compared with other European and US peers (Chart 5).
Chart 5: Valuation range for US, European and UK equities (12m forward P/E)
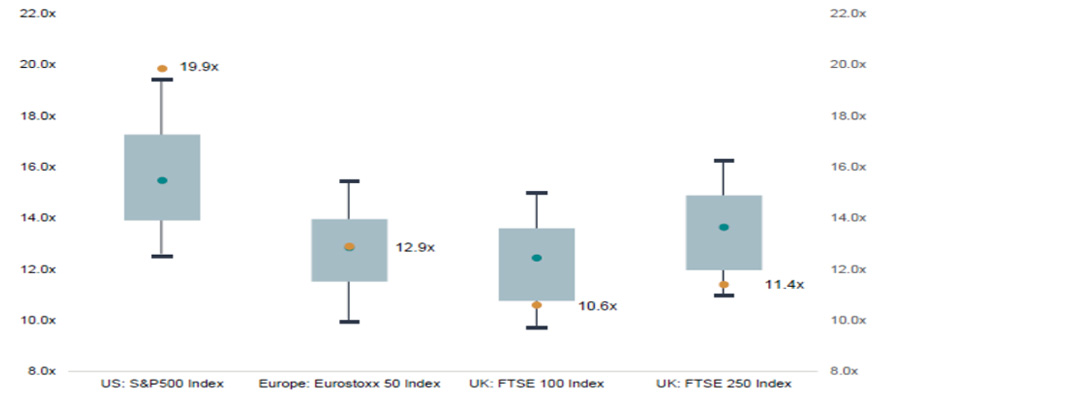
Source: Investec Economics, Investec Equity Strategy
These shifting macro views have also had a notable impact on the greenback, where the easing in US rate expectations has supported improved risk sentiment and also a narrowing of interest rate differentials versus the USD. This has contributed to a 2% fall over the last month on a trade weighted basis. Among the top performers have been those currencies that endured a weak H1 performance against the USD, such as the NOK. Even currencies which are facing domestic issues such as the Rand have gained on the better sentiment. But there are those where domestic factors are overriding the general dollar move such as the CNY where worries over the economy prevail.
Chart 6: 1-month currency performance versus the US dollar
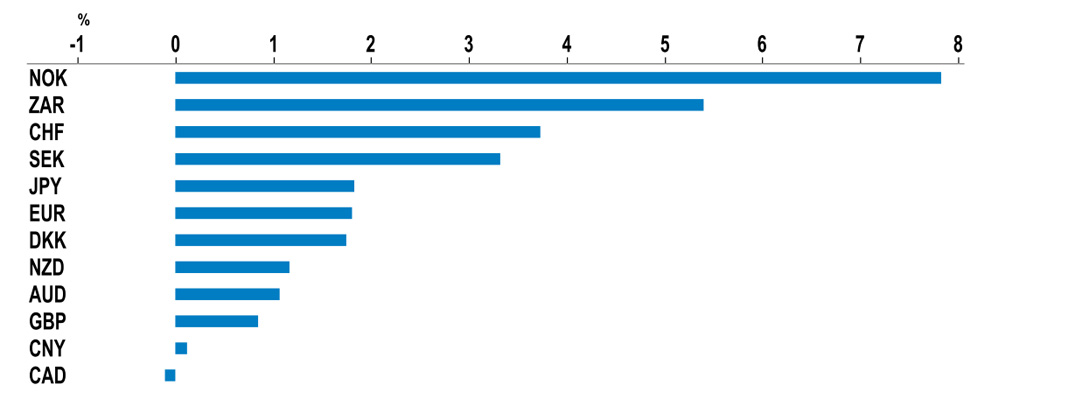
Source: Investec Economics, Macrobond
United States
CPI inflation in June fell to a 27-month low of 3.0%. ‘Troublesome’ categories in the price basket seem to have turned decisively for the better. For example, shelter is now rising at a 3-month annualised rate of 6.3% (peak 9.2% in March) and food 1.3% (peak 12.7% in August 2022). In recent months senior FOMC members have warned that ‘core’ inflation measures have been sticky, particularly in services. In this respect, it is encouraging that the core y/y rate (i.e. ex-energy services & shelter) in June dropped decisively by 0.7% pts, also to reach 3.9%. Much of this good news should filter through to the Fed’s favoured PCE based measures (due on 28 July).
Chart 7: Recent moves in key CPI categories show lower price pressure (figs. are 3m annualised)
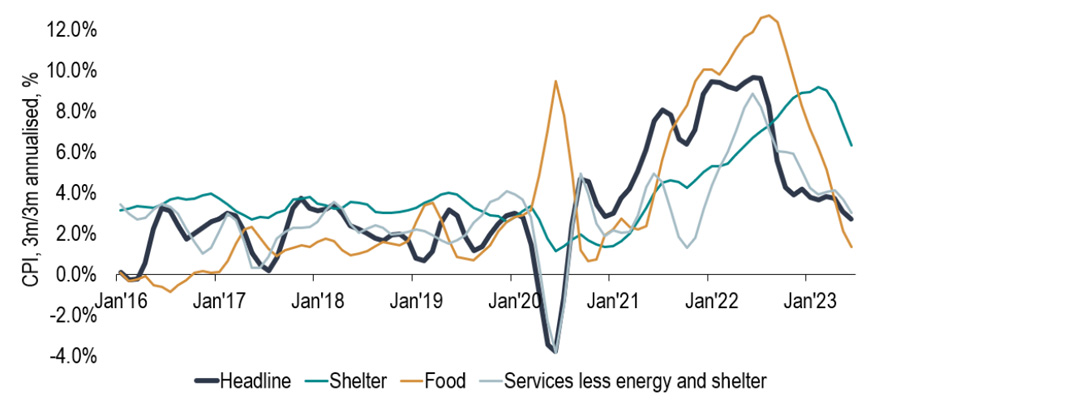
Source: Investec Economics, Macrobond
Due the same day is another indicator under close Fed scrutiny, Q2’s Employment Cost Index (ECI). Q1 data were surprisingly robust, showing a quarterly increase of 1.2% in wages & salaries. The former was up by 5.0% on a year earlier, little changed from Q4 2022’s 5.1%. By contrast the monthly average hourly earnings measure has clearly eased since last year, though June’s reading of 4.4% (yoy) is still firm. This measure though is calculated as a simple average and is not 'mix adjusted' for specific job types, as is the ECI. However the Atlanta Fed Wage index is mix adjusted and does point to recent easing in pay pressure which might well be reflected in the forthcoming ECI.
Chart 8: Atlanta Fed index suggests that the Employment Cost Index may soften
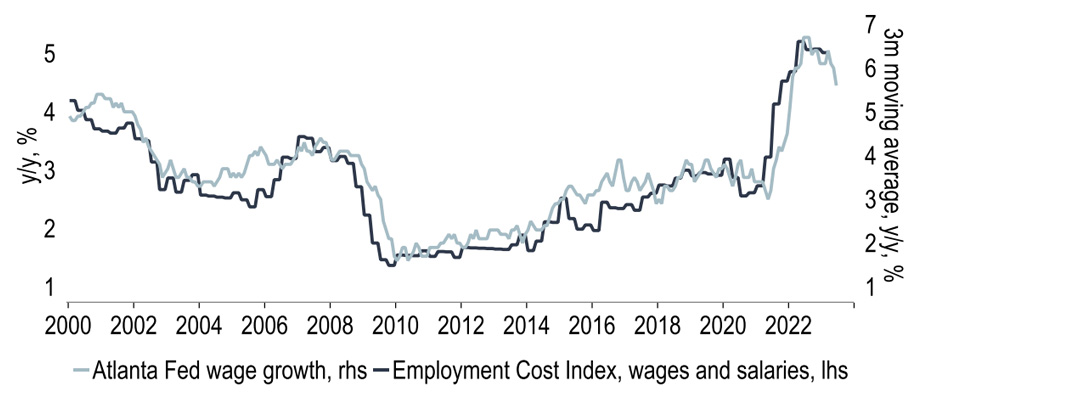
Source: Investec Economics, Macrobond
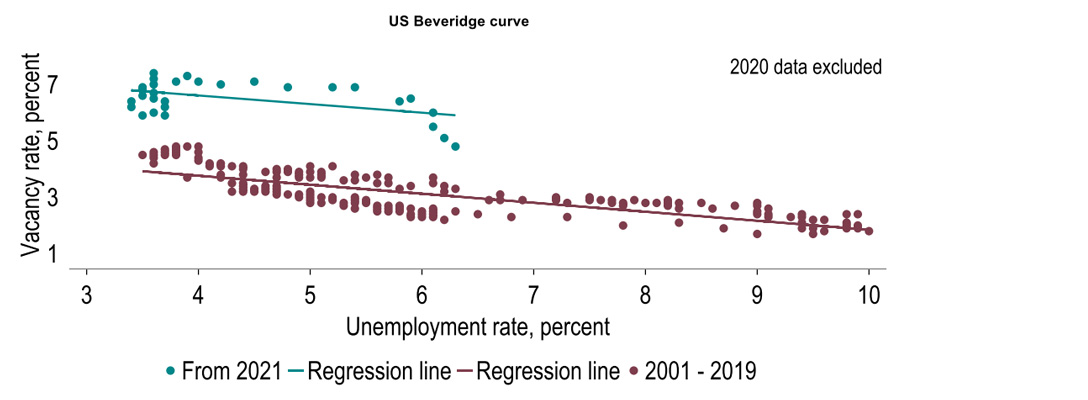
Meanwhile jobs growth has slowed. Non-farm payrolls rose by a relatively modest 209k in June, the first sub-consensus number for 15 months. Private sector employment has softened too - June's 149k gain was the smallest increase since Dec 2020. But the inflationary dynamics of the labour market are complex and payroll outturns can reflect supply as well as demand. For example, we argued in late-2022 that high payroll growth then partly reflected better supply conditions as participation rates recovered. In addition to the low headline (U3) rate of unemployment, vacancy rates remain elevated (level: 9.8m, rate:5.9%). This may mean that the ‘Beveridge’ curve has shifted out and with it a more entrenched risk of stronger pay trends over the medium-term.
Chart 9: A new vacancy/unemployment rate relationship?
Source: Investec Economics, Macrobond
Consumer spending momentum remains solid after the early year surge. A likely reason is that many households still have ‘excess’ savings built up during the Covid pandemic. A recent Fed paper estimated that a cash pile of $1.6trn had recently been depleted. But its calculations were based on flows of funds and assumes the saving rate would have risen further in the absence of the pandemic. Our methodology assumes that without Covid, household bank deposits would have risen in line with disposable incomes. Using this approach, we conclude that 53% of pandemic savings remain, implying that consumer spending could support the economy for a while longer.
Chart 10: Do households still have excess savings? We think so. A recent Fed paper does not.
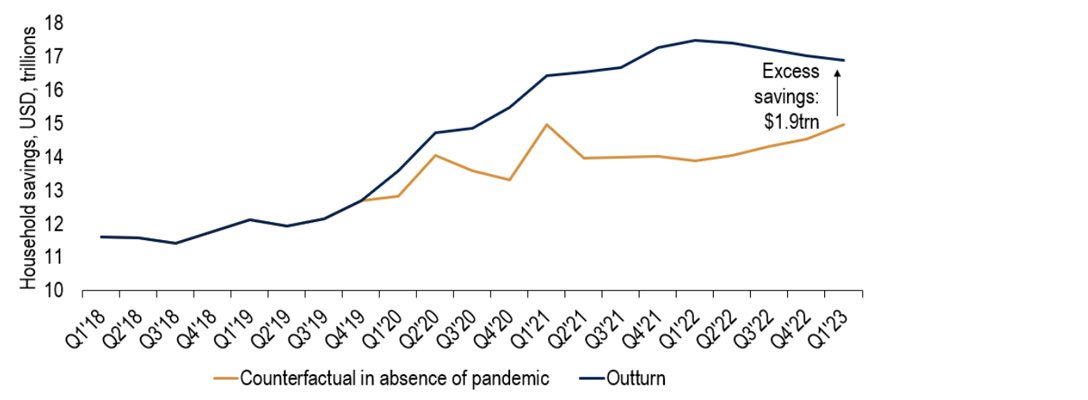
Calculated relative to if ratio of deposits to HDI stayed at Q4’19 level.
Source: Investec Economics, Macrobond
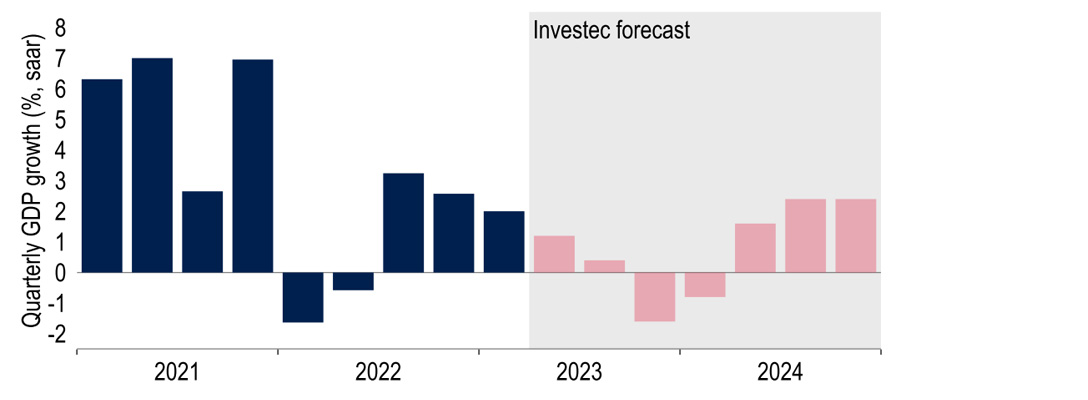
This may be partly offset by a resumption of student loan repayments from 1 Oct after a 3-year Covid moratorium ends. Also President Biden’s attempt to forgive $400bn of the total $1.8trn pile of student debt was overturned by the Supreme Court. Payments are estimated to be in the region of $200bn per annum, or 1.1% of total consumer spending. Overall the economy has exhibited more positive momentum than we had judged. While our base case is that the economy will enter a recession (at least on the non-US definition of two quarters of falling output), we have pushed the start date out to Q4 this year from Q3. We have also upped our GDP forecasts to 1.5% this year and 0.4% next (from 1.1% and 0.2%).
Chart 11: Economy is stronger for longer, but recession still on the cards?
Source: Investec Economics, Macrobond
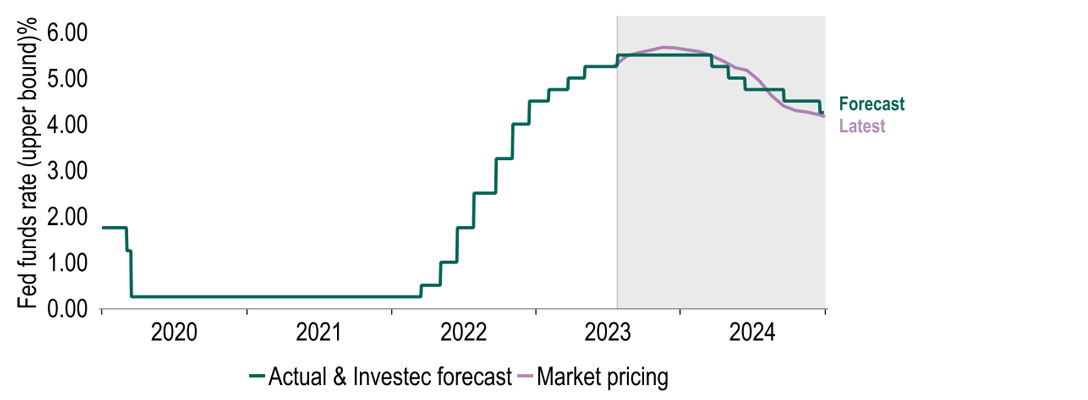
A 25bp hike in the Fed funds target range to 5.25%-5.50% on 26 July was looking a near certainty. What is less clear is whether this will be the terminal rate or if the FOMC will continue to lift borrowing costs in September. The median view in June's 'dot plot' was for two 25bp hikes, but markets (and ourselves) have been sceptical. Admittedly labour market conditions remain tight and pandemic savings will probably fuel spending for a while longer. But inflation is coming down more decisively and wage growth seems to be moderating. Accordingly we stand by our view that 5.25%-5.50% will prove to be the terminal rate and that the Fed will ease next year to make its stance less restrictive. As Chart 12 shows, given the market rally recently our views are more or less aligned with the yield curve.
Chart 12: Our view of Fed policy is now in the same ballpark as markets…
Source: Investec Economics, Macrobond
Eurozone
Signs are increasing that sharply tighter monetary policy is beginning to bite. Bank lending growth to firms and households has weakened considerably (Chart 13). Although higher rates are probably not the only driver of this (some unwinding of the large build-up in lending to companies in early 2022 appears natural), they likely contributed to lower loan demand. We expect this to continue amid prospects of more rate hikes and further evidence of a loss of momentum in activity which is visible in PMI data. Manufacturing is, at 42.7, well into contractionary territory and services, at 51.1, less expansionary. Our GDP forecasts (0.7 % for 2023 and 1.2% for 2024) envisage positive but below-potential growth well into next year.
Chart 13: Bank lending to firms and households is now barely expanding
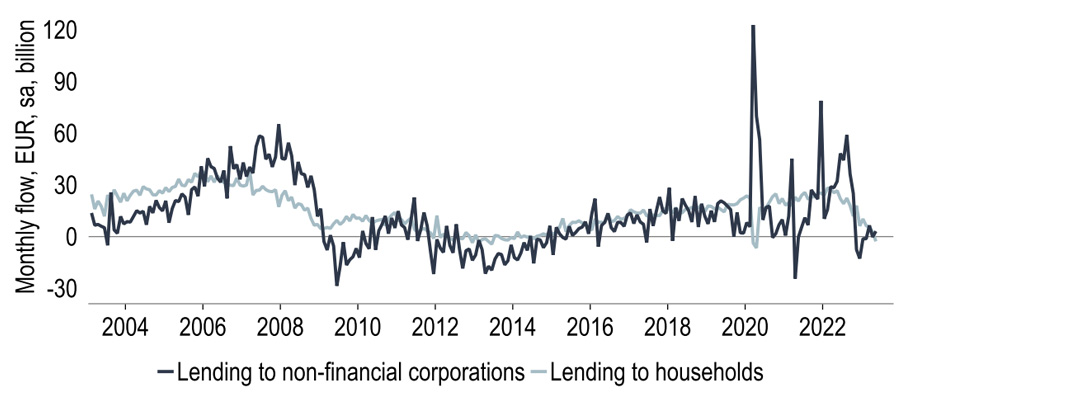
Note: Lending figures shown are adjusted for loan sales, securitisations and notional cash pooling
Source: ECB, Investec Economics, Macrobond
Acting in the same direction are numerous encouraging signs from consumer price data that weaker pipeline pressures are starting to bear down on inflation. On a headline basis, the peak in HICP inflation was reached in October 2022, at 10.6%; the latest (June) reading is much lower, at 5.5%. Admittedly, the bulk of this is due to a partial unwinding of the energy price spike, along with some easing in food price inflation (Chart 14). But progress is also visible in the ‘core’ measure (ex food, energy, alcohol and tobacco): its peak was 5.7% in March, and it is now 5.5%. Within that, it is goods price inflation that has taken a turn for the better, its annual rate having dropped by 1.3%pts so far.
Chart 14: Inflation is heading in the right direction, driven by multiple factors
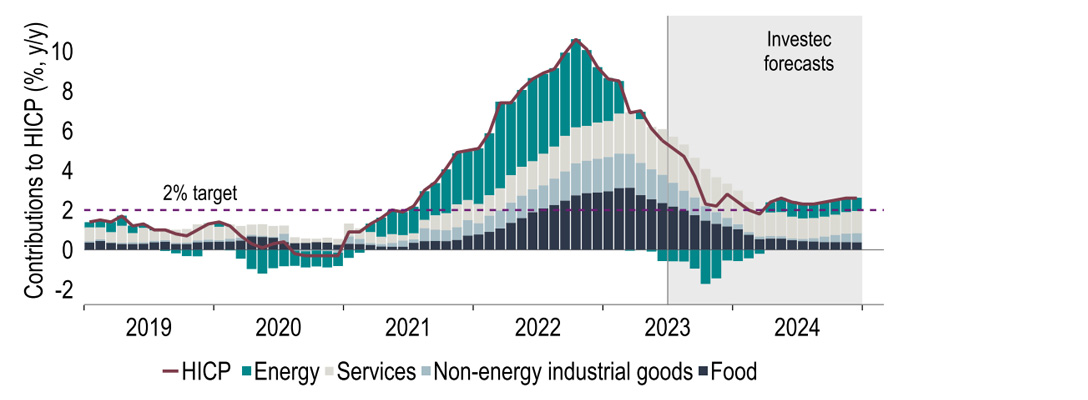
Source: Eurostat, Investec Economics, Macrobond
But will this be sustained and sufficient? An important missing ingredient for a lasting return of inflation to target is lower service price inflation. So far, evidence for this is scant. The volatility in services prices is high on a monthly basis, and it is not yet clear that the trend is slowing. In all likelihood, the ongoing tightness in the jobs market, and therefore the associated upward pressure on wages, has contributed to this. According to a European Commission survey, labour shortages have eased a little in industry and construction but remain historically high (Chart 15). Just how far one can expect wage growth to fall in these circumstances remains unclear.
Chart 15: Labour shortages remain rife according to a European Commission survey
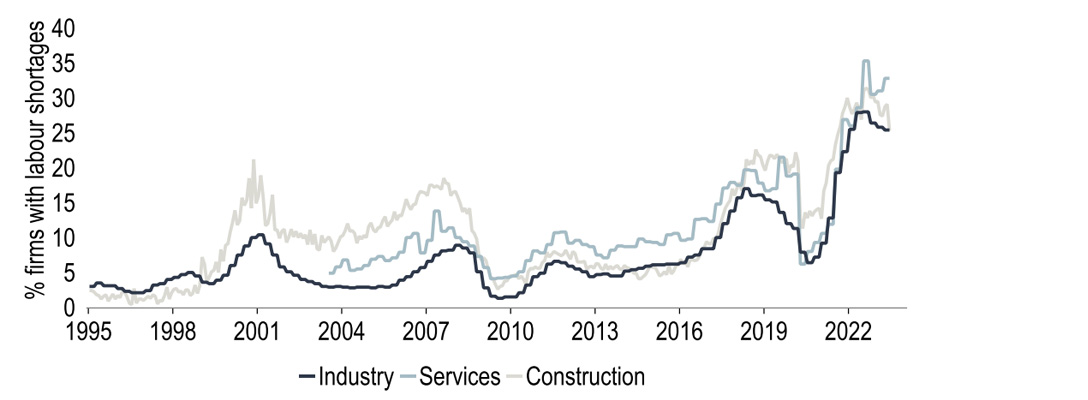
Source: European Commission, Investec Economics, Macrobond
That said, wage growth itself need not be inflationary at the consumer level if it is matched by productivity growth and/or margin compression for companies. One way to track this is to decompose the GDP deflator – a broader measure of inflation that tracks core HICP inflation well – into unit labour costs (wages adjusted for productivity), profits & taxes. As Chart 16 shows, the rise in inflation to date reflects a mix of higher wages, weaker labour productivity growth and higher unit profits. The hope is that in a subdued growth environment, unit profits will fall back and compensate for some of the strength in wages. Typically profits move with the cycle, although there are no guarantees.
Chart 16: Profits have played an increasing role in driving up inflation
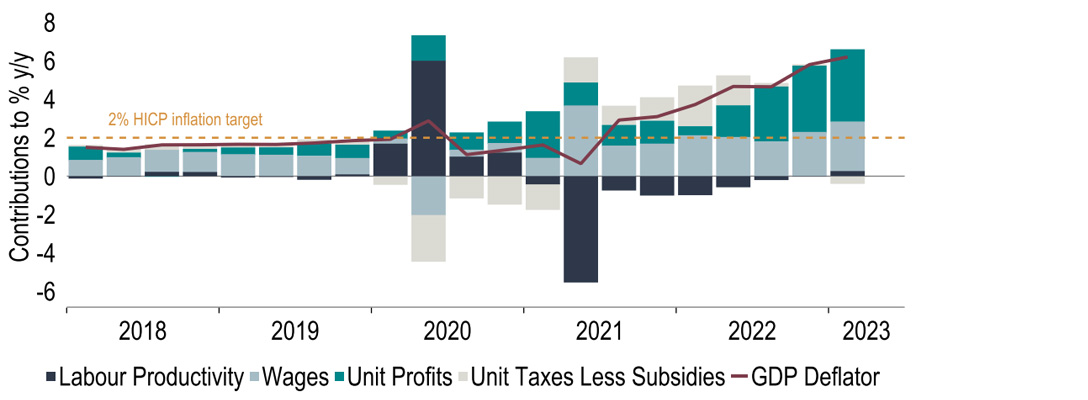
Source: Eurostat, Investec Economics, Macrobond
The ECB was still cautious in its June Staff Projections, predicting another steep fall in inflation in H2 2023 but then a stabilisation around 3% in 2024 (before further declines in 2025). To us, the profile for 2024 looks too pessimistic; we forecast inflation to approach 2% already early next year (though not quite holding at target on a sustained basis; Chart 17). Even Klaas Knot, one of the most hawkish Governing Council members, appears to be coming round to a similar view. This has strengthened our conviction that the Deposit rate will peak at 3.75%. The ECB will no doubt stress data dependency rather than firmly commit to this. But softer data may well allow a pause in September that could then turn out to be prolonged.
Chart 17: Inflation is projected to fall considerably further – will it approach 2% in 2024?
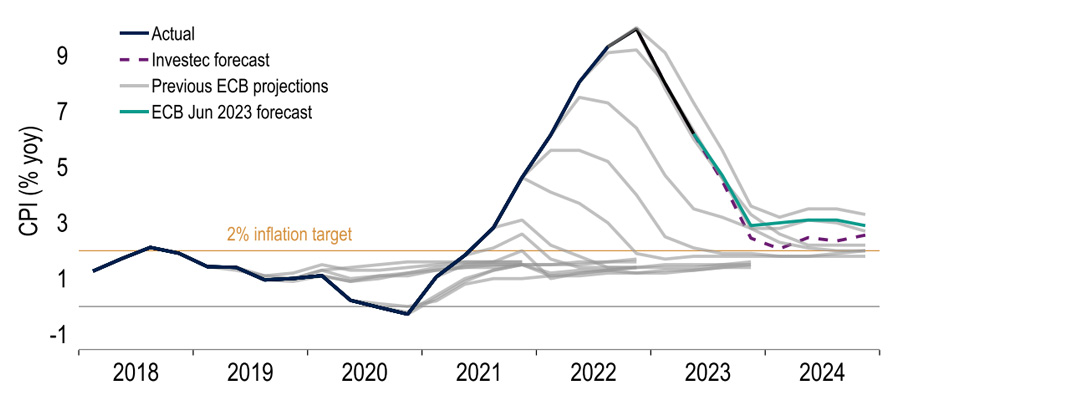
Source: ECB, Investec Economics, Macrobond
When it comes to the single currency, our view has been for some time that the US dollar would come under pressure once its advantage from rate differentials faded, and that the Euro would be among the counterparts to that. This story appears to have played out recently. We are not convinced there is more to come by the end of this year (our EURUSD target remains $1.12) but we see a further move by end-2024 (to $1.15). An extra factor that may have aided the Euro over the past year is the rebound in the current account balance, in turn largely reflecting goods trade and, within that, energy, as energy prices and demand have eased. Although not always a key driver, at times the valuation of the Euro appears broadly related to external trade (Chart 18).
Chart 18: The swings in goods trade, largely on energy, may have influenced the Euro
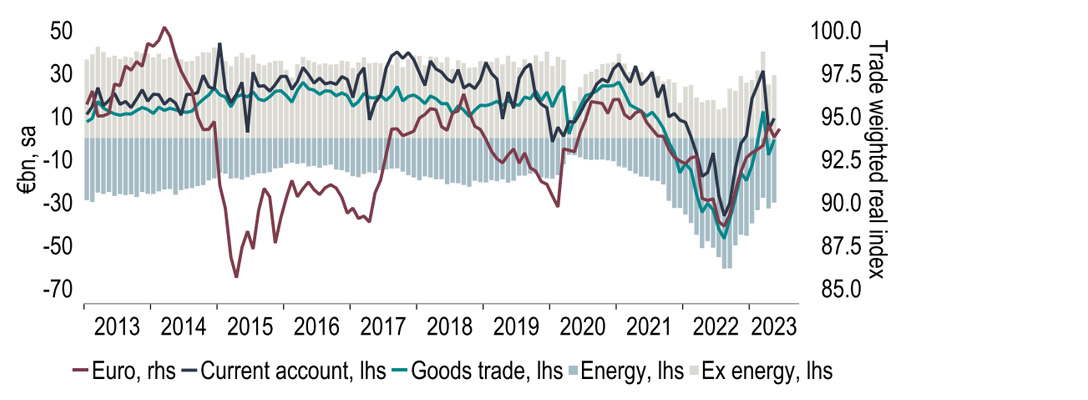
Source: Eurostat, ECB, Investec Economics, Macrobond
United Kingdom
After a four-month run of hotter-than-expected CPI prints June’s report finally brought with it better news on the inflation front. Headline inflation fell by 0.8%pts to 7.9%, below consensus. Although lower fuel prices were a key driver of the fall in the headline measure, there were signs of underlying price pressures easing too, with the core measure* falling back, albeit more modestly. At 7.9%, headline inflation is now back on the path projected by the BoE in May with significant downward pressures on inflation still in the pipeline. Yet the BoE is unlikely to call an end to the fight on inflation yet, with services inflation, although slightly lower in June, still sticky (Chart 19).
Chart 19: Has services price inflation peaked?
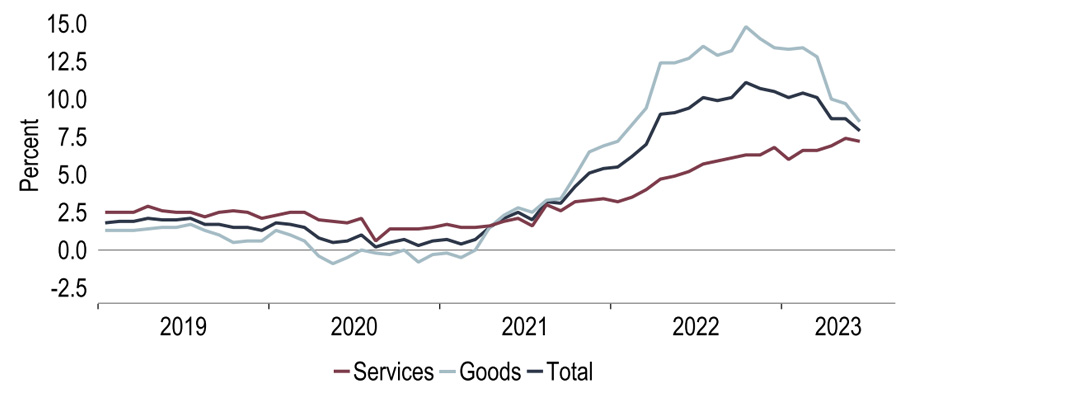
*Core measure excludes food, energy, alcohol & tobacco
Source: Investec Economics, Macrobond
That in part reflects the fact that the bulk of the business expense for many service providers is labour costs, which continue to move up in the UK. Indeed, although there are some signs that the labour market is softening (the unemployment rate ticked up in May) that is yet to be reflected in wage growth, with private sector regular pay growth up once again, to 7.7% (yoy 3mma). On net there was not a big market reaction to this nuanced labour report; the larger moves were in response to a soft US inflation print the next day. This halted the previous sharp scaling up in interest rate expectations (at one point markets were pricing in a peak Bank rate of c.6.75%) and drove a change in course, illustrating how sensitive UK interest rate markets are to any news on inflation; domestic or global.
Chart 20: UK interest rate market volatility has been the key theme in July
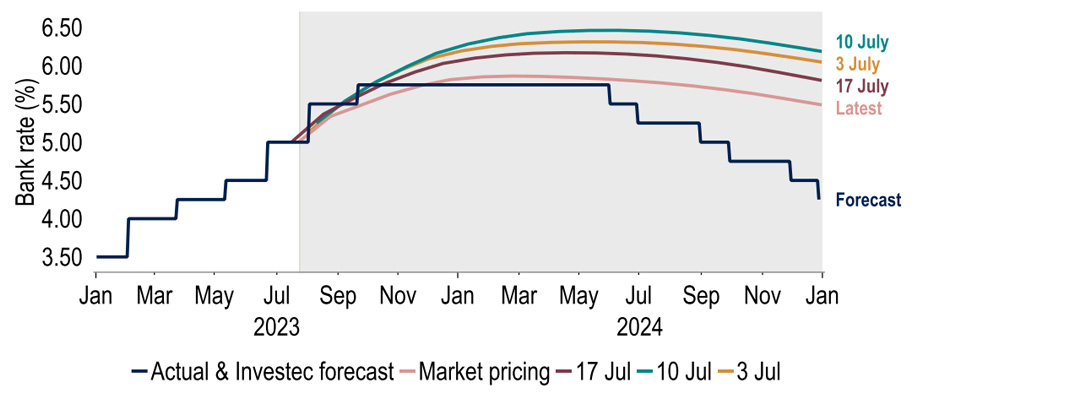
Source: Investec Economics, Macrobond
Given the outsized reaction to US CPI, a 30bps fall in UK 2Y swap rates following the soft(ish) UK figure for June is less surprising. Markets are currently pricing in a peak Bank rate of below 6.00%, which is closer to our own call of 5.75% (50bp hike in Aug, 25bp in Sept). Our view is that inflation will continue to fall, ending ‘23 at 4% and that the economy will enter a recession in H2. There are various channels which look set to depress economic momentum, one of those being via higher mortgage costs. The latest BoE FSR* estimated that the c.800k households rolling off fixed rate deals in H2 ‘23 will see on average a £220 rise in monthly interest payments. In addition, many renters may face higher rents.
Chart 21: Mortgagors face far higher fixed rates, but don’t forget about the hit to renters too

*Financial Stability Report
Source: Investec Economics, Macrobond
The FSR not only discussed the stresses facing households, but also the financial system. The recent sharp shift up in rate expectations raised concerns over the resilience of the financial system, particularly after last year’s LDI crisis revealed the unexpected impacts large daily movements can have. The FSR noted however that LDI funds are now far more resilient than they were pre-Sept’22 and that UK major banks are well capitalised. One lingering concern though regards commercial real estate. CRE valuations have fallen by over 20% in the past year, but the FSR downplayed the wider financial risk. Smaller UK lenders have more exposure to CRE, but nearly 70% of this is to the stronger ‘residential CRE’. Larger banks that are more concentrated in the troubled office and retail CRE space meanwhile have been found to be able to withstand a 45% fall in CRE values in stress tests.
Chart 22: CRE-related debt stands at 12% of GDP, will sharp falls compromise financial stability?
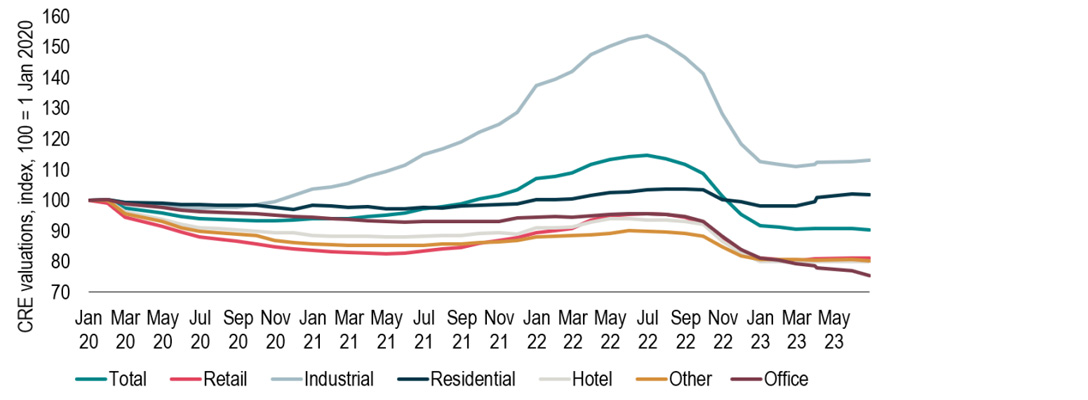
*Investment in large residential complexes is classified as CRE
Source: Investec Economics, Macrobond
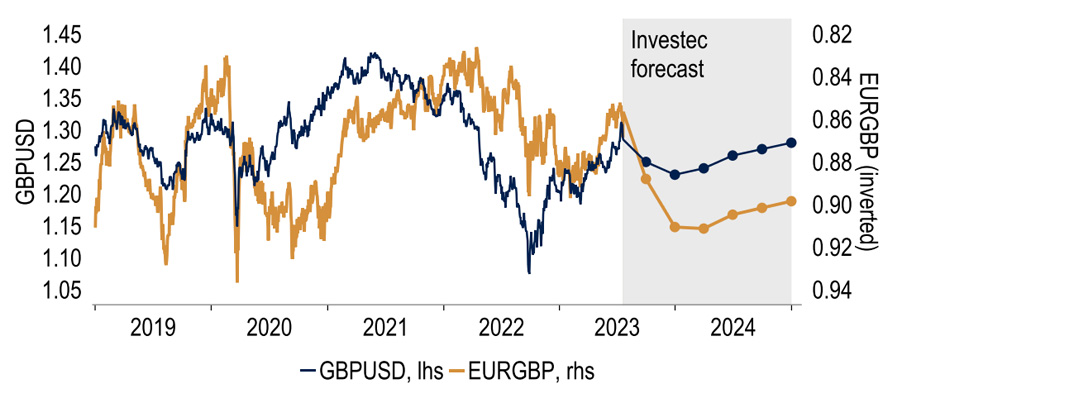
Market participants do still seem to be concerned about the UK economic outlook however, with gains in sterling tempered by fears that higher rates will induce a harder landing. Helped by a weaker dollar, cable did manage to peak over $1.31, but then quickly slipped again as markets reassessed the interest rate outlook. Looking ahead we expect weaker sterling over H2. Although markets have moved more into line with our peak Bank rate call, we think the first rate cut will be earlier than markets expect, in May 2024. If we are correct, then an anticipation of prompter cuts should weigh on sterling.
Chart 23: As interest rate cuts come into view, sterling struggles
Source: Investec Economics, Macrobond
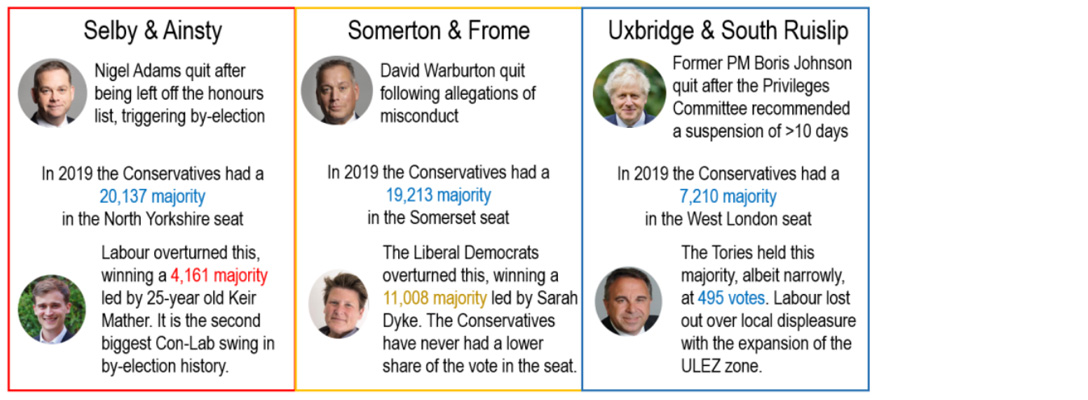
We expect end-year cable at $1.23, and end-2024 at $1.28. This is a long way from the $1.03 hit during the Liz Truss era, which reinforced the importance of fiscal responsibility. With the Tories having just suffered two by-election losses, there is an obvious incentive to provide large fiscal giveaways to help shore up support as the next election looms. However, the government is very constrained by the thin fiscal headroom. Rumours have been circling that Chancellor Hunt may scrap inheritance tax, a cheaper option than the previously rumoured income tax cut. But this would benefit far fewer people and is unlikely to be an election winner as the Tories trail around 20 points in the polls.
Chart 24: Tories cling on to Uxbridge & South Ruislip but deep losses in other two by-elections
Source: Investec Economics, Macrobond
Get more FX market insights
Stay up to date with our FX insights hub, where our dedicated experts help provide the knowledge to navigate the currency markets.
Browse articles in
Please note: the content on this page is provided for information purposes only and should not be construed as an offer, or a solicitation of an offer, to buy or sell financial instruments. This content does not constitute a personal recommendation and is not investment advice.