A number of cranes in the sky

Global Economic Overview – March 2024

Philip Shaw, Ryan Djajasaputra, Ellie Henderson and Sandra Horsfield | London Economics team

Household income is increasing as inflation declines, and central banks are getting ready to cautiously implement monetary easing measures. The economy is experiencing robust growth, with interest rate reductions in the pipeline.

Global Economic Overview - March 2024 PDF 1.57 MB
Summary
Global

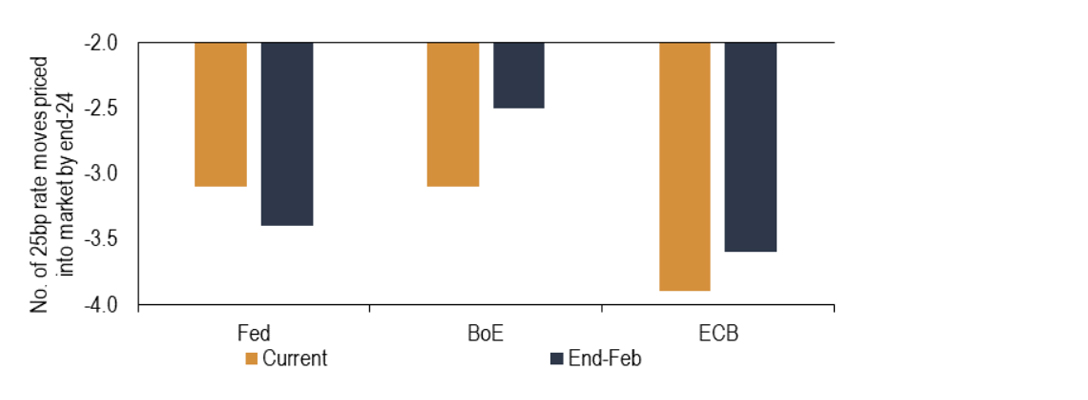
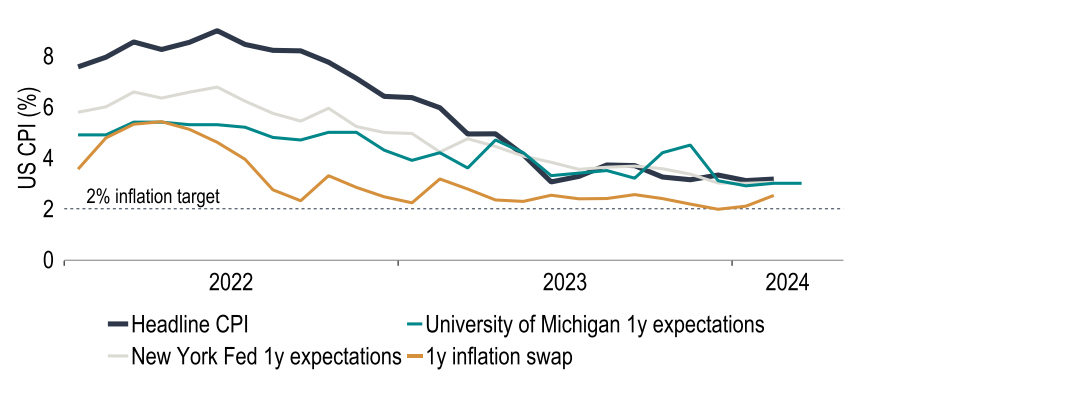
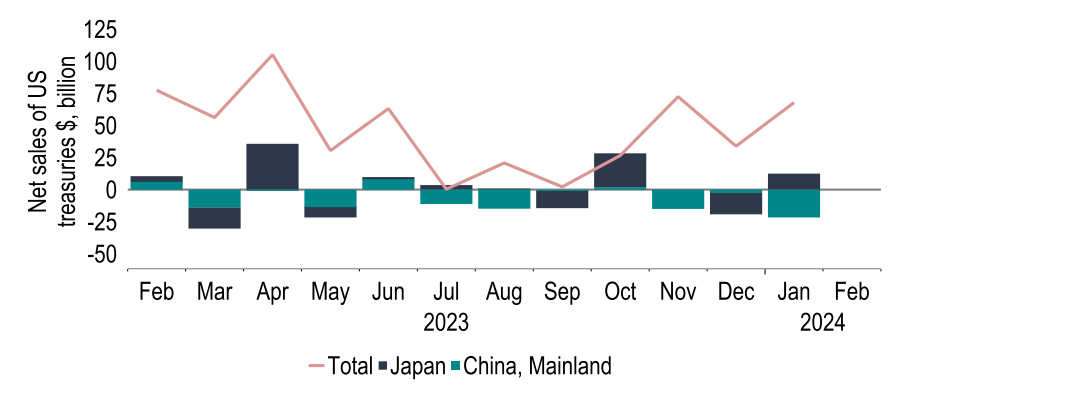
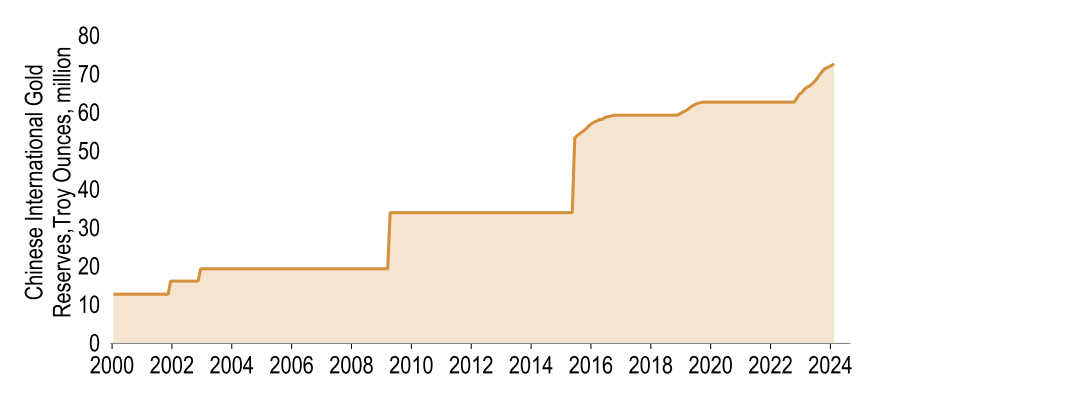
Interest rates in developed markets have been less volatile and more nuanced over the past month, pricing in a little more easing from the ECB and BoE this year but less from the Fed. Although the US economy has remained remarkably buoyant, falling inflation expectations have pushed real interest rates upwards, increasing the restrictiveness of policy and providing a case for lower policy rates at some stage. Against the grain, the Bank of Japan raised interest rates back into positive territory. We wonder whether this process may begin to result in Japanese buyers ‘reshoring’ their financial assets. China already appears to be a net seller of US Treasuries and a greater buyer of gold, and this sort of reserve diversification could put downward pressure on USD at some stage and possibly upward pressure on Treasury yields.

United States

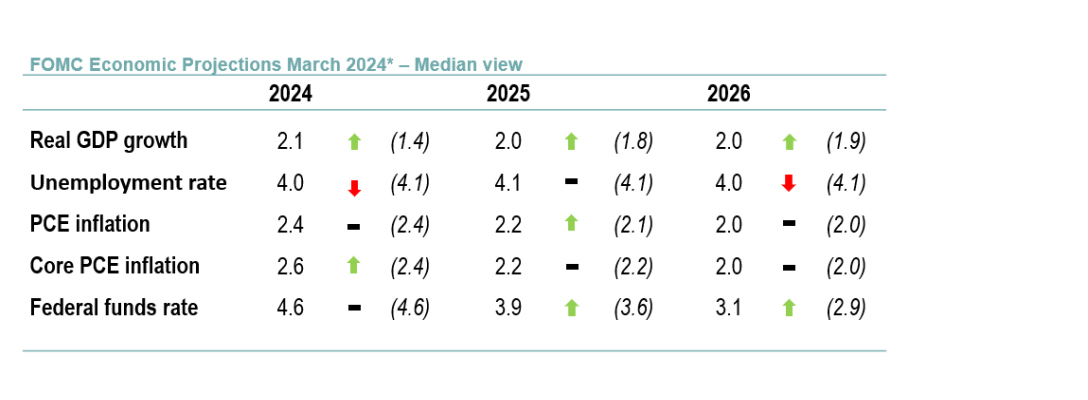
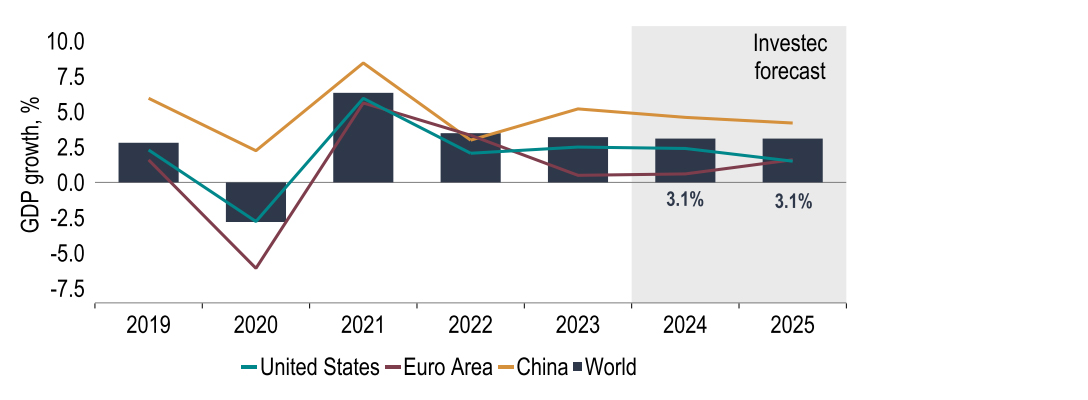
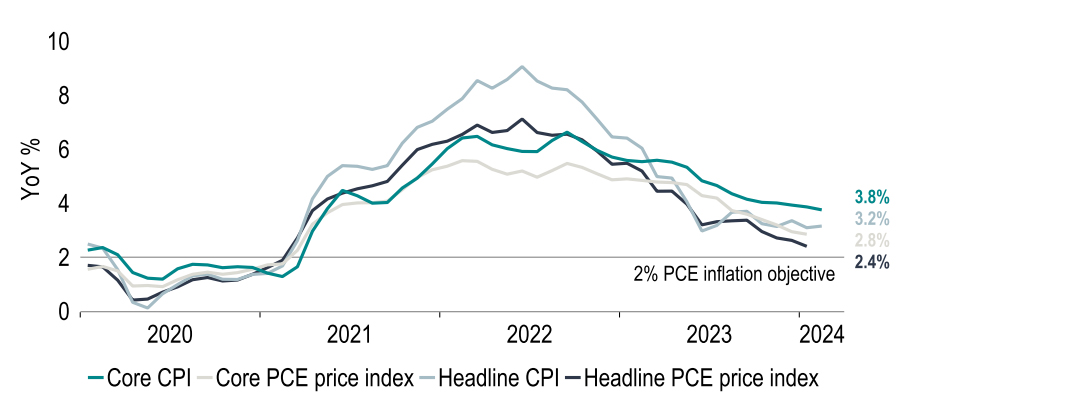
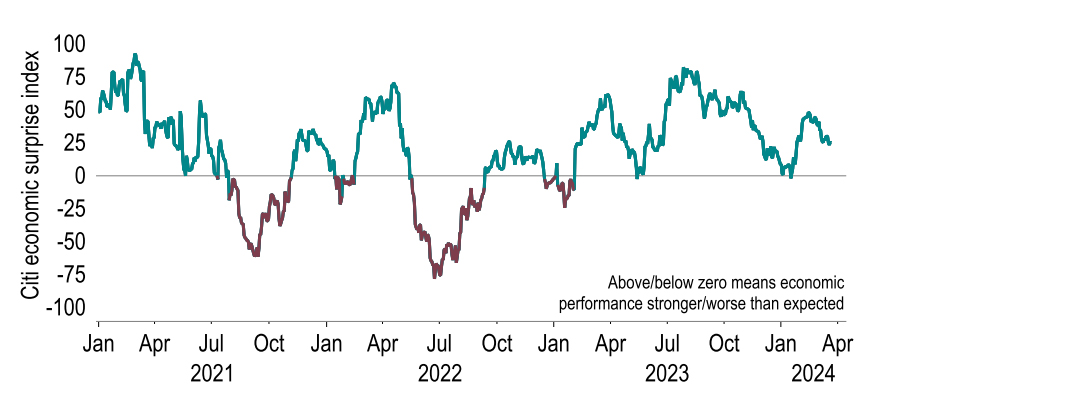
The latest FOMC meeting saw rates held steady once again. But the updated forecasts demonstrated that the committee still believes that several interest rate cuts will be appropriate this year. This is despite the Fed’s growth forecasts having been revised higher. Indeed, given recent robust data we have lifted our own forecasts slightly too, to 2.4% this year (prior: 2.3%) and 1.5% next (prior: 1.4%). This is a Goldilocks scenario for the Fed: inflation has made progress towards 2%, but the economy has performed well. The Fed will be mindful though that if monetary policy exerts too much pressure on the economy through rising real rates, the situation could quickly change, sending inflation below the 2% target and unemployment higher. As such, we maintain our view for three interest rate cuts this year, starting from June.  

Eurozone

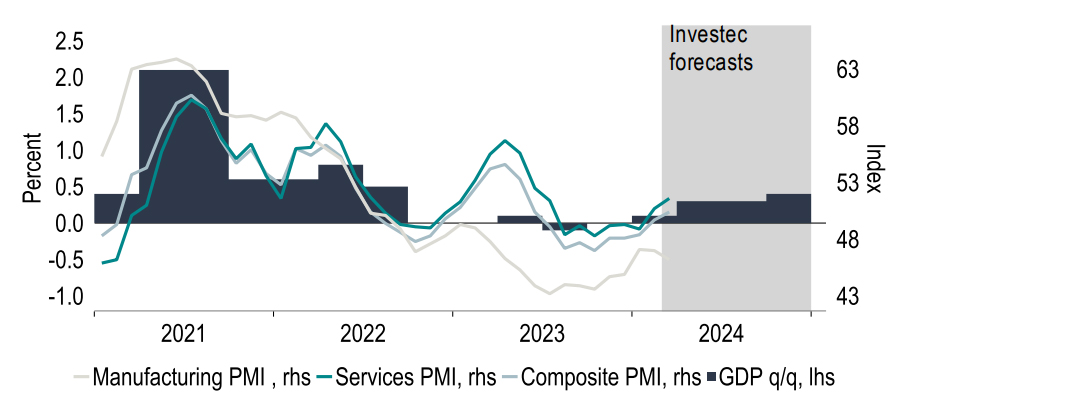
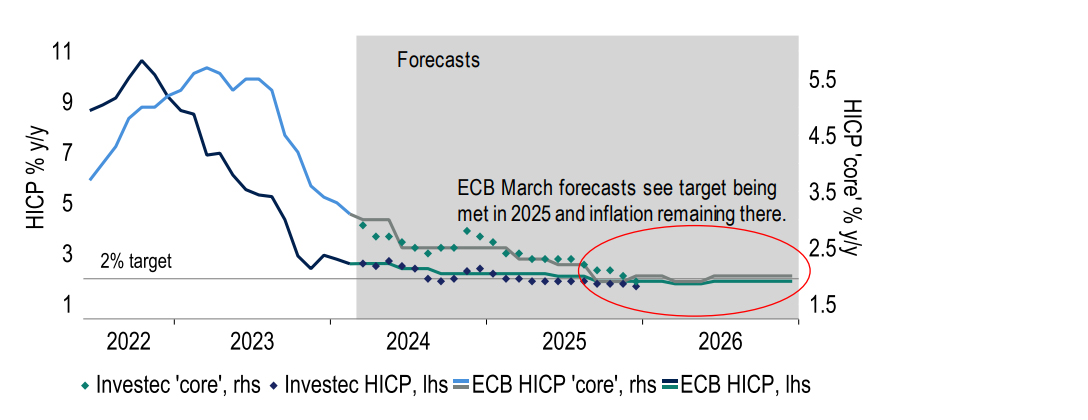
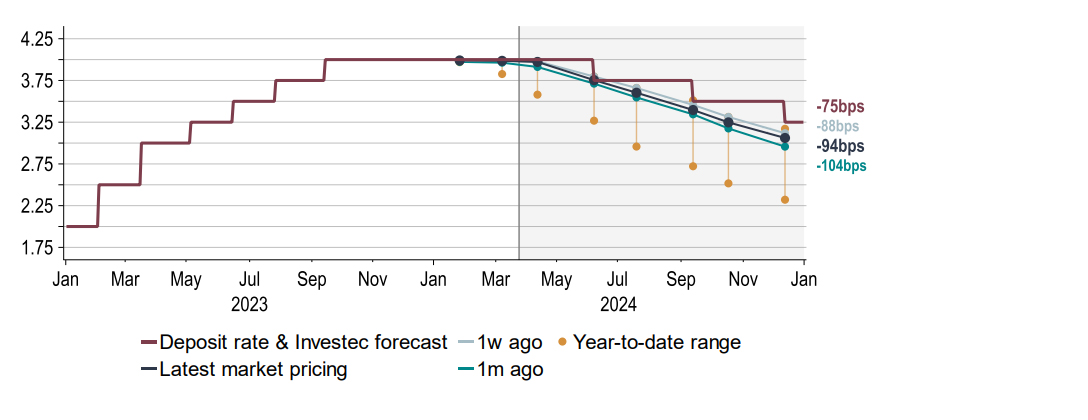
Euro area economic activity at the start of 2024 has remained subdued. But indicators are showing some improvement, which should see quarterly GDP growth turn positive in Q1. This largely aligns with our baseline views, hence our GDP forecasts for both 2024 and 2025 remain unchanged at 0.6% and 1.6% respectively. Our baseline view for ECB policy also remains as before, namely for a first 25bp cut in the Deposit rate in June. Our conviction in this call has been strengthened by the March ECB meeting and subsequent comments from the Governing Council, which have left little doubt over the prospects of a June rate cut. We expect two further rate reductions across the rest of the year, which would leave the Deposit rate at 3.25% in December.

United Kingdom

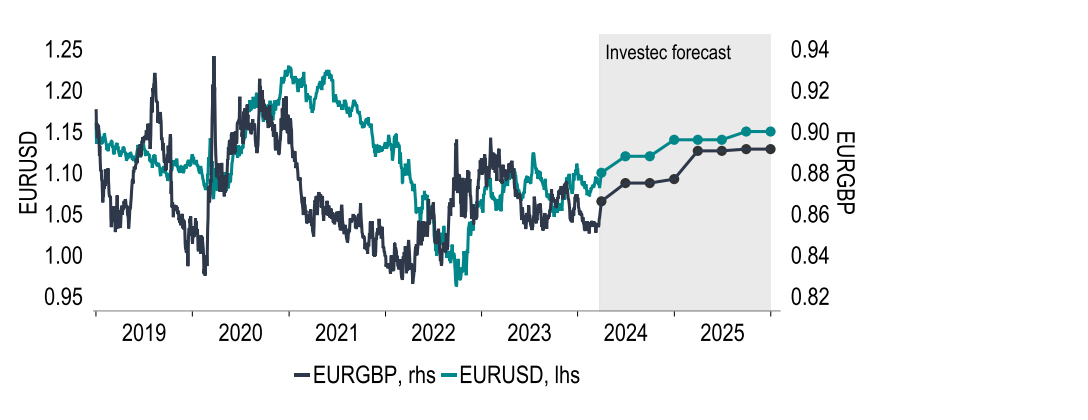
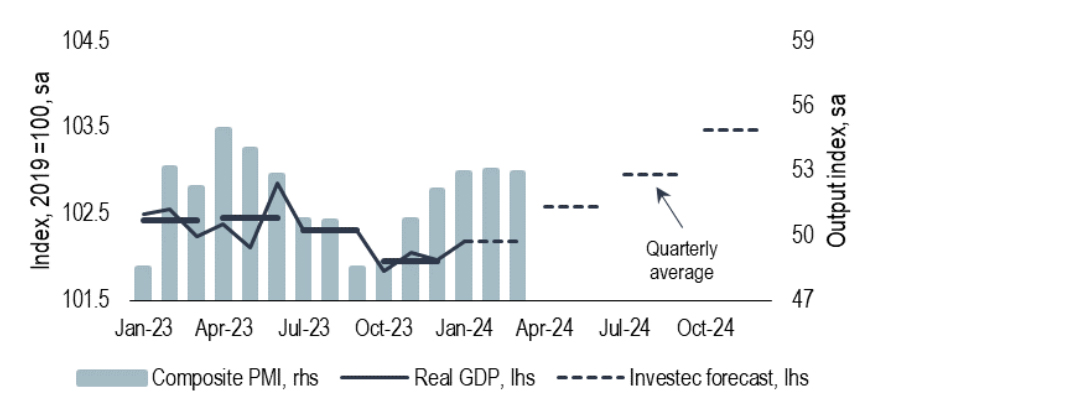
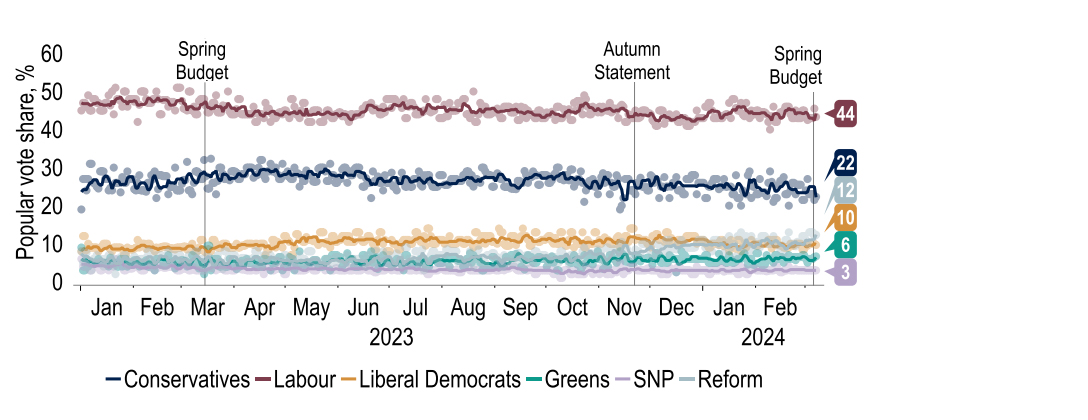
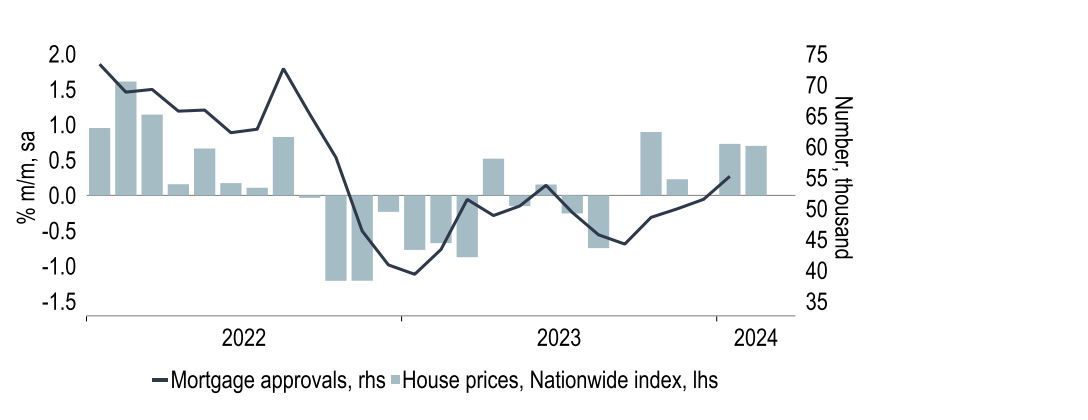
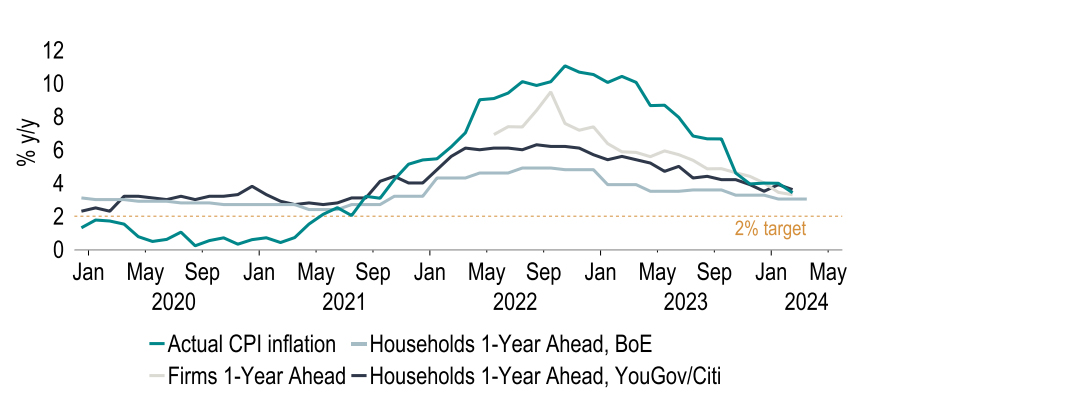
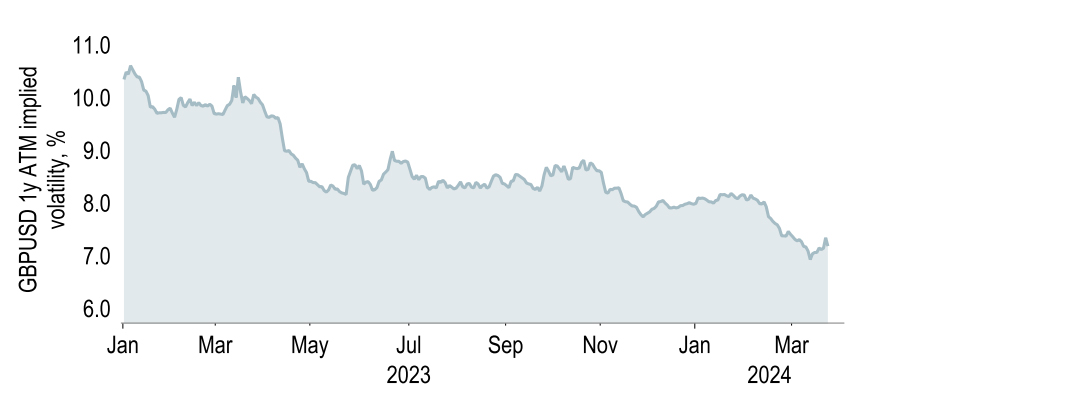
Recent data leave us comfortable with our view that the UK economy already emerged from recession during Q1. Our GDP growth forecasts are unchanged at 0.5% for ‘24 and 1.8% for ‘25. A key support is stronger real household disposable income growth, reflecting a mix of now above-inflation wage growth and National Insurance Contribution cuts. The latter do not seem to have lifted the Tories’ poll ratings, although there is yet time for another fiscal event pre-election if so desired. The Conservatives will also hope for rate cuts soon. Prospects of this seem good: not only is inflation itself falling, but inflation expectations too are receding. We continue to forecast a first rate cut in June, with 75bps of rate reductions in total this year and more to come in 2025. For GBP, we predict a small further rise against USD (end ’24: $1.30, end ’25: $1.29).

Read the full commentaries

  • Global

    Despite the current era of short-term interest rate and bond market volatility in developed markets, (net) changes in implied policy rates have been relatively modest in March so far. Moreover shifts in rate cut expectations in individual economies have been more nuanced than usual. In contrast with market rallies in the eurozone and the UK, implied Fed rates at the end of the year have firmed, albeit marginally (Chart 1). The US has typically led turns in global monetary policy cycles, but this will not prevent other central banks such as the ECB from acting before the FOMC if appropriate. In this context, Governing Council member Olli Rehn remarked recently that the ECB was not ‘the Fed’s 13th District’.

    Chart 1: Less Fed easing priced in this year, more from the ECB and the BoE (-ve indicates cut)

    Chart 1: Less Fed easing priced in this year, more from the ECB and the BoE (-ve indicates cut)

    Source: Bloomberg, Investec Economics

    The rationale for easing policy in economies at or near recession is simple. But a less obvious justification for cutting rates exists when economies are relatively buoyant. Policy rates are at 15 to 20-year highs. But in terms of monetary policy effects, what matters is real not nominal rates and as inflation (or rather, inflation expectations) declines, the degree of policy restrictiveness increases, which exerts an ever-greater dampening impact on the economy and price pressures. In such situations rates may need to be brought down to prevent policy from becoming excessively tight although admittedly, measures of inflation expectations vary, so precise policy prescriptions are not clear.

    Chart 2: US CPI inflation and measures of 1y inflation expectations – all have come down

    Chart 2: Cargo has been rerouted to avoid the Red Sea, adding to delivery times and costs

    Source: Macrobond, Bloomberg, Investec Economics 

    The US economy, which seems to be defying gravity, is such an example. In its latest projections (see US section), the FOMC sees growth averaging 2.0% in 2026, with inflation also falling to 2.0%. But this is conditioned on policy easing, without which (if the Fed is correct) its inflation target would be undershot and its full employment objective perhaps not met. Each economy will have its specific conditions which central banks must take into account. For example, as we wrote last month, the Fed needs to determine the extent to which strong payroll growth is a function of greater labour supply, including that from immigration. But in very broad terms, central banks are aware of the need to lower policy rates at some stage, given falling inflation environments.

    Chart 3: FOMC forecasts – Inflation gets to 2% - risk of undershoot if rates do not come down?

    Chart 3: FOMC forecasts – Inflation gets to 2% - risk of undershoot if rates do not come down?

    *GDP, unemployment and PCE are Q4 of year indicated. Federal funds rate projections are for end-year.  (Numbers in brackets are the December 2023 projections)Source: Federal Reserve, Investec Economics 

    One definitive policy move was made by the Bank of Japan earlier this month, albeit in the other direction. The BoJ raised rates for the first time in 17 years, lifting its policy balance rate from -0.10% to a range of 0.0%-+0.1%. It gave little in terms of guidance looking ahead, but markets continue to price in further hikes over 2024. One question is whether a period of positive Japanese rates (albeit barely at the moment), results in a shift in capital flows, via a repatriation of funds into domestic assets. Japan is the largest overseas holder of US Treasuries and in contrast with China, was a net buyer in 2023. A switch back into yen assets could have major implications for the USD and Treasuries.

    Chart 4: Net overseas buying of US Treasuries – China selling, Japan still buying (for now)

    Chart 4: Net overseas buying of US Treasuries – China selling, Japan still buying (for now)

    Source: Macrobond, Investec Economics

    A different type of change in asset preference seems to be a live issue with Chinese investors. Data from the PBoC show that while China has been reducing its stock of US Treasuries, its gold holdings have been rising at a greater pace. Indeed the spot gold price recently reached an all-time high of $2200. This might sound counterintuitive, while although geopolitical tensions remain acute, interest rates globally are well above zero and inflation has subsided. Reserve diversification of this type does not necessarily spell the demise of the USD as the world's reserve currency. Nonetheless this could signal lower demand for dollars that results in a softer greenback over the medium-term.

    Chart 5: Chinese gold buying has accelerated recently

    Chart 5: Chinese gold buying has accelerated recently

    Source: Macrobond, Investec Economics

    China enjoyed a better set of activity data at the start of the year with manufacturing expanding by 7.7% on a year earlier in Jan/Feb, partly due to telecoms and computers. But this does not appear to be a gamechanger in terms of the broader outlook and the new official GDP growth target of ‘around 5%’ still looks challenging. With the notable exception of India, manufacturing in most other large economies continues to face headwinds, in part due to destocking. We continue to expect that this will weigh on the global economy, despite signs that services are starting to recover and thus feel little need to reconsider our view of global prospects. Our world growth forecasts are 3.1% for this year and next, barely changed from 3.0% and 3.1% last month.

    Chart 6: Global growth – outlook still looks subpar over 2024 and 2025

    Chart 6: Global growth – outlook still looks subpar over 2024 and 2025

    Source: Macrobond, Investec Economics

  • United States

    The latest Federal Reserve meeting saw the Fed funds target range held at 5.25-5.50% for the fifth consecutive meeting, as expected. The accompanying statement was virtually identical to January’s. The biggest change was to the Fed’s GDP forecasts this year, with Q4 GDP revised up to 2.1% (y/y) from 1.4% previously. Equity markets seemed to rally on the fact that despite the stronger growth outlook, the median view on the committee was still for three 25bp cuts this year. We would note though that the dots did shift higher (Chart 7) – the median was only just for three cuts this year.

    Chart 7: Median view on Fed remains for three 25bp cuts this year, but the dots have moved up

    Chart 7: Median view on Fed remains for three 25bp cuts this year, but the dots have moved up

    Source: Federal Reserve, Investec Economics

    The endgame for Quantitative Tightening (QT) was also discussed, with the general view on the committee being that a slowing of QT would begin ‘fairly soon’. Although Powell would not be drawn into a specific start date, the median view in the Fed’s January Primary Dealer survey was for a slowing in the pace of runoff to begin in June. What the Chair did stress though was that the Fed will learn from the mistakes from the last time it attempted QT in 2017-19. Despite believing reserves in the system were more than ample, liquidity in overnight money markets turned out to be materially tighter than expected in Sep 2019, causing a spike in overnight rates. The Fed will want to avoid a repeat of this.

    Chart 8: The Fed is keen to learn from the mistakes of 2019 – stop before it breaks

    Chart 8: The Fed is keen to learn from the mistakes of 2019 – stop before it breaks

    Source: Macrobond, Investec Economics 

    Chair Powell explained that one reason for the upward revision to GDP was the strength of labour supply. In our last Global we discussed whether migration has played a part in the strong economic data. Since then a paper by the Brookings Institute has estimated that due to higher immigration, potential employment growth could be between 160k and 200k this year without adding pressure to the labour market that would push up wages. Prior to the pandemic this was estimated around 60-140k. But measuring the gain in non-farm payrolls in a timely fashion is difficult, with large revisions now commonplace (Chart 9). As part of the Feb release, Dec and Jan combined were revised down by 167k, meaning the labour market was not as hot as first thought.

    Chart 9: Large revisions cast doubt over reliability of initial (and second!) NFP releases

    Chart 9: Large revisions cast doubt over reliability of initial (and second!) NFP releases

    Source: BLS, Investec Economics

    Another key development has been stronger-than-expected inflation data for February. PPI inflation came in at 1.6%, exceeding consensus of 1.1%, driving 10y UST yields around 10bps higher. Meanwhile, the last three CPI inflation reports have also exceeded expectations. This naturally intensifies concern over whether progress on inflation has stalled, particularly as CPI inflation has failed to break below 3% after hitting it in June. In our view the journey to 2% was always going to be bumpy and it is possible that seasonal factors (not captured by the seasonal adjustment) explain some of the beats. The Fed doesn’t seem concerned, Chair Powell stating that the prints “haven’t really changed the overall story”.

    Chart 10: Is inflation getting stuck above 2% (probably not)?

    Chart 10: Is inflation getting stuck above 2% (probably not)?

    Source: BLS, BEA, Macrobond, Investec Economics

    Our base case remains for a first cut in June, followed by two further 25bp moves this year. There is the risk though that the US economy continues to outperform, questioning how restrictive policy actually is, and whether rates need to be maintained at current levels for longer. We have upgraded our GDP forecasts marginally, now pencilling in growth of 2.4% this year and 1.5% next (prior: 2.3% & 1.4%). Although the restrictive stance of monetary policy still seems set to cool the economy, it is shaping up to be a remarkably soft landing. If this Goldilocks scenario plays out globally, the result should be ‘risk-on’ on global markets, reducing the USD’s safe haven allure.

    Chart 11: The US economy has near consistently outperformed expectations

    Chart 11: The US economy has near consistently outperformed expectations

    Source: Citi, Macrobond, Investec Economics 

    A key risk to our FX forecasts relates to the US election. After reaching the required delegates, Biden will once again take on Trump on 5 Nov. Considering recent polling suggests that US voters would trust Trump over Biden on the economy, a key question is how policies differ. Biden intends to boost spending, extend tax credits to certain households and continue to deliver on his Inflation Reduction Act. Meanwhile Trump has pledged to cut taxes further, increase oil production and impose more protectionist measures, such as a universal 10% tariff on imports. On balance, a Trump presidency is likely to be more fiscally expansive. If the GOP were to get a clean sweep of Congress, then this could result in an upside risk to our UST yield forecasts on fiscal concerns.

    Chart 12: Biden seen more jobs added than predecessors, but Trump polling better on economy

    Chart 12: Biden seen more jobs added than predecessors, but Trump polling better on economy

    Source: BLS, Macrobond, Investec Economics

  • Eurozone

    Data since the start of 2024 have largely supported our baseline view for a return to expansion in Q1, albeit at a still subdued pace (+0.1% q/q). Surveys have provided some context, the March Composite PMI rising to a nine-month high of 49.9. Manufacturing has seen slower declines. But in an indication that easing inflation pressures and an improving household income backdrop are supporting a pickup in activity, it is services that have led the way, the PMI recording a second consecutive reading above the 50 level at 51.1. Assuming this improvement continues and aided further by the prospect of falling interest rates we forecast GDP growth of 0.6% in 2024 and 1.6% in 2025, an unchanged estimate.

    Chart 13:  Surveys point to some pickup in activity at the start of 2024

    Chart 13: Surveys point to some pickup in activity at the start of 2024

    Source: Macrobond, Investec Economics

    At 2.6% y/y, February’s inflation outturn was the lowest - other than a temporary energy-driven dip in November - since 2021. The disinflationary trend is also visible in core HICP inflation, which has fallen to 3.1%. This progress in realised inflation towards target has been one factor easing ECB worries over inflation. So too has been the outlook, with the updated staff projections released alongside March’s meeting seeing inflation returned to target in 2025: both headline and core HICP are forecast at 1.9% in Q3. Could the SNB offer a hint of what is to come? Its own updated set of projections that forecast inflation meeting its price stability target helped trigger a surprise 25bps cut in rates this month.

    Chart 14:  ECB staff projections see the 2% inflation target being met next year

    Chart 14:  Wage growth remains elevated, but there are signs of an easing

    Source: Macrobond, Investec Economics 

    The message from the ECB this month has been clear: it is moving towards lower rates, just ‘not yet’. Comments since the March Governing Council (GC) meeting have left no doubt over the prospect of a June rate cut. Could the ECB cut earlier, at the April meeting? The consensus among the GC appears to be that there will be insufficient data by then, but that by June there will. The specific focus is wage data, the majority of which will not be released until May. With the latest data showing a slowdown to 4.6%* in Q4 and the ECB’s wage tracker also pointing to easing wage pressures ahead, we judge that the burden of proof now lies with reasons not to cut. Our Deposit rate view is unchanged, that being for a first cut in June and ending 2024 at 3.25%.

    Chart 15:  Market Deposit rate pricing now looks more aligned with our views

    Chart 15:  Market Deposit rate pricing now looks more aligned with our views

    *Compensation per employee figures     
    Source: Macrobond, Investec Economics

    March has also seen the publication of the ECB’s framework review. This will have a limited impact on monetary policy near-term but does lay out the GC’s future plans for controlling interest rates. This will include an evolution of the floor-driven system which has existed since 2015 when the ECB began flooding the system with liquidity, pinning overnight rates to the Deposit rate. This new system will represent a combination of a floor and a demand-led component. The former will be underpinned by structural bond and credit operations designed to provide the bulk of the system’s liquidity, partly to ensure there is no detrimental impact on banks’ regulatory ratios*. The latter will provide the marginal levels of liquidity, steered by a narrower rate corridor**. 

    Chart 16:  Excess levels of reserves have created a floor-based system for rates since 2015

    Chart 16:  Excess levels of reserves have created a floor-based system for rates since 2015

    ECB estimates have suggested that excess liquidity (reserves held at the ECB over and above minimum reserve requirements) make up c.60% of banks HQLAs used in LCRs. ** From 18 September 2024 the spread between the Main refinancing rate and Deposit rate will be reduced to 15bps, from 50bps currently.                                                                                                                                     
    Source: Macrobond, Investec Economics

    The future for monetary policymaking may be clearer, yet for wider politics it is not. The results of the recent Portuguese General Election provided another example of the success of the far/populist right. The Chega party came third behind the centre-right/right wing AD and the centre-left PS with 50 of the 260 seats. With neither mainstream group gaining an overall majority, Chega finds itself in a potential ‘kingmaker’ position. AD leader Luis Montenegro was appointed PM by President Rebelo, but with the PS refusing to co-operate in the AD’s Budget, Montenegro may be forced to turn to Chega for support, despite his previous insistence to the contrary. Various Euro area countries could find themselves in similar situations over the next few years.

    Chart 17:  Portuguese elections see large gains for the far/populist right wing Chega party

    Chart 17:  Portuguese elections see large gains for the far/populist right wing Chega party

    Source: Expresso, Flourish, Investec Economics 

    EURUSD continues to see low levels of volatility. We expect to this to continue, albeit within some firming in the euro, to 1.14 against USD by the end of this year. The market is pricing in 90bps of interest rate cuts from the ECB this year which we think is a touch overdone relative to our view of 75bps, which should be euro supportive. Growing positive risk sentiment as global disinflation continues and world growth strengthens could be a headwind to the dollar too. However, one risk is that the Fed delays an easing in rates, which would be dollar positive and a downside risk to our EURUSD view. We see EURGBP at 88p by the end of this year, and 89p end of next.

    Chart 18: The euro trading range continues to see little volatility 

    Chart 18: The euro trading range continues to see little volatility

    Source: Macrobond, Investec Economics

  • United Kingdom

    Recent ‘hard’ and survey data leave us very comfortable with our call that the UK’s recession will prove as short-lived as it was shallow (Chart 19). GDP expanded by 0.2% m/m in January. Therefore, even with zero monthly growth in February and March – unlikely in our view, given the supportive backdrop to household real disposable incomes from above-inflation wage growth and January’s 2p NIC* cut – GDP would be on track to have exited recession already in Q1. The additional employee NIC reductions announced at the Spring Budget to kick in from April will also add to growth from Q2. But their expected impact will not be large (0.5% of GDP). Our GDP growth forecast for 2024 remains unchanged at 0.5% (2025:1.8%).

    Chart 19:  We see plenty of signs that the UK emerged from recession already as of Q1 2024

    Chart 19:  We see plenty of signs that the UK emerged from recession already as of Q1 2024

    *National Insurance Contribution    
    Source: ONS, S&P Global, Macrobond and Investec Economics

    Nor is there much sign that the NIC cuts have delivered a marked turn in the polls in the Tories’ favour (Chart 20). No doubt taking this into consideration, PM Sunak has ruled out calling a general election to coincide with the local elections on 2 May. The latest date by which a general election must be held is 28 Jan ’25, giving the government leeway, should it so wish, to fit in one more pre-election fiscal event – in the hope that by then the economic outlook has improved by more than the OBR currently predicts and that fiscal ‘headroom’ for more impactful tax cuts increases. The OBR put the latter at just £8.9bn after the Spring Budget, the second lowest margin (ex pandemic) since the OBR was established in 2010.

    Chart 20:  Only few polls to go by, but a post-Budget bounce for the Tories still looks elusive

    Chart 20:  Only few polls to go by, but a post-Budget bounce for the Tories still looks elusive

    Source: Europe Elects, Macrobond and Investec Economics 

    A further factor the government must be hoping for, that could reflect well on its (post-Truss) stewardship of the economy would be BoE rate cuts. The mere anticipation of lower policy rates – and hence the fall in swap and mortgage rates – has already led mortgage approvals and house prices somewhat higher, the latter now having risen in five out of the last six months as per Nationwide figures (Chart 21). Certainly, the popular narrative frames lower interest rates and higher house prices as desirable for households and as likely vote-winners. (We may quibble the former is less clear-cut when taking net savers into account and the latter when considering affordability for first-time buyers.) 

    Chart 21: Mortgage approvals and house prices have started to rise again as rates have fallen

    Chart 21: Mortgage approvals and house prices have started to rise again as rates have fallen

    Source: Bank of England, Nationwide, Macrobond and Investec Economics

    To deliver rate cuts, the MPC will want reassurance that inflation is on its way back to target – and that inflation expectations are falling with it. On both of these, the evidence is reassuring. CPI inflation has dropped to its lowest level since Sep 2021. As Governor Bailey acknowledged, much of that owes to lower energy prices, unwinding the previous adverse terms of trade shock. This is helpful not only for lowering inflation, but in time should bring about some recovery in production for energy-intensive parts of industry. Unsurprisingly, these had been especially hard-hit, holding back GDP (Chart 22).  

    Chart 22:  Energy-intensive industrial production has weighed on UK GDP growth in ’22 and ‘23

    Chart 22:  Energy-intensive industrial production has weighed on UK GDP growth in ’22 and ‘23

    Source: ONS, Macrobond and Investec Economics

    More recently, though, lower energy (and food) prices are no longer the only drivers of lower inflation: even the sticker core service price component is now 1.4%pts below its peak (although, at 6.0%, still too high). Meanwhile, inflation expectations, for both households and firms, are receding (Chart 22). This lowers the likelihood of entrenched above-productivity wage growth and thereby the risks of inflation persistence. It also directly affects the ex-ante real interest rate factored into borrowing and lending decisions. As inflation expectations slide, the appropriate policy rate does too. We continue to forecast a first rate cut in June and 75bps of rate reductions in total by the end of ’24, with more to follow in ’25. Market pricing has now largely, although not fully, converged to this profile as well.

    Chart 23:  Reassuringly, inflation expectations have declined as actual inflation has fallen

    Chart 23:  Reassuringly, inflation expectations have declined as actual inflation has fallen

    Source: ONS, Bank of England, YouGov/Citi, Macrobond and Investec Economics 

    Relative to February, GBP appears to have awakened to the possibility of some volatility again in March, but only a tad. One reason for the rangebound trading is that there is little divergence in expected interest rate paths priced in between the UK and the US over the coming year, a view with which we broadly concur. Yet, we do see the pound firming to $1.30 by end-‘24. This is based on our view that the UK economy will see a pickup in activity which, relative to our view of a slowing US economy, would be supportive of the pound. And unlike in the US, there are fewer risks around the election for the currency, with the policies proposed by Labour so far continuing the status quo. By end-’25 we foresee GBPUSD at $1.29.

    Chart 24: Some (slight) volatility in GBP ahead?

    Chart 24: Some (slight) volatility in GBP ahead?

    Source: Macrobond, Bloomberg, Investec Economics

Global Economic Overview - March 2024 PDF 1.57 MB

For more information contact our economists

Get more FX market insights

Stay up to date with our FX insights hub, where our dedicated experts help provide the knowledge to navigate the currency markets.

Read more on the global economy

Please note: the content on this page is provided for information purposes only and should not be construed as an offer, or a solicitation of an offer, to buy or sell financial instruments. This content does not constitute a personal recommendation and is not investment advice. 

  • Disclaimer

    For the purposes of this disclaimer, “Investec Securities” shall mean: (i) Investec Bank plc (“IBP”); (ii) Investec Europe Limited; (iii) Investec Bank Limited (“IBL”); (iv) Investec Capital Asia Limited (“ICAL”); (v) Investec Capital Services (India) Private Limited; (vi) Investec Singapore Pte. Ltd (“ISPL”) and from time to time, in relation to any of the forgoing entities, the ultimate holding company of that entity, a subsidiary (or a subsidiary of a subsidiary) of that entity, a holding company of that entity or any other subsidiary of that holding company, and any affiliated entity of any such entities. “Investec Affiliates” shall mean any directors, officers, representatives, employees, advisers or agents of any part of Investec Securities. This document has been issued solely for general information and should not be considered as an offer or solicitation of an offer to sell, buy or subscribe to any securities or any derivative instrument or any other rights pertaining thereto. This document may have been issued to you by one entity within Investec Securities in the fulfilment of another Investec Securities entity’s agreement to do so. In doing so, the entity providing this document is in no way acting as agent of the entity with whom you have any such agreement and in no way is standing as principal or a party to that arrangement.

    The information in this document has been compiled by Investec Securities from sources believed to be reliable, but neither Investec Securities nor any Investec Affiliates accept liability for any loss arising from the use hereof or makes any representations as to its accuracy and completeness. Any opinions, forecasts or estimates herein constitute a judgement as at the date of this document. There can be no assurance that future results or events will be consistent with any such opinions, forecasts or estimates. Past performance should not be taken as an indication or guarantee of future performance, and no representation or warranty, express or implied is made regarding future performance. The information in this document and the document itself is subject to change without notice. This document as well as any other related documents or information may be incomplete, condensed and/or may not contain all material information: its accuracy cannot be guaranteed. There is no obligation of any kind on Investec Securities or any Investec Affiliates to update this document or any of the information, opinions, forecasts or estimates contained herein. Investec Securities (or its directors, officers or employees) may, to the extent permitted by law, act upon or use the information or opinions presented herein, or research or analysis on which they are based prior to the material being published. Investec Securities may have issued other documents or reports that are inconsistent with, and reach different conclusions from, the information presented in this document. Those reports and/or documents reflect the different assumptions, views and analytical methods of the analysts who prepared them. This document does not contain advice. Specifically, it does not take into account the objectives, financial situation or needs of any particular person. Investors should not do anything or forebear to do anything on the basis of this document. Before entering into any arrangement or transaction, investors must consider whether it is appropriate to do so based on their personal objectives, financial situation and needs and seek financial advice where needed. No representation or warranty, express or implied, is or will be made in relation to, and no responsibility or liability is or will be accepted by Investec Securities or any Investec Affiliates as to, or in relation to, the accuracy, reliability, or completeness of the contents of this document and each entity within Investec Securities (for itself and on behalf of all Investec Affiliates) hereby expressly disclaims any and all responsibility or liability for the accuracy, reliability and completeness of such information or this document generally.

    The distribution of this document in other jurisdictions may be prohibited by rules, regulations and/or laws of such jurisdiction. Any failure to comply with such restrictions may constitute a violation of United States securities laws or the laws of any such other jurisdiction. By accepting this document, you confirm that you are an "institutional investor" and agree to be bound by the foregoing limitations. This publication is confidential for the information of the addressee only and may not be reproduced in whole or in part, copies circulated, or disclosed to another party, without the prior written consent of an entity within Investec Securities. In the event that you contact any representative of Investec Securities in connection with receipt of this document, including any analyst, you should be advised that this disclaimer applies to any conversation or correspondence that occurs as a result, which is also engaged in by Investec Securities and any relevant Investec Affiliate solely for the purposes of providing general information only. Any subsequent business you choose to transact shall be subject to the relevant terms thereof. We may monitor e-mail traffic data and the content of email. Calls may be monitored and recorded. Investec Securities does not allow the redistribution of this document to non-professional investors or persons outside the jurisdictions referred to above and Investec Securities cannot be held responsible in any way for third parties who effect such redistribution or recipients thereof.