Finger stopping dominos from falling any further

Global Economic Overview – May 2024

Philip Shaw, Ryan Djajasaputra, Ellie Henderson and Sandra Horsfield | London Economics team

Read Investec’s monthly Global Economic Overview for our latest forecasts for the global economy – including GDP growth, interest rates and FX.

Global Economic Overview - May 2024 PDF 1.53 MB
Summary
Global

Optimism about 2024 US growth prospects has risen since mid-2023. More recently, consensus forecasts for EU20 and UK GDP growth have also moved up. Even so, we expect their central banks to begin cutting rates before long – the ECB as soon as next month, the BoE in August (post election purdah period) and the Fed in September. This is due to lower inflation, which can be expected to feed into lower inflation expectations too. Helpful in cutting inflation has been that China’s export prices, and thereby others’ import prices, have declined, amid a strategy to push manufacturing as a driver of Chinese growth. We are mindful of the risk rising protectionism could pose, but this is hard to quantify for now. Margin compression may become a negative for stocks; yet stronger growth and lower rates are positive.

United States

The main message from the last FOMC meeting was that the Fed was not prepared to reduce interest rates anytime soon. That followed hotter-than-expected data that raised fears that it could take longer for inflation to return to the 2% target. But we maintain our view that a first policy rate cut could be as soon as September. There are tentative signs of a loosening in the jobs market and PCE inflation has been making progress towards target. The fairly resilient economic backdrop may result in the FOMC taking the more scenic route to ‘neutral’ though, stopping to assess the impact on the real economy on its way down. We now see an end-‘25 Fed funds target range of 4.00-4.25% (prior: 3.75%-4.00%). As rate cuts become a reality, we expect the greenback to soften, pencilling in EURUSD at $1.12 for end-‘25.

Eurozone

The ECB has left little doubt that it intends to cut policy rates from June, playing down the latest rise in negotiated wage growth. The path of rate cuts thereafter is more open. Our expectation is that wage growth will trend down, helping to cut services inflation. Amid a recovery in GDP (our ’24 GDP growth forecast has been raised to 0.8% and ’25 kept at 1.7%), this should allow the ECB to proceed along a gradual path of lowering rates by 25bps at each quarterly staff projection meeting this year and next. But June is not only an important month for monetary policy: next month the European Commission will set out fiscal adjustment plans for countries deemed to be in excessive deficit, and the European parliamentary elections could engender a shift to the right, with potential repercussions for EU policymaking.

United Kingdom

With a UK general election now set for 4 July, the Conservatives trail Labour by 20% plus in the polls, despite the fact that the economy has now officially escaped from recession and that inflation, at 2.3%, has fallen very close to the 2.0% target. This gap might narrow and recent elections have shown the Tories outperforming pre-election polls. Even so, Labour could well be heading towards a huge majority. Most domestic markets (currency options were a modest exception) took little notice of Mr Sunak’s election announcement. We have changed our rate call, partly due to firm data on the services CPI and pay but also because, by convention, the Bank of England declines to make public statements in election periods, making it difficult to explain a rate cut on 20 June. We now expect the first Bank rate cut to take place in August (not June), bringing our end-‘24 target to 4.75% from 4.50% previously.

Read the full commentaries

  • Global

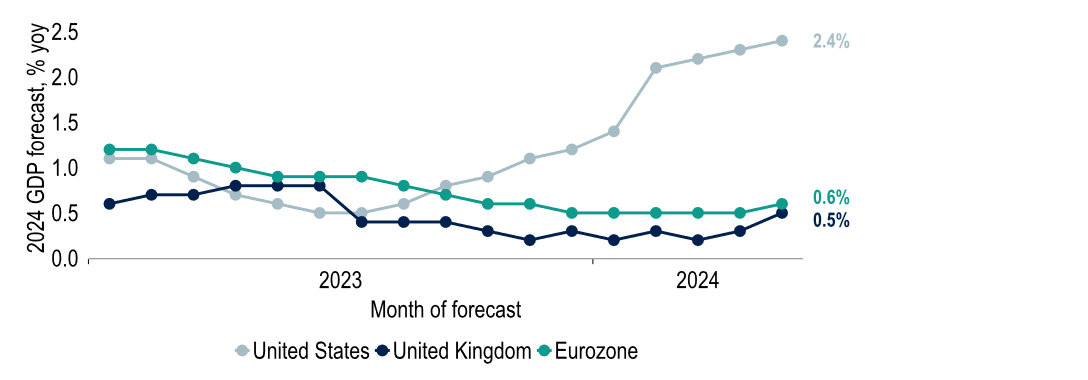
    Judging by consensus forecasts, optimism about US GDP growth prospects in 2024 has been rising continually since mid-2023. Strong data outturns have played an important part in this, not only providing helpful base effects in a purely mathematical sense but also signalling a greater degree of resilience and momentum that has been incorporated into forecasts. By contrast, optimism on Europe’s growth initially faltered: as evidence of shallow technical recessions in H2 ’23 emerged in both the EU20 and the UK, consensus 2024 growth forecasts were downgraded. Yet amid surprisingly strong GDP outturns for Q1 2024, consensus full-year growth forecasts for the Eurozone and the UK have moved higher lately (Chart 1).

    Chart 1: Consensus 2024 GDP growth forecasts have risen – and not just in the US

    Chart 1: Consensus 2024 GDP growth forecasts have risen – and not just in the US

    Source: Consensus Economics, Investec Economics

    Our own 2024 GDP growth predictions are a little higher than the consensus: for the US, we predict 2.5%, for the Eurozone 0.8% and for the UK 1.0%. For 2025, we expect a cooling in US growth (1.6%) but stronger momentum in the EU20 (1.7%) and the UK (1.8%). For China, meanwhile, we have pencilled in growth of 5.0% and 4.2%, after 5.2% in 2023. To achieve this, in light of the ongoing property developers’ crunch and associated funding challenges for local governments, China is priming its manufacturing output pump. This has resulted in falls in Chinese export prices, helping to pull down import prices elsewhere and therefore contributing to disinflation in the major developed economies (Chart 2).  

    Chart 2: Lower Chinese export prices have reduced import prices elsewhere – is this changing?

    Chart 2: Lower Chinese export prices have reduced import prices elsewhere – is this changing?

    Source: IMF, China GAC, BLS, ECB, ONS, Investec Economics and Macrobond 

    An open question is though whether Chinese export price levels are now rising again. Data on this, from the IMF, only extend until Dec 2023, but splicing on some Chinese year-on-year figures that run until April hints at a subsequent rise. We are yet to be convinced of the accuracy of that estimate, though, not least because metals prices, an important industrial input, have generally risen strongly since the start of the year (Chart 3). To us, this is likely to have partly reflected demand growth for raw materials by Chinese manufacturers. If their production is being ramped up, we would expect Chinese producers to remain aggressive on pricing, at least for the time being, to maintain global demand for their output.

    Chart 3: Metals prices are generally up visibly since the start of the year, perhaps due to China

    Chart 3: Metals prices are generally up visibly since the start of the year, perhaps due to China

    *China iron ore price, Tianjin port; rest: LME USD price   Source: LME, MySteel, Investec Economics, Macrobond

    Certainly, at present, global trade flows look more encouraging than they have been for some time (Chart 4). That fits with the less negative tone to manufacturing PMI indicators too. That said, this nascent recovery is facing headwinds from mounting trade tensions. The US is raising tariffs on $18bn of certain Chinese goods (incl. lithium-ion batteries, semiconductors and electric vehicles, as well as steel and aluminium) from 1 Aug, in response to alleged intellectual property theft. The EU will shortly conclude whether to impose tariffs on Chinese EVs too. And China has indicated it would hike its own import tariffs on large combustion-engine vehicles by 25% in response. All this stands to crimp trade and add to import, and ultimately consumer, prices – to what degree though ultimately is yet hard to foresee.

    Chart 4: Global trade indicators are pointing to a nascent recovery

    Chart 4: Global trade indicators are pointing to a nascent recovery

    Source: CPB, RWI, Korea Customs Service, Macrobond and Investec Economics

    When it comes to monetary policy though, this is not (yet?) a key factor. The direction of travel is still towards rate cuts in the major developed economies (except Japan). The latest US inflation figures have been met with some relief and reduced bets that the next move could be a hike. And whereas the announcement of the general election in the UK for 4 July has pushed back the timing when we expect a first rate cut to August, the ECB still looks on track to move in June. In any case, these would not be the first advanced economies to lower policy rates: the Swiss National Bank already cut rates in March and Sweden’s Riksbank did so this month. Many emerging market central banks had moved even sooner than that (Chart 5).

    Chart 5: Advanced economies have now started to cut policy rates too, following the EM lead

    Chart 5: Advanced economies have now started to cut policy rates too, following the EM lead

    Source: National central banks, Macrobond and Investec Economics

    The mix of an improved growth outlook and rate cut expectations – if to a lesser extent than a few months ago – has been helpful for equity markets. The main stock indices globally have rallied, generally posting above-inflation year-to-date price returns (Chart 6). That said, we note that USD year-to-date price returns have not been quite as impressive as local currency returns in many cases, most clearly so in Japan and South Korea. Looking ahead, we wonder whether P/E multiples will come under more pressure if profit margin compression is a driver of further disinflation, as many central bankers appear to hope. Time will tell whether this dominates, or whether this is outweighed by the more positive growth and rates outlook.

    Chart 6: A strong performance in the major equity market indices so far in 2024

    Chart 6: A strong performance in the major equity market indices so far in 2024

    Source: Macrobond and Investec Economics

  • United States

    The overarching message from the latest FOMC announcement was that the Fed was not prepared to cut interest rates anytime soon. That change in tone was driven by a set of hotter-than-expected economic data in the lead up to the meeting, causing concern that it might take longer for inflation to return to the 2% target on a sustainable basis. As confirmed in the minutes, there was even talk around the table about the possibility of a further hike if the risks to inflation persistence did not recede. However, since the last meeting the data has shown some tentative signs of cooling, such as a weaker payroll print and a softer CPI report. This has driven markets to retrace odds of an increase in rates by the end of the year (Chart 7).

    Chart 7: Option pricing suggests markets have pared back probability of rate hike by end-year

    Chart 7: Option pricing suggests markets have pared back probability of rate hike by end-year

    The Atlanta Fed  Market Probability Tracker estimates prob distributions implied by options pricing from the CME that reference the 3m compounded average SOFR. Source: Fed Reserve Bank of Atlanta, Investec

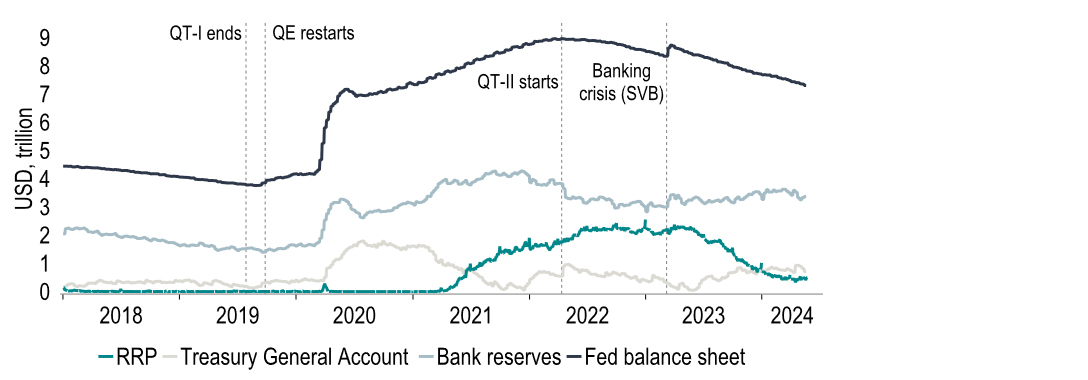
    Although there was no change in interest rates, there was an update on Quantitative Tightening (QT). From June the Fed will slow the pace of balance sheet reduction, with the monthly redemption cap lowered to $60bn (from $95bn). Some questioned whether there is a contradiction in reducing QT, an effective easing in policy (QT lifts yields), whilst stressing the need to maintain the restrictiveness of interest rate policy. Fed Chair Powell has explained though that interest rates are the Fed’s main policy tool, with QT simply working in the background. Moreover, although QT hasn’t quite been like ‘watching paint dry’ as now Treasury Sec Yellen once put it, academic papers have found an only small impact on yields from QT. We think the two can work in tandem.

    Chart 8: Fed to slow the pace of balance sheet reduction from June, but end-point unknown

    Chart 8: Fed to slow the pace of balance sheet reduction from June, but end-point unknown

    Fed’s balance sheet also includes other liabilities.
    Source: Federal Reserve, Macrobond, Investec Economics

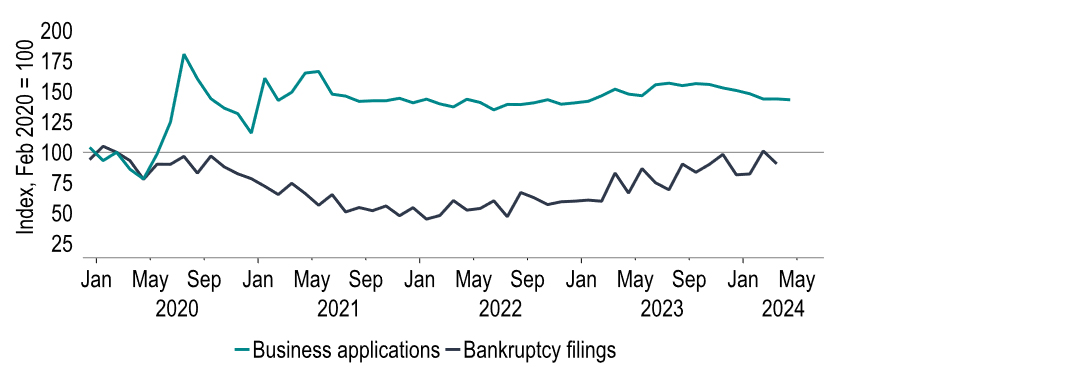
    So where does this leave interest rates? We maintain the view for a first cut in Sep, and from there do not think that the FOMC will need to be aggressive in its easing. Indeed, there are parts of the economy that remain relatively resistant to higher rates, such as business births and deaths. Higher rates make servicing debt more expensive and typically results in an increase in bankruptcies as so-called ‘zombie’ firms can no longer operate without access to cheap credit. Yet bankruptcies are still below pre-pandemic levels (just). The higher cost of investment hasn’t deterred new business growth either. This might help explain the buoyant jobs market and could mean it takes longer to get to the ‘neutral rate’ than we first envisaged.

    Chart 9: High interest rates yet business applications above pre-pandemic, bankruptcies lower

    Chart 9: High interest rates yet business applications above pre-pandemic, bankruptcies lower

    Source: US Census Bureau, US Federal Court, Investec Economics

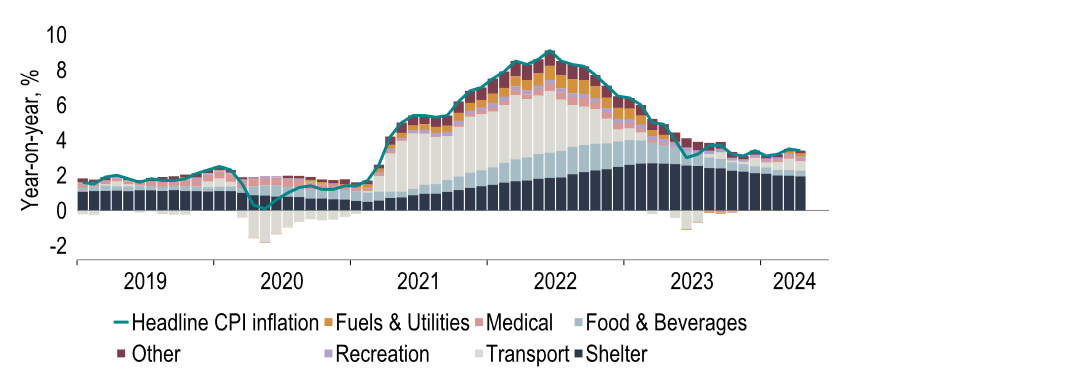
    We now expect three 25bps cuts next year, instead of four. But that does not alter our thinking on the need to reduce the restrictiveness of policy in the near-term. Inflation is making more progress than might be assumed from just looking at CPI inflation, which has been stuck above 3% since Jun’22. As Chart 10 shows, shelter price inflation is a key reason for the stickiness of CPI inflation. But the US CPI measure gives an outsized weight to shelter relative to both the HICP measure that is calculated across Europe (the latter excludes OER*) and the Fed’s targeted PCE inflation measure. Indeed, the BLS publishes a comparable HICP measure which put inflation at 2.4% in March, whilst PCE inflation is at 2.7%. To us, this classifies as progress towards target, opening the door to a cut in September.

    Chart 10: CPI inflation remains sticky due to services, and in particular, shelter inflation

    Chart 10: CPI inflation remains sticky due to services, and in particular, shelter inflation

    *Owners’ Equivalent Rent
    Source: BLS, Macrobond, Investec Economics

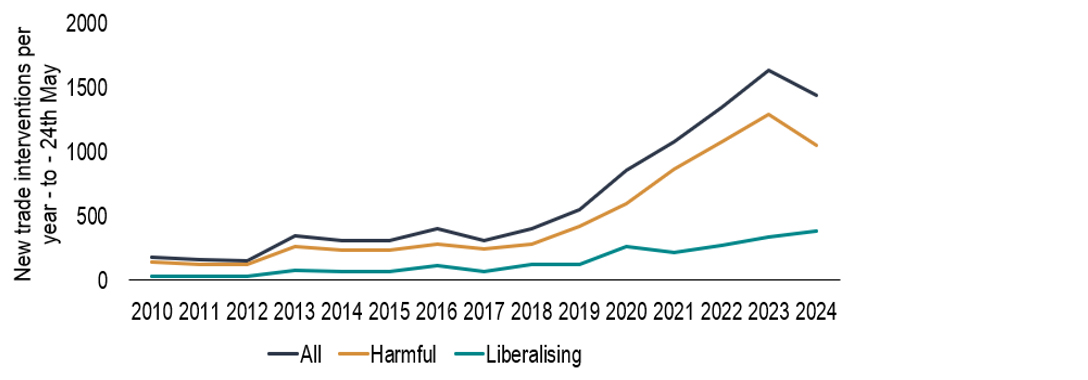
    There are upside risks to the inflation outlook, though. A longer-term risk that has started to crystalise regards deglobalisation. President Biden this month announced further tariff hikes on a raft of Chinese products, including lithium batteries and electric vehicles. But this comes with consequences. As elsewhere, the US has been benefitting from cheaper imports from China, helping goods inflation lower. If more tariffs are imposed, and worst-case scenario, a trade war ensues, there could be a visible impact on inflation. Our current forecasts are conditioned on unchanged policy post-election day, but it does seem that whether it be a Trump or a Biden presidency, trade measures are to stay. The question is how the Fed responds.

    Chart 11: Will liberalising trade measures continue in 2024?

    Chart 11: Will liberalising trade measures continue in 2024?

    Source: Investec Economics, Global Trade Alert

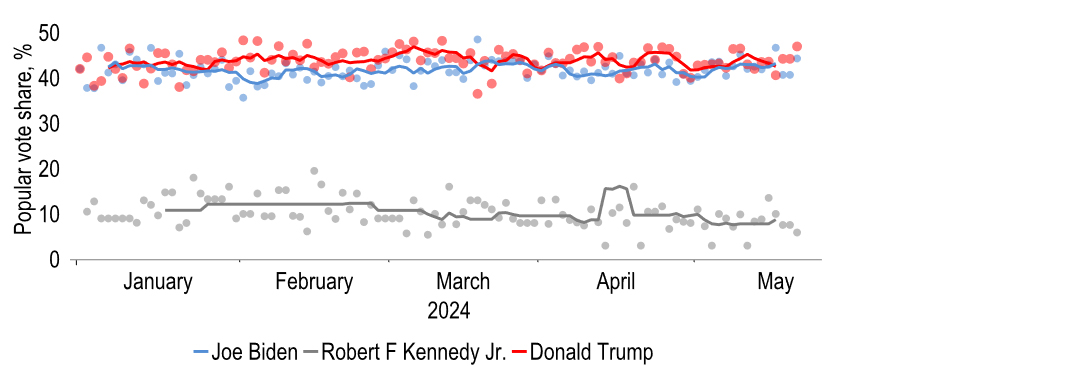
    What impact does inflation have on public sentiment? Typically, the approval rating of the US president is thought to be linked to the economy, although this is a nebulous concept for voters. But where seeing economic growth in real time is difficult, Americans notice rising gasoline prices, having implications for Biden's approval rating and unwelcome ahead of his first debate against Trump on 27 June.  This may not be a one-to-one debate as initially expected, though. Third-party candidate Kennedy is fighting to qualify for the debate, for which he needs support of 15% as well as ballot access to theoretically win 270 electoral votes - a tough feat. But debate aside, with Biden and Trump neck and neck in the polls, Kennedy's rising popularity could steal votes from either side.

    Chart 12: Could support for Robert F Kennedy influence the election outcome?

    Chart 12: Could support for Robert F Kennedy influence the election outcome?

    Source: 538, Macrobond, Investec

  • Eurozone

    An ECB rate cut at the 6 June meeting looks all but certain, this having been primed by the reference to policy easing in April’s statement and the consistent message since from the Governing Council (GC). April’s meeting had even seen a few on the GC call for an easing already. Our baseline is for a 25bp move in the key rates in June, lowering the Deposit rate to 3.75%. Less clear-cut are prospects for the policy rate path thereafter. Previous reports had suggested that some on the GC supported back-to-back declines in June and July. But we believe there is a high bar for this with the majority more in favour of a gradual approach, which we interpret as a cut at each quarterly forecast meeting.

    Chart 13: A June ECB rate cut is priced in, but what happens after that is still up for debate

    Chart 13: A June ECB rate cut is priced in, but what happens after that is still up for debate

    Source: ECB, Macrobond, Investec Economics

    This would see the Deposit rate fall to 3.25% in Q4 ’24, somewhat lower than current market expectations, given some repricing of late. Some of this had followed the ECB’s Q1 negotiated wage growth data, which saw a rise to 4.7% y/y from 4.5%. But we would not read too much into this, given distortions from Germany*. Considering other data such as Indeed’s pay tracker and the ECB’s forward looking earnings tracker (as of April, expected 2024 wage growth had softened to 4.1% y/y from 4.7%#), we expect the moderation in pay growth to continue. This in turn will help to lower services inflation, which, having been stuck at 4% for five months, encouragingly turned lower in April to 3.7%. Assuming this trend continues, inflation should reach target in 2025, supporting our view of the Deposit rate ending next year at 2.25%.

    Chart 14: The moderation in wage growth is expected to continue

    Chart 14: The moderation in wage growth is expected to continue

    * A one-off €1,920 inflation compensation payment made in Q1 to public sector workers, # ECB blog post – Tracking Euro area wages in exceptional times 23 May 2024    

    Using the traditional definition – two negative quarters of GDP growth – the EU20 saw a recession over H2 2023, albeit by the slimmest of margins and certainly not comparable to any of the downturns seen since the creation of the Euro. It also proved to be very short-lived with Q1 GDP recording a 0.3% rebound. This was driven by a strengthening in activity across the four largest member states, including Germany, which saw growth of +0.2% q/q following its 0.5% contraction in Q4. Monthly indicators point to momentum being maintained in Q2, the May Composite PMI rising to a 12m high of 52.3. We have made some tweaks to individual country growth profiles, nudging up our overall EU20 GDP forecast for 2024 to 0.8% but leaving 2025 unchanged at 1.7%.

    Chart 15: Recovery from the shallow recession is already underway

    Chart 15: Recovery from the shallow recession is already underway

    Source: Eurostat, Macrobond, Investec Economics

    Away from monetary policy, June will also be an important month for fiscal policy, with the European Commission’s Spring Package due on 19 June. This will include its verdict on those member states breaching the EU’s fiscal rules and hence those being placed under its Excessive Deficit Procedure. Based on the EC’s Spring Forecasts published this month, seven countries are in breach of the 3% deficit rule, including Belgium, France and Italy (Chart 16). 21 June will subsequently see the EC publish country specific ‘reference trajectories’, i.e. a fiscal adjustment path for those in breach. There are two points to take from this. Firstly, it could prompt fiscal worries and consequently yield rises and bond spread widening. And secondly, a tightening in fiscal policy could provide a new headwind to growth.

    Chart 16: European Commission deficit and debt projections (2024): some excessive deficits

    Chart 16: European Commission deficit and debt projections (2024): some excessive deficits

    Source: European Commission, Investec Economics

    Six months after the election, Geert Wilders has reached an agreement for a new right-wing ruling coalition in the Netherlands. Despite Wilders having to soften some of his toughest policies, including a pitch for leaving the EU, and step back from becoming Prime Minister himself, this coalition government is set to be the most right-wing government in recent Dutch history and likely a headache for Brussels. Indeed, the Netherlands is not the first EU country to switch to the right. Support for far-right parties has been sweeping across Europe over the past year with some sources suggesting that June’s European Parliament elections could see a sharp turn right with populists topping the polls in nine member states, an outcome which would have consequences for EU-level policymaking.

    Chart 17: A turn to the right in the European Parliament elections?

    Chart 17: A turn to the right in the European Parliament elections?

    *Forecast from the European Council on Foreign Relations
    Source: ECFR, Flourish, Investec Economics

    The last month has seen the euro regain some ground against the US dollar, rising 1.5% to $1.08. Much of this has been down to US rather than domestic data; relief over April’s US CPI print released this month undid much of the dollar’s strengthening generated by the March report. Indeed the combination of the prospect of a later Fed cut and ECB acting earlier in June had seen some fears that €:$ might drift lower towards parity. That has not happened and we continued to believe that a less constructive USD backdrop could see EUR appreciate modestly over the next 18 months, ending this year at $1.10. We expect €:£ to remain in a tight range reaching 85p and 86p at end-‘24 and end-‘25 respectively.

    Chart 18: FX and interest rate differentials have once again become intertwined for EURUSD

    Chart 18: The Euro has been caught in the cross-currents of a stronger USD and weaker CHF

    Source: Bloomberg, Macrobond, Investec Economics

  • United Kingdom

    PM Rishi Sunak’s decision to call a general election for 4 July rather than the autumn was a surprise but does not alter our view of the likely outcome, which is a Labour government with a large absolute majority. Current polls put Labour 22% ahead of the Conservatives, which according to a nowcast by ElectionMapsUK could equate to a huge overall majority for Sir Keir Starmer’s party of 270.  The Tories may claw back some of this deficit as the election campaign draws on, and evidence from the most recent elections shows that the Conservatives usually perform better than pre-election-day polls predict (Chart 19). Even so, overturning the current lead will be a nigh-on impossible task, even with the economy looking stronger.

    Chart 19: The Tories tend to outperform polls in General Elections. But is the gap too big now?

    Chart 19: The Tories tend to outperform polls in General Elections. But is the gap too big now?

    *Average of last 8 polls before the election
    Source: Electoral Calculus, House of Commons Library, Investec Economics  

    Indeed, data for Q1 confirmed that the economy exited from recession by virtue of a 0.6% quarterly rebound in GDP. The recession in H2 last year was the mildest domestic ‘technical’ recession in recent history (Chart 20), lasting merely two quarters, with a peak to trough decline in output of just 0.4%, a downturn that was overturned by Q1’s increase. We have upgraded our GDP forecast for this year to +1.0% from +0.7%. This is partly due to the buoyancy of the Q1 upturn, but also because positive momentum in March suggests a reasonably decent Q2 as well – our prediction is for +0.4% (q/q), helped by a positive swing in the inventory cycle, before this effect fades in H2 this year.

    Chart 20: Recession, what recession?

    Chart 20: Recession, what recession?

    Source: Macrobond, ONS, Investec Economics

    Markets barely batted an eyelid to the PM’s announcement. Currency wise, sterling remained steady against the US dollar and the euro. In options markets though, some implied volatilities rose slightly (Chart 21), but overall ‘vols’ remain at historically low levels, meaning that the price of insuring against sharp FX moves across the election period is still relatively cheap (Chart 21). The spot rate has risen more broadly over the past month, in part reflecting a more favourable market perception of prospective interest rate differentials. We have nudged our end-year GBP view up to $1.29 and 85p against the euro, from $1.26 and 86p. The corresponding forecasts for end-2025 now stand at $1.31 and 86p (previously $1.29 and 88p).

    Chart 21: FX implied volatility across the election date has risen, but remains historically cheap

    Chart 21: FX implied volatility across the election date has risen, but remains historically cheap

    Source: Bloomberg, Macrobond, Investec Economics

    The MPC held the Bank rate at 5.25% on 9 May for the sixth consecutive meeting. In its Monetary Policy Report (MPR) the committee’s CPI projection dropped below 2.0% in Q2 2026, hinting not only at lower rates at some stage, but that they ought to fall faster than the rate profile priced into the yield curve (5.0% in Q3 2024 and 4.8% in Q4), which is used to condition the projections in the MPR. Whereas the MPC is assessing a range of data, its sharpest focus is on evidence of ‘inflation persistence’, where two indicators are key. First, April’s services CPI inflation slipped just marginally, to 5.9% from 6.0% (the headline CPI rate fell sharply to 2.3% from 3.2%, partly thanks to lower utility costs), some way above the MPR projection of 5.5%.

    Chart 22: Services (and headline) CPI inflation is running above BoE forecasts

    Chart 22: Services (and headline) CPI inflation is running above BoE forecasts

    Source: Bank of England, Macrobond, Investec Economics

    Second, private sector regular pay growth in March only just edged down to 5.9% (from 6.0%), against an MPR forecast for Q2 of 5.1%. Subsequent releases of both indicators are due ahead of the next MPC meeting on 20 June but may not fully match the fall in BoE projections, only just leaving the door ajar for an easing at that point. Also, by convention, the BoE agrees not to make public speeches during pre-election periods, making it difficult to steer markets or even to explain an unexpected decision after the event (bear in mind that the yield curve currently prices in just an 8% chance of a June cut). Accordingly we now expect the first easing in August (not June) and foresee two 25bp cuts this year (from three previously), to 4.75%.

    Chart 23: Rate markets have repriced* further over May, largely thanks to April’s CPI

    Chart 23: Rate markets have repriced* further over May, largely thanks to April’s CPI

    *Each line represents expected Bank rate changes (bps) by Jun, Aug and Sep 2024 MPC meetings
    Source: Bloomberg, Macrobond, Investec

    We have also nudged up our end-2025 target to 3.75% from 3.50%. This would still leave the BoE cutting rates ahead of the Fed (September). We expect an ECB easing in June and of course in terms of other western central banks, both the SNB and the Riksbank have already brought their policy rates down. Various observers have expressed caution and even bewilderment over other central banks taking action ahead of the FOMC. Although the US typically leads in rate cycles, the more robust US economy and stickier inflation profile provides ample justification for other central banks easing before the Fed on this occasion. We note that markets do not expect a permanent dislocation between US and UK interest rate markets and continue to see a high degree of correlation between the two (Chart 24).

    Chart 24: The MPC may ease before the Fed, but UK & US rate markets remain highly correlated.

    Chart 24: The MPC may ease before the Fed, but UK & US rate markets remain highly correlated.

    Source: Macrobond, ICAP, Investec Economics

Global Economic Overview - May 2024 PDF 1.53 MB

For more information contact our economists

Get more FX market insights

Stay up to date with our FX insights hub, where our dedicated experts help provide the knowledge to navigate the currency markets.

Please note: the content on this page is provided for information purposes only and should not be construed as an offer, or a solicitation of an offer, to buy or sell financial instruments. This content does not constitute a personal recommendation and is not investment advice. 

  • Disclaimer

    For the purposes of this disclaimer, “Investec Securities” shall mean: (i) Investec Bank plc (“IBP”); (ii) Investec Europe Limited; (iii) Investec Bank Limited (“IBL”); (iv) Investec Capital Asia Limited (“ICAL”); (v) Investec Capital Services (India) Private Limited; (vi) Investec Singapore Pte. Ltd (“ISPL”) and from time to time, in relation to any of the forgoing entities, the ultimate holding company of that entity, a subsidiary (or a subsidiary of a subsidiary) of that entity, a holding company of that entity or any other subsidiary of that holding company, and any affiliated entity of any such entities. “Investec Affiliates” shall mean any directors, officers, representatives, employees, advisers or agents of any part of Investec Securities. This document has been issued solely for general information and should not be considered as an offer or solicitation of an offer to sell, buy or subscribe to any securities or any derivative instrument or any other rights pertaining thereto. This document may have been issued to you by one entity within Investec Securities in the fulfilment of another Investec Securities entity’s agreement to do so. In doing so, the entity providing this document is in no way acting as agent of the entity with whom you have any such agreement and in no way is standing as principal or a party to that arrangement.

    The information in this document has been compiled by Investec Securities from sources believed to be reliable, but neither Investec Securities nor any Investec Affiliates accept liability for any loss arising from the use hereof or makes any representations as to its accuracy and completeness. Any opinions, forecasts or estimates herein constitute a judgement as at the date of this document. There can be no assurance that future results or events will be consistent with any such opinions, forecasts or estimates. Past performance should not be taken as an indication or guarantee of future performance, and no representation or warranty, express or implied is made regarding future performance. The information in this document and the document itself is subject to change without notice. This document as well as any other related documents or information may be incomplete, condensed and/or may not contain all material information: its accuracy cannot be guaranteed. There is no obligation of any kind on Investec Securities or any Investec Affiliates to update this document or any of the information, opinions, forecasts or estimates contained herein. Investec Securities (or its directors, officers or employees) may, to the extent permitted by law, act upon or use the information or opinions presented herein, or research or analysis on which they are based prior to the material being published. Investec Securities may have issued other documents or reports that are inconsistent with, and reach different conclusions from, the information presented in this document. Those reports and/or documents reflect the different assumptions, views and analytical methods of the analysts who prepared them. This document does not contain advice. Specifically, it does not take into account the objectives, financial situation or needs of any particular person. Investors should not do anything or forebear to do anything on the basis of this document. Before entering into any arrangement or transaction, investors must consider whether it is appropriate to do so based on their personal objectives, financial situation and needs and seek financial advice where needed. No representation or warranty, express or implied, is or will be made in relation to, and no responsibility or liability is or will be accepted by Investec Securities or any Investec Affiliates as to, or in relation to, the accuracy, reliability, or completeness of the contents of this document and each entity within Investec Securities (for itself and on behalf of all Investec Affiliates) hereby expressly disclaims any and all responsibility or liability for the accuracy, reliability and completeness of such information or this document generally.

    The distribution of this document in other jurisdictions may be prohibited by rules, regulations and/or laws of such jurisdiction. Any failure to comply with such restrictions may constitute a violation of United States securities laws or the laws of any such other jurisdiction. By accepting this document, you confirm that you are an "institutional investor" and agree to be bound by the foregoing limitations. This publication is confidential for the information of the addressee only and may not be reproduced in whole or in part, copies circulated, or disclosed to another party, without the prior written consent of an entity within Investec Securities. In the event that you contact any representative of Investec Securities in connection with receipt of this document, including any analyst, you should be advised that this disclaimer applies to any conversation or correspondence that occurs as a result, which is also engaged in by Investec Securities and any relevant Investec Affiliate solely for the purposes of providing general information only. Any subsequent business you choose to transact shall be subject to the relevant terms thereof. We may monitor e-mail traffic data and the content of email. Calls may be monitored and recorded. Investec Securities does not allow the redistribution of this document to non-professional investors or persons outside the jurisdictions referred to above and Investec Securities cannot be held responsible in any way for third parties who effect such redistribution or recipients thereof.