Aerial view of traffic and overpasses

28 Sep 2023

Global Economic Overview – September 2023

Philip Shaw, Ryan Djajasaputra, Ellie Henderson and Sandra Horsfield | London Economics team

Read Investec’s monthly Global Economic Overview for our latest forecasts for the global economy – including GDP growth, interest rates and FX.

Global Economic Overview - September 2023 PDF 1.34 MB
Summary
Global

Central bank policy has seen the hawkish hold emerge as flavour of the month, with policy rates reaching their likely peaks. As such the tone is now turning to how long rates remain at the current restrictive levels rather than the peak itself. This messaging that rates may remain at current levels for some time is a factor supporting yields and the US dollar, which has prompted an uplift in our forecasts. However, we continue to believe that directionally the US dollar and yields should soften over the course of 2024. This is driven by our baseline scenario of a further moderation in inflation and a slow down in demand, with signs continuing to emerge of a slow down in global economic activity. Our forecasts for Global growth are unchanged, but continue to anticipate subdued growth over 2023 (2.7%) and 2024 (2.5%), with downgrades to the EU20 offsetting an upgrade to the US.

United States

The resilience of the US economy to the higher rate environment has been quite remarkable thus far. We find the recent strength of economic data hard to ignore and therefore have revised our GDP growth forecast for this year up to 2.0% (prior: 1.8%). We also are no longer expecting a recession in Q4/Q1, although we do still forecast essentially stagnating output throughout the winter. But given the relatively more upbeat prospects we have pushed back our expectation for the first Fed rate cut to June next year. With the dollar no longer weighed down by earlier rate cuts relative to the likes of the ECB and the BoE, we have lifted our dollar forecasts. Lastly, although we still think it unlikely that Treasury yields will be maintained at the current high levels, we have softened the pace of decline, expecting the 10Y yield at 3.75% at end-2024.

Eurozone

The Eurozone has lost momentum, and the hitherto resilient service sector has now been caught up in the malaise. The tough medicine of rate rises is working as intended and welcomed by the ECB to the extent it reduces inflation pressure. China’s stuttering economy is taking its toll too, first and foremost in Germany, given trade ties. We have cut our EU20 ’23 and ’24 GDP growth forecasts by 0.3%pts each, to 0.4% and 0.9%, respectively. Barring data surprises, further rate rises appear unnecessary. We expect that, from mid-’24, a series of gradual rate cuts could begin as the current degree of restrictiveness may no longer be needed. By end-’24 the Deposit rate may reach 3.25%. Changes in our US rate expectations mean we see less scope than before for EUR appreciation against USD. Our end-’23 and -’24 forecasts are $1.07 and $1.12.

United Kingdom

Lower than expected inflation, at last, added to survey evidence pointing to weakening activity, has tilted the balance for the MPC to hold policy rates this month. We are now of the view that the Bank rate is at its peak. If our narrative of a mild recession this winter, along with a further easing in inflation, plays out – watch whether revisions to GDP alter the starting point – a less restrictive policy stance could become appropriate from mid-2024, with three rate cuts by the end of next year, to 4.50%. Markets have already repriced a long way, but we see further scope for rate expectations to be scaled back. Given this relative rate outlook, GBP may stay under pressure in trade weighted terms, failing to participate in what now looks like a smaller USD sell-off inany case. Our end-’23 and end-’24 GBPUSD forecasts are $1.24 & $1.26.

Read the full commentaries

  • Global

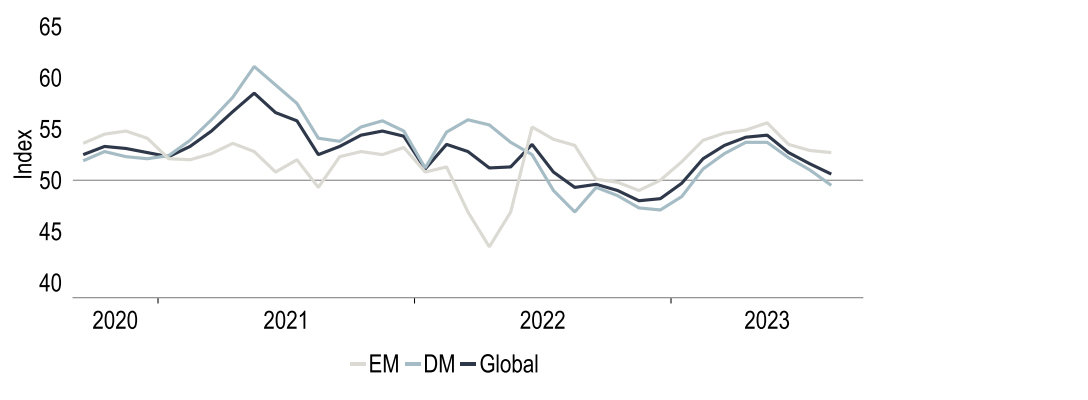
    Recent survey evidence from the PMIs has continued to point to a slowdown in global economic activity, the Composite reaching a 7-month low of 50.6. However, there are some interesting differences, with emerging markets (EM) outperforming developed market (DM) peers. This is visible on a sector basis too, with a continuing contraction seen in DM manufacturing, where for example the slowdown in China has hit Germany in particular. Meanwhile government policy in places such as India has been supportive. At the same time services growth has witnessed a sharp downturn in DM as interest rate rises have begun to hit demand.

    Chart 1: PMIs point to slowing global activity, but EMs outperform

    Chart 1: PMIs point to slowing global activity, but EMs outperform

    Source: Macrobond, Investec Economics

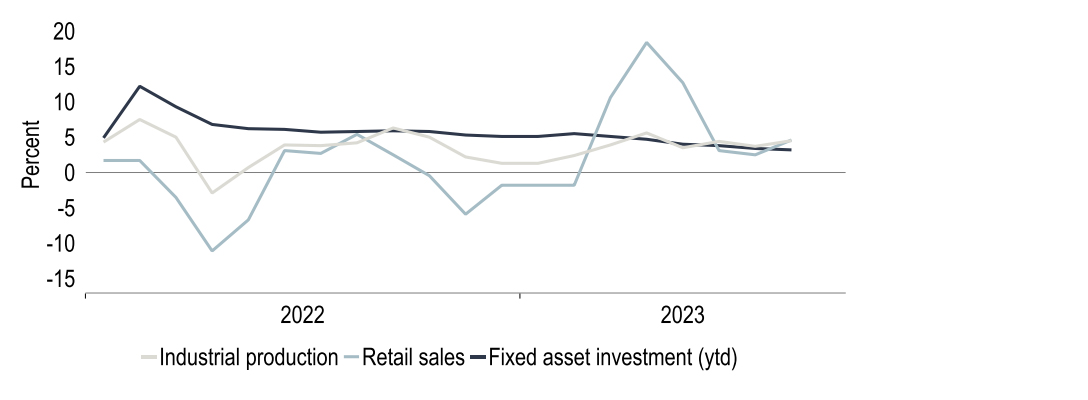
    Perhaps an indication of this is the divergence between Japan and other DMs. Japan has maintained an ultraloose stance of policy and continues to see healthy services activity (54.3), at a time when it has slowed to a crawl at 50.2 in others. However, as above not all EMs are seeing healthy growth, with China continuing to struggle. The latest figures for August may have offered some encouragement with annual growth in industrial production and retail sales rising, but this was flattered somewhat by favourable base effects. Our forecasts are unchanged with China expected to grow 4.8% this year putting it on track to undershoot the 5% GDP growth target

    Chart 2: Chinese indicators see some improvement in August

    Chart 2: Chinese indicators see some improvement in August

    Source: Macrobond, Investec Economics

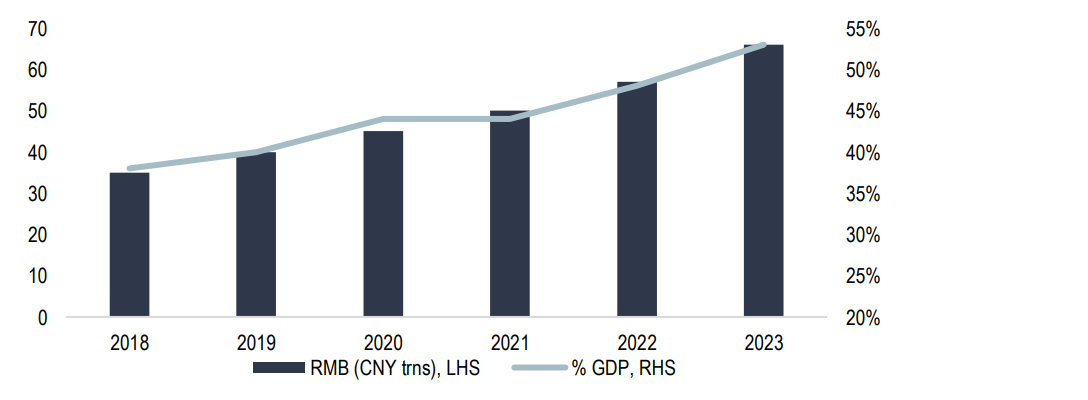
    Consequently, a question is why the policy response has been timid so far. The PBoC for example has only cut the RRR and LRP* by 50bps and 20bps respectively this year. A factor here may be worries of fuelling further Yuan weakness against USD. The government has also avoided mass stimulus; instead, measures to support the property market for example have been delegated to individual cities. Debt concerns likely play a part here. In the past stimulus has been injected via large-scale investment, often funded by LGFVs. This has often been in infrastructure and not been highly profitable, meaning debt servicing has been met through land sales. However, as the property market has weakened and revenues dried up, pressure has built on what the IMF estimates is $9trn** worth of LGFV debt, which in July had seen 48# missed payments.  

    Chart 3: Local government finance vehicle (LGFV) debt has almost doubled in five years

    Chart 3: Local government finance vehicle (LGFV) debt has almost doubled in five years

    RRR- Required Reserve Ratio, LPR- Loan Prime Rate, ** Converted at USD:CNY 7.0, # Bloomberg report 7-Aug: 48 LGFVs overdue on Commercial Paper payments in July, an increase of 19 versus June.
    Source: Macrobond, Investec Economics, IMF 2022 China Article IV

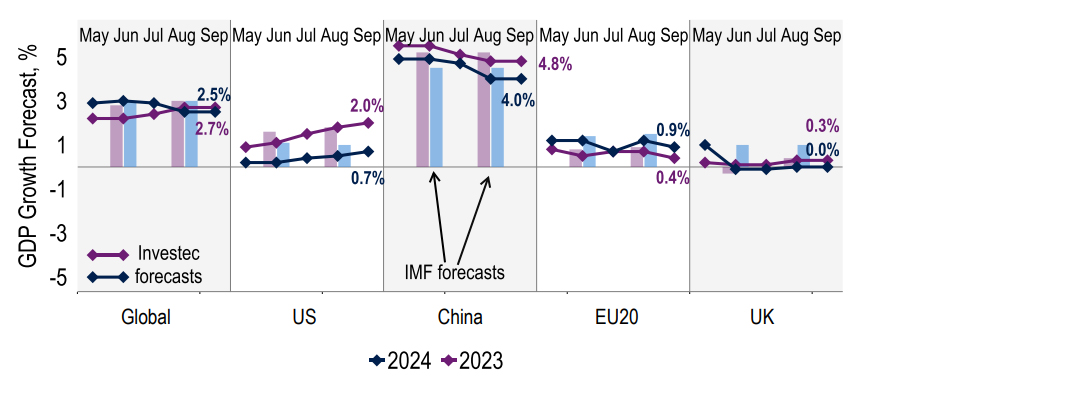
    We don’t necessarily see this turning into a crisis, but it may mean stimulus is less forthcoming and Chinese growth underperforms. But we will be looking for policy guidance during the Third Plenum in October. This China outlook has implications for global growth, for example its annual contribution to world GDP is 0.9%pt this year versus 1.1%pts in the five years prior to Covid. It also has ripple effects elsewhere and is one reason why we have downgraded Germany and consequently the EU20 for ’23 and ’24. However our forecasts for global growth are unchanged at 2.7% for 2023 and 2.5% in 2024, with downgrades being offset by upgrades to the US given its continued resilience and to some EMs such as India where growth has been stronger than expected.

    Chart 4:  US upgrades offset downgrades to the EU20 in terms of global GDP growth

    Chart 4:  US upgrades offset downgrades to the EU20 in terms of global GDP growth

    Source: Macrobond, Investec Economics

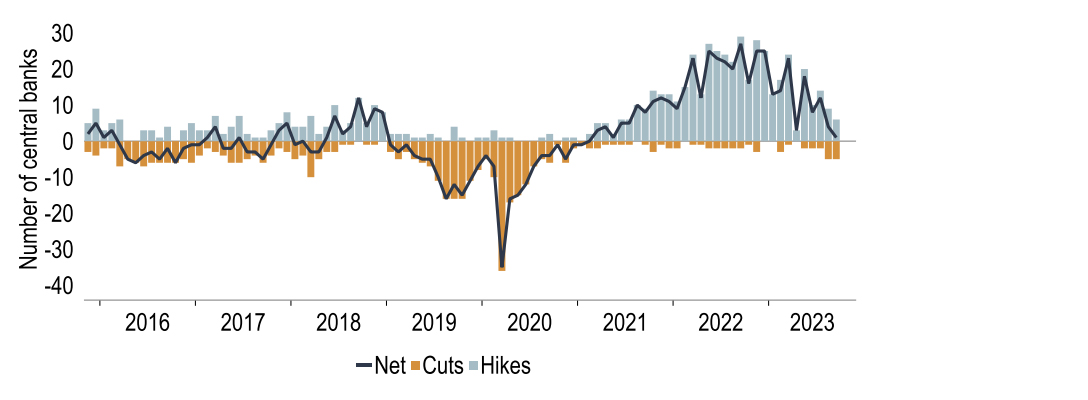
    Given signs that interest rates are beginning to restrain demand, and with inflation trending lower, the global tightening cycle looks to be coming to an end: the number of central banks hiking rates relative to cutting is at its lowest since May 2021. For the major G7 central banks cuts are not on the immediate horizon, but the majority are entering a pause with attention turning to how long rates need to remain at these restrictive levels rather than how high rates need to go. This we suspect will last into Q2 ‘24 before inflation and growth conditions merit some gradual loosening in policy from what are restrictive levels. Meanwhile, peak rates have already been seen in the likes of Brazil, where rates have been cut, with more to come. 

    Chart 5:  The net balance of central banks that are tightening is the lowest since May 2021

    Chart 5:  The net balance of central banks that are tightening is the lowest since May 2021

    Source: Macrobond, Investec Economics

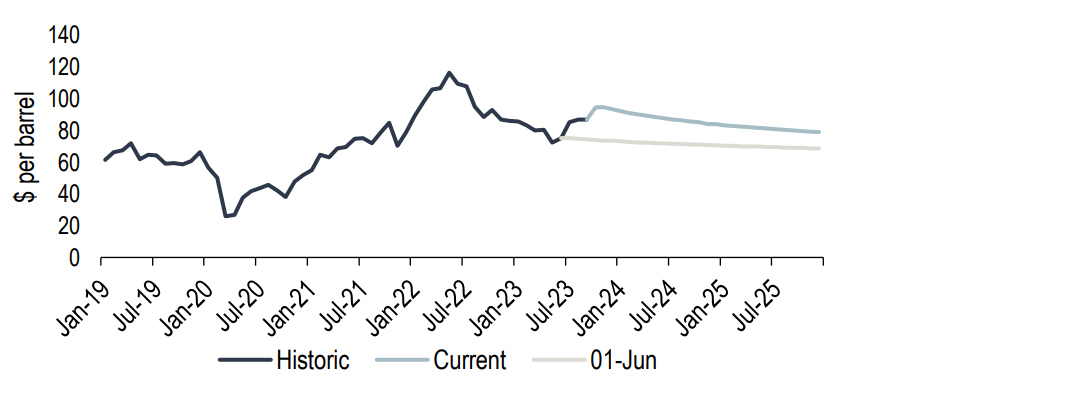
    However a potentially complicating factor is energy. A decision by OPEC+, pushed by Saudi Arabia and Russia, to extend a 1.3m bpd cut in output to the end of 2023 has seen Brent rise 29%, breaching $95 for the first time since Nov-22. Whilst energy prices are volatile and prices could retreat again, particularly so if the high price level encourages US shale output to increase, they pose an upside rise to inflation. This comes at a time when the disinflationary base effects are ending, and energy is once again contributing positively to inflation. As such these latest developments could add to worries over ‘higher for longer’ policy rates, but that is not our baseline case.

    Chart 6: Energy prices represent a renewed inflation risk ($ per barrel)

    Chart 6: Energy prices represent a renewed inflation risk ($ per barrel)

    Source: Macrobond, Investec Economics, Bloomberg

  • United States

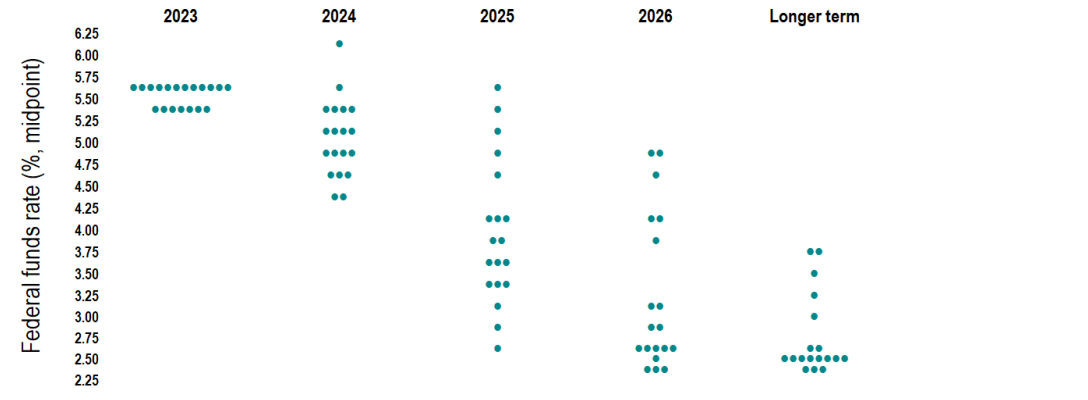
    Last week as was expected the FOMC held rates at 5.25-5.50%. However this decision was accompanied by a firm higher for longer message, leading to markets interpreting this as a ‘hawkish hold’. This is seen most clearly in the dot plot, which shows a median view on the committee of one further rate hike this year, followed by 50bps of cuts next year (previously 100bps). But despite the higher rate profile, the economy seems to come away relatively unscathed, at least on the Fed’s projections, with GDP growth revised up both this year and next. One reason why growth may be so resilient to a higher rate environment is if the neutral rate of interest has drifted higher, as speculated by Chair Powell himself.

    Chart 7: FOMC thinks one more hike this year, higher for longer next, but jury out for 2025

    Chart 7: FOMC thinks one more hike this year, higher for longer next, but jury out for 2025

    Source: Macrobond, Investec Economics

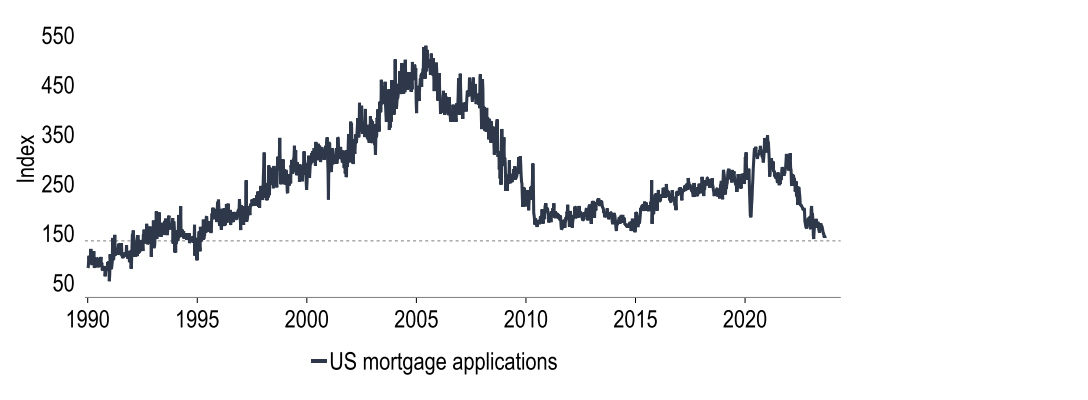
    We would agree with the Fed’s assessment that the US economy has been remarkably resilient over the past few months, particularly the consumer economy with the data hard to ignore. As such we have upgraded our own forecasts, boosting Q3 growth and removing our recession call. In spite of this we are still sceptical of the Goldilocks scenario that the Fed is projecting. Taking out a recession call is the matter of fractions of a percentage point - we still see stagnating output over the winter. There are still many headwinds to growth, the housing market is clearly struggling, and the resumption of student loan repayments should surely take the wind out of household consumption.

    Chart 8: Not all of the US economy is holding strong - mortgage approvals at mid-90s low

    Chart 8: Not all of the US economy is holding strong - mortgage approvals at mid-90s low

    Source: Macrobond, Investec Economics

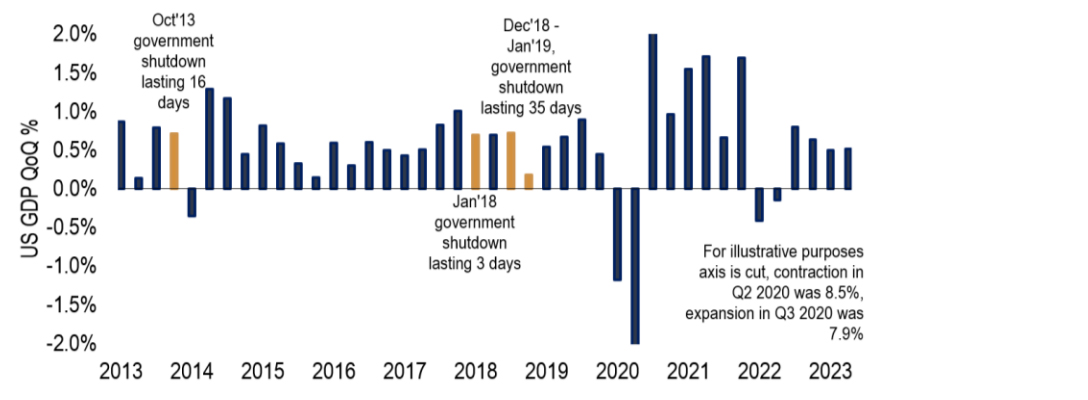
    There is also a further downside risk arising from a potential government shutdown. At the time of writing, it appears that Congress will not pass the 12 appropriation bills that will fund the government in time to avert a shutdown on Oct 1. Hard-line Republicans unhappy with the spending deal struck by House Speaker McCarthy and President Biden during the debt ceiling negotiations are refusing to pass the appropriation bills without seeing large cuts to expenditure. If an agreement isn’t reached a continuing resolution could be passed to keep government funded, but this too seems unlikely currently. The last government shutdown cost the economy $3 billion, according to the Congressional Budget Office, shaving 0.2%pts off Q1’19 GDP.

    Chart 9: How has the economy fared in past government shutdowns? Small hit to GDP.

    Chart 9: How has the economy fared in past government shutdowns? Small hit to GDP.

    Orange bars represent periods encapsulating government shutdowns.    
    Source: Macrobond, Investec Economics

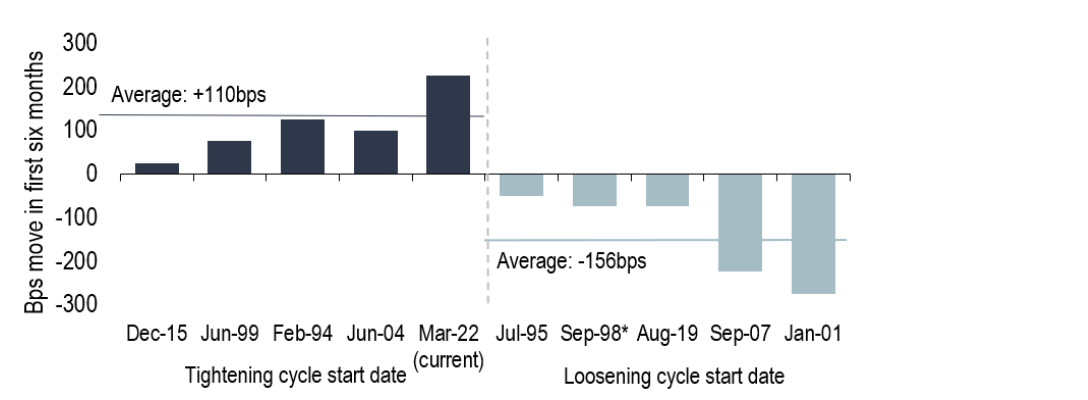
    The potential government shutdown could also complicate matters for the Fed, as it would likely result in the ceasing of economic data releases during this time, meaning the Fed could enter the Nov meeting essentially blind. Either way, we maintain our view that the Fed has hit peak rates. The next logical question is then if rate cuts are around the corner. In the past there has been a circa nine month break between the last hike and the first cut and interest rates have been reduced quicker than they were lifted (Chart 10). But this is a different situation - we do not believe the Fed will be reacting to a deep economic shock as has been seen in the past, rather a preference to normalise policy.

    Chart 10: In past cycles typically Fed has cut more aggressively in first six months than hiked 

    Chart 10: In past cycles typically Fed has cut more aggressively in first six months than hiked

    *Sep 98 easing cycle only lasted three months
    Source: Macrobond, Investec Economics 

    Indeed, our view is the same, that as the economy cools and inflation dips lower next year, the Fed will no longer see the need for such a restrictive level of policy, resulting in a gentle easing. But considering where we are now and the Fed’s desire not to be caught out by inflation again, particularly considering the upside risks posed by the recent rise in fuel prices, we have pushed the first cut back by 3 months to next June. From here we think the Fed will cut rates at each SEP meeting, amounting to 75bps of easing in 2024. In light of this tweak in timing, we have inched up our dollar forecasts for H1, with earlier rate cuts no longer weighing on the USD.

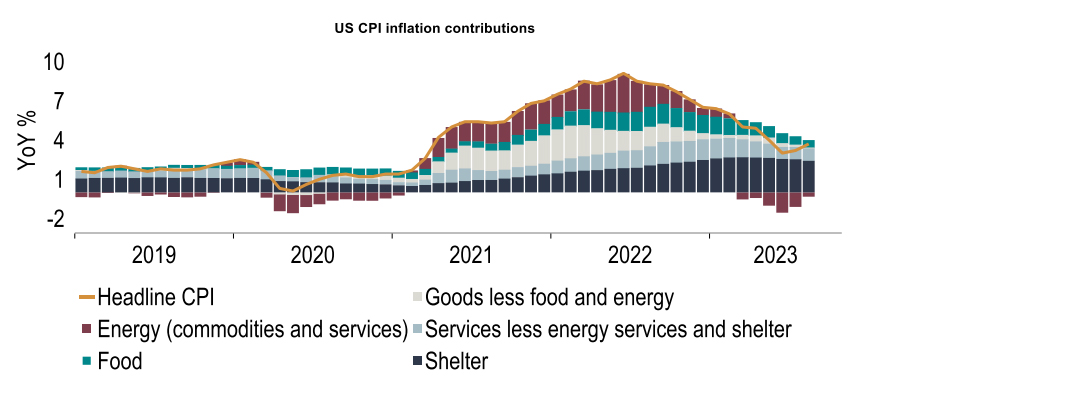
    Chart 11: The US can no longer rely on favourable energy base effects to drag inflation lower

    Chart 11: The US can no longer rely on favourable energy base effects to drag inflation lower

    Source: Macrobond, Investec Economics 

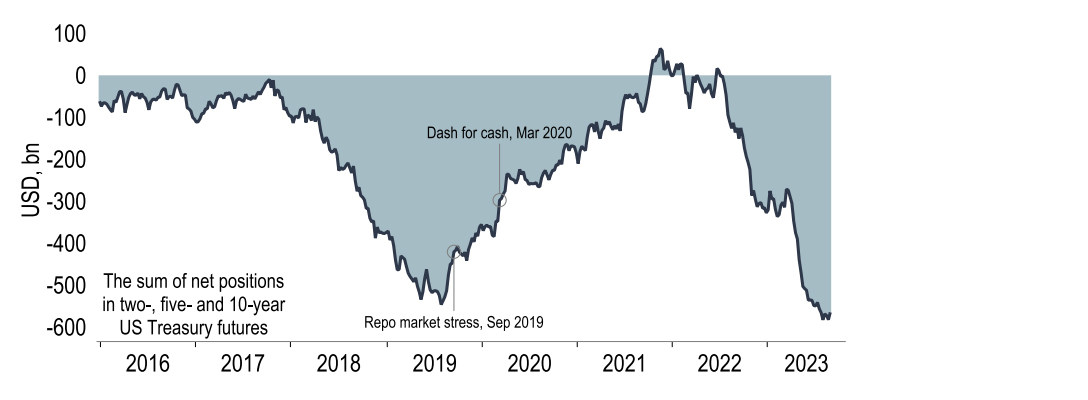
    There is also a growing financial stability risk to the US economy due to the build-up of leveraged short position in US Treasury futures. Hedge funds have been growing ‘basis-trades’ where the price differential between Treasury futures and the underlying instrument is exploited. This practice is not a risk per-se, what bodies such as the Fed, FSB* and BIS** are concerned about is the large positions and leverage involved – the spread between the instrument and the future tends to be small, so hedge funds are taking on huge amounts of leverage through the repo market to generate profits. The concern is that if there is a period of stress these positions may need to be unwound quickly, resulting in potential turmoil in Treasury and repo markets not unlike what was seen in March 2020 and September 2019.

    Chart 12: Leverage funds’ net short position in US Treasury futures sets alarm bells ringing

    Chart 12: Leverage funds’ net short position in US Treasury futures sets alarm bells ringing

    *Financial Stability Board **Bank for International Settlements
    Source: Macrobond, BIS, Investec Economics

  • Eurozone

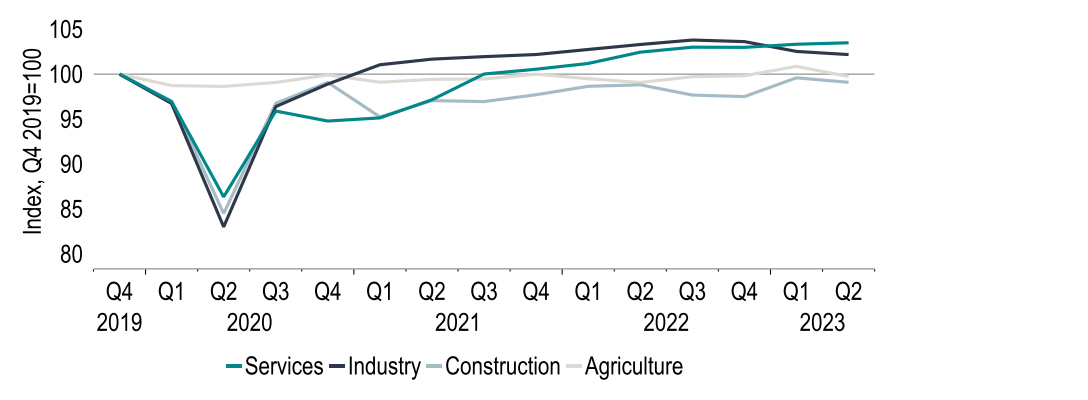
    This month, we have downgraded our Eurozone GDP growth forecasts: we now predict growth of 0.4% in 2023 and 0.9% in 2024, 0.3%pts less than last month for both years. The newsflow has pointed to a definite loss of momentum. This is perhaps most stark in the PMI data, where the index level for manufacturing is now 43.4, its 15th month below the neutral level of 50, and the services business activity index 48.4, the second month below 50. Noticeably, this illustrates that the downturn that began in industry in Q4 last year according to gross value added data is deepening, and that the hitherto resilient service sector (Chart 13) is now caught up in the malaise too. Even though the terms of trade have improved substantially now that gas prices are much lower, other negative factors have come into play.

    Chart 13:  GDP data show services resilient so far but industry to have contracted since Q4 ‘22

    Chart 13:  GDP data show services resilient so far but industry to have contracted since Q4 ‘22

    Source: Eurostat, Macrobond, Investec Economics

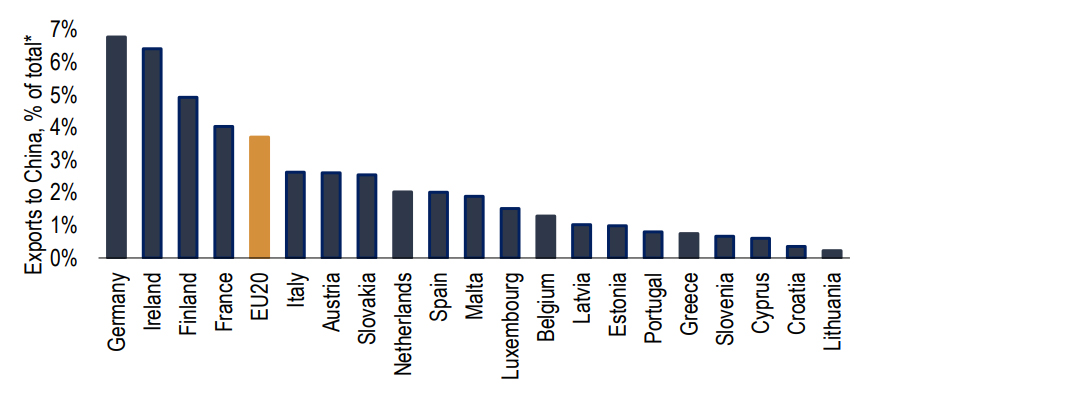
    The obvious one is the monetary tightening that has taken place, which has slowed the economy by deterring borrowing. But in addition, the disappointing performance of the Chinese recovery has had an impact too. However, not all EU20 economies are affected to an equal degree. Germany stands out as having a particularly large share (6.8%) of its total exports going to China, the highest in the EU20 (Chart 14). It is therefore feeling the pain most acutely. Among the other ‘big four’ EU20 economies, France comes next (4.0%), followed by Italy (2.6%) and Spain (2.0%).

    Chart 14:  Germany has the highest share among the EU20 of goods exports that go to China

    Chart 14:  Germany has the highest share among the EU20 of goods exports that go to China

    *2022 average
    Source: Eurostat, Investec Economics

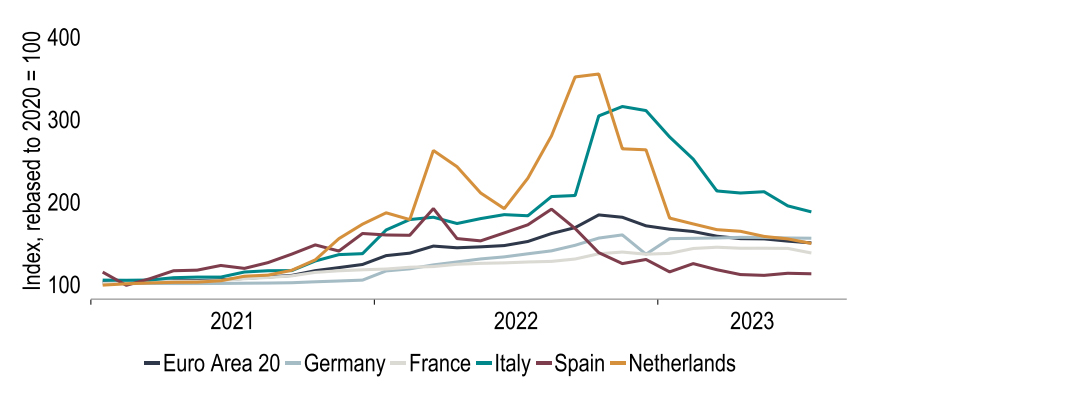
    The differentiated picture also reflects a rather varied experience at the household level of utility* price swings. Not only is the primary energy mix different, and the European gas market better characterised as regional rather than fully integrated, but governments have also taken quite different approaches to passthrough of the surge and subsequent partial unwind of wholesale gas prices to consumer utility bills. Chart 15 illustrates just how differently consumers’ utility bills have evolved. Italy (and the Netherlands) stand out as having been dealt a particularly challenging hand. Altogether, we now expect 2023/2024 GDP growth of -0.5%/0.4% in Germany, 0.8%/1.2% in France, 0.6%/0.7% in Italy and 2.2%/1.5% in Spain. Of these, Germany & Italy would be in technical recession.

    Chart 15: Household utility bills have evolved differently in the 5 biggest eurozone countries

    Chart 15: Household utility bills have evolved differently in the 5 biggest eurozone countries

    * Electricity, gas & other fuels
    Source: Macrobond, Investec Economics

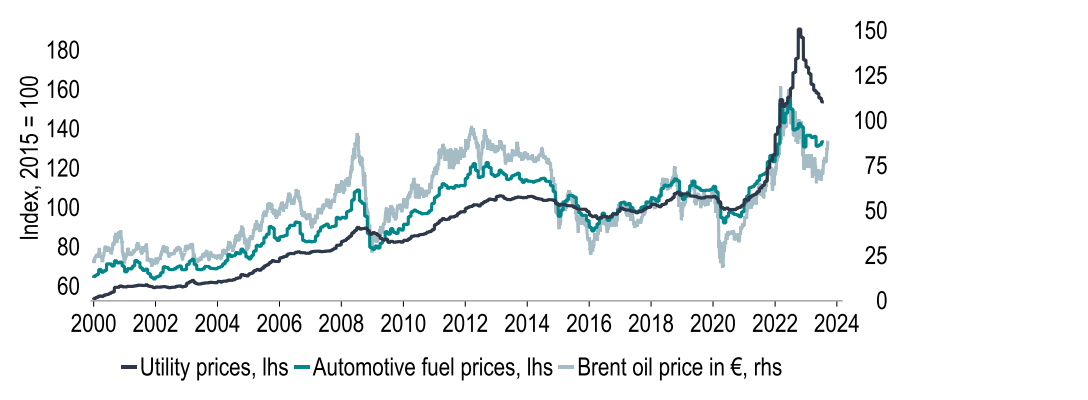
    Much more in sync is the experience the various member states have had with respect to automotive fuel prices. Along with utility bills these make up the energy component of the CPI basket. The common factor here is the oil price, the world trade of which is more closely integrated, and where the link to petrol and diesel prices is much more direct (Chart 16). Like utility prices, automotive fuel prices surged in 2021 and H1 2022. Since then, however, they had trended down, explaining the bulk of energy price disinflation so far. Now that the oil price has risen again, that disinflationary impulse from automotive fuels will turn into a (mildly) inflationary one.

    Chart 16:  Automotive fuel prices are more closely linked to the oil price than utility prices

    Chart 16:  Automotive fuel prices are more closely linked to the oil price than utility prices

    Source: Eurostat, Macrobond, Investec Economics

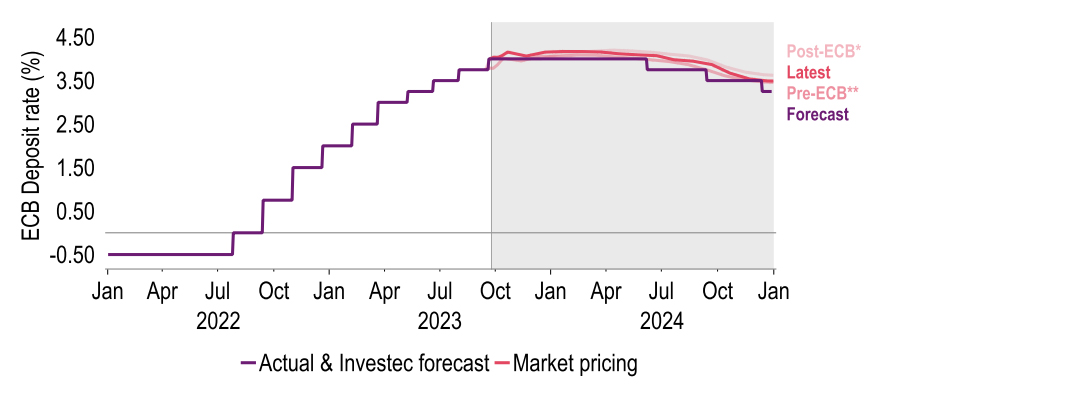
    But even taking this into account, we expect inflation to maintain its downward trend: from 5.3% now. We forecast inflation to fall to 3.3% by Q4 ’23 and to 2.2% by Q4 ’24. The ECB’s forecasts are 3.3% and 2.9%. In delivering one more hike at this month’s meeting, the Governing Council chose to err on the side of caution and solidify its inflation-fighting credentials. But it balanced this with a dovish tone at the press conference – so much so that peak rate expectations did not rise around the meeting (Chart 17). We expect that, barring surprises in the data, the ECB is now done with hiking and will stress going forward its plan of restrictive rates being maintained for ‘a sufficiently long duration’.

    Chart 17:  A dovish hike: peak rate expectations did not increase despite the latest rate rise

    Chart 17:  A dovish hike: peak rate expectations did not increase despite the latest rate rise

    *14 Sep 2023, ** 13 Sep 2023
    Source: Macrobond, Investec Economics

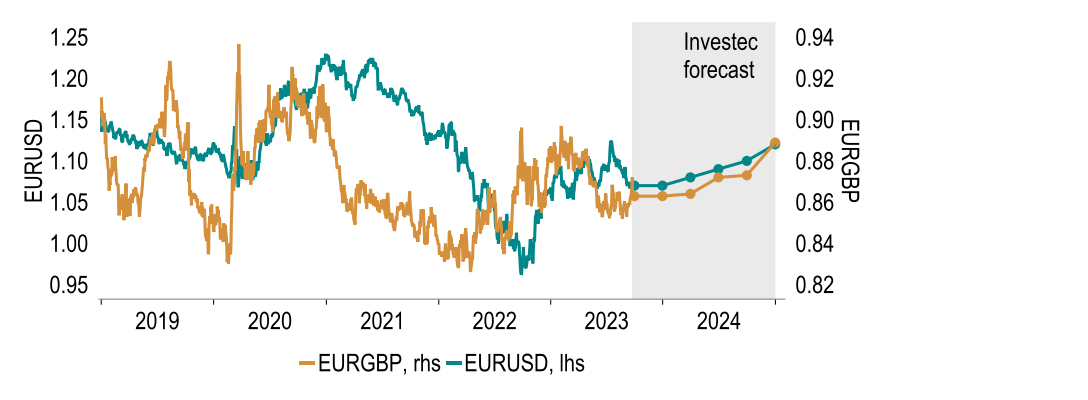
    How long exactly that will be is inherently uncertain, but if the economy evolves as we expect, a less restrictive policy stance could be appropriate from mid-2024. We expect a Deposit rate of 3.25% by the end of next year. Given changes to our US forecasts, this would leave the scale and timing of Eurozone rate cuts next year similar to those in the US. The relatively stronger growth performance of the US economy and the aforementioned rise in oil prices could hold back EUR for now, but in the long run we do see US rates as having more scope to fall, which may help the euro to strengthen over time. By the end of this year, we predict EURUSD at 1.07, and by end-2024, we factor in a level of 1.12. Against GBP, we foresee levels of 86p and 89p, respectively (Chart 18).

    Chart 18:  A gradual strengthening in the Euro looks in store as 2024 progresses

    Chart 18:  A gradual strengthening in the Euro looks in store as 2024 progresses

    Source: Macrobond, Investec Economics

  • United Kingdom

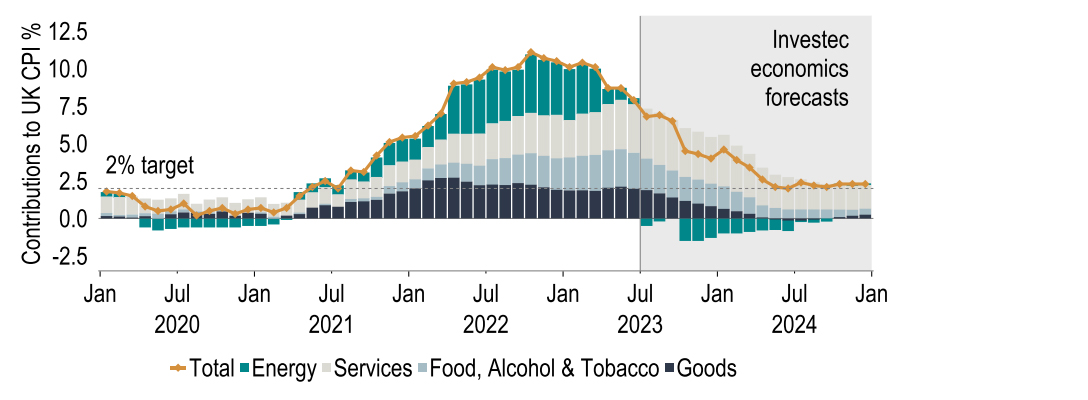
    CPI inflation surprisingly slipped to 6.7% in August from 6.8% in July, despite upward pressures from petrol costs and an increase in alcohol duty. Especially pleasing was a fall in service sector inflation which fell to 6.8% from 7.4%, helping to ease BoE fears of 'inflation persistence'. Upside risks here have not disappeared though. Wages are a critical factor in services costs and July’s labour market data showed private sector regular pay growth remaining elevated at 8.1% (3m yoy). Overall though we still expect CPI inflation to fall materially - our forecasts are 4.1% in Q4 2023 and 2.5% in Q4 2024. But we still recognise the upside risks from the labour market.

    Chart 19:  Inflation still heading downwards – are services less of a problem?

    Chart 19:  Inflation still heading downwards – are services less of a problem?

    Source: Macrobond, Investec Economics

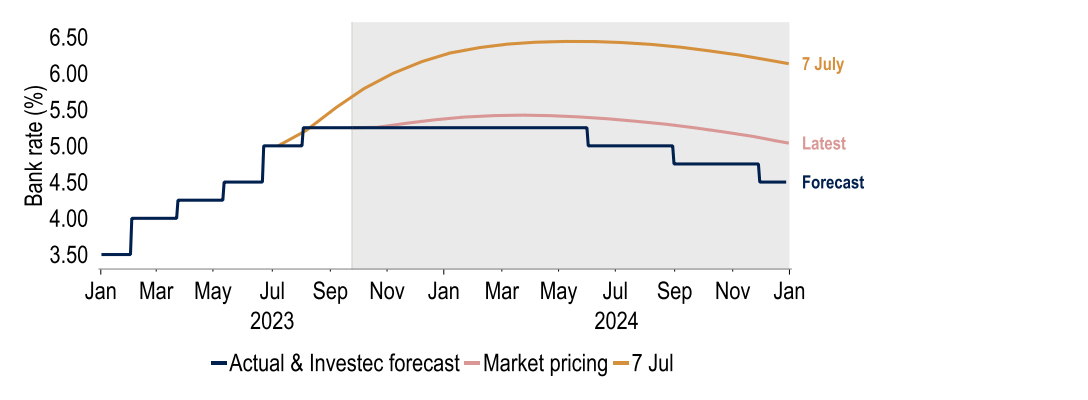
    In a finely balanced decision, the MPC maintained the Bank rate at 5.25% on 21 September by five votes to four, with the dissenters backing a 25bp hike. The majority put less weight on the official pay data, remarking that it was not consistent with other (softer) evidence. In addition the QT gilt ‘envelope’ for the coming year was raised to £100bn from £80bn. Although it has not said so explicitly, the MPC is ‘data dependent’. With services inflation seemingly less of a problem and the committee disbelieving the strength of the official pay numbers our base case is now that rates have peaked. The yield curve sees a 60% chance of a final hike; less than three months ago, a terminal rate of c.6.50% was priced in (Chart 20).

    Chart 20:  Bank rate to fall faster than market expectations despite ‘Table Mountain’ profile?

    Chart 20:  Bank rate to fall faster than market expectations despite ‘Table Mountain’ profile?

    Grey area indicates forecasts
    Source: Macrobond, Investec Economics

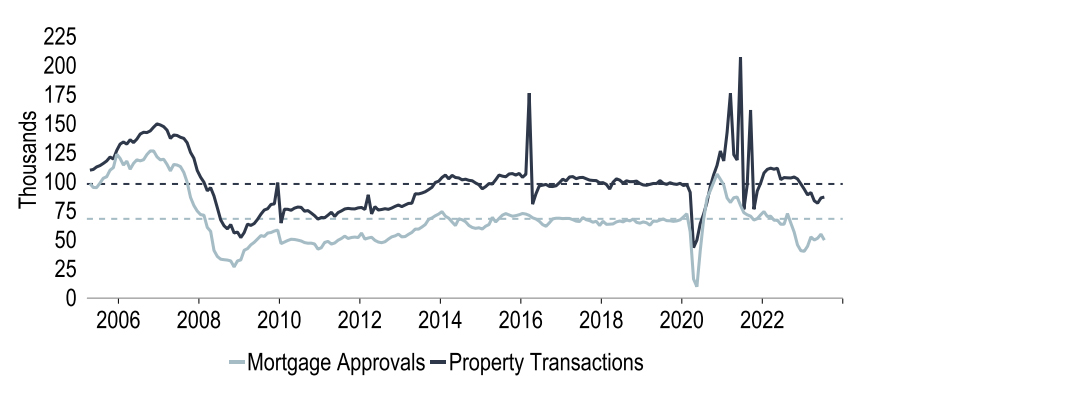
    A key question is the relative weight the committee places on weaker economic prospects. The housing market is a case in point. As mortgage rates rebounded over the summer and as more households have refixed mortgages, cracks have reappeared after a brief reprieve. Nominal house prices according to the Nationwide and the Halifax are now 5% off their peaks, while surveys suggest no bottoming out soon. But UK housing market adjustments typically take place more via lower activity rather than calamitous falls in prices, especially in inflationary periods. Indeed housing turnover is down by 16% on a year ago, and mortgage approvals for house purchase by an even greater 22%. Lower turnover tends to be accompanied by less consumption, smothering GDP growth.

    Chart 21: Housing activity metrics are very soft, especially mortgage demand

    Chart 21: Housing activity metrics are very soft, especially mortgage demand

    Source: Macrobond, Investec Economics

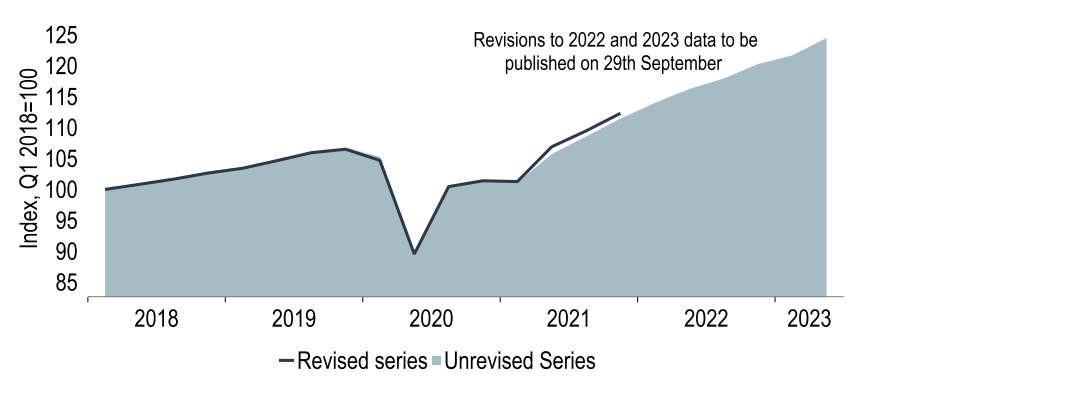
    GDP fell by 0.5% (mom) in July. This was distorted downwards by wet weather and strikes, but surveys, as well the housing market, point to softer activity after Q2’s +0.2% (qoq) growth as higher rates bite. For now, our GDP forecasts remain at +0.3% for 2023 and 0.0% for 2024 with a mild recession spanning the turn of the year. But a wildcard concerns revisions. The ONS has revised its GDP estimates: the level of output in Q4 2021 is now reckoned to be 2% higher than before. Data from 2022 will not be known until 29 Sep, but it is feasible that they too are stronger and that the UK is further from recession than it looks now. Another implication is that productivity growth has been higher through 2021 than first reported. If sustained, the MPC might be a little more tolerant of firm pay growth.

    Chart 22:  GDP levels for end-2021 were revised up by 2%. Will growth in 2022 and 2023 follow?

    Chart 22:  GDP levels for end-2021 were revised up by 2%. Will growth in 2022 and 2023 follow?

    Source: Macrobond, Investec Economics

    Attention may well soon turn to the next easing cycle. A common question is if the BoE tends to lower rates faster than it raises them. Chart 23 shows that since 1996, during the first six months of each rate cycle, it generally does. But this result was influenced by responses to various crises, which prompted aggressive cuts in rates. With the economy in recession and inflation falling sufficiently, our base case still sees rates coming down in mid-2024. But without (we hope) a major shock to the economy, and starting from very high inflation rates, we judge that the MPC will ease its policy stance at a more measured pace than it has tightened. In summary we are still projecting the Bank at 4.50% by end-2024 i.e .three 25bp reductions.

    Chart 23:  The BoE tends to cuts rates faster than it raises them (but not this time?)

    Chart 23:  The BoE tends to cuts rates faster than it raises them (but not this time?)

    Source: Macrobond, Investec Economics

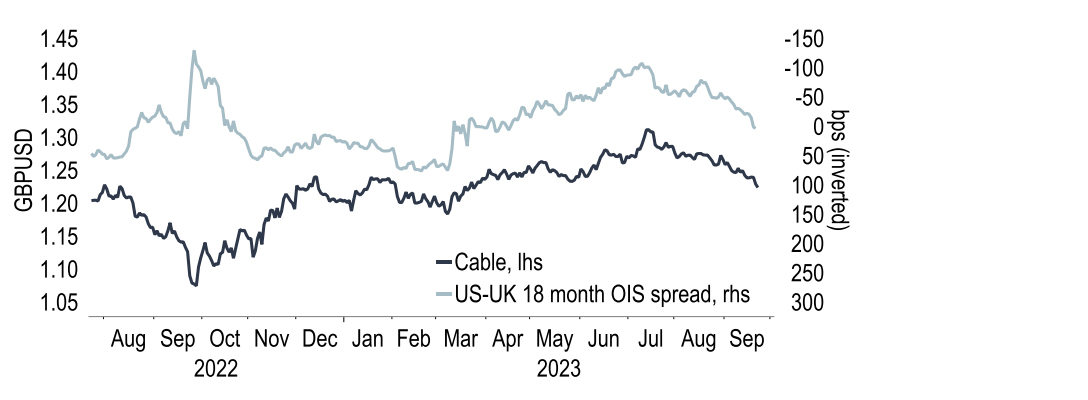
    The UK money market yield curve has shifted firmly downwards and become more negatively sloped over the past month but it is still pricing in less easing than our forecasts. From the point of view of our currency projections we have held the view that sterling could be vulnerable if and when the curve reprices. This has broadly played out with the pound slipping against both the dollar and the euro in recent weeks. We judge this may have further to run, envisaging sterling failing to participate much in a broader rally against the USD over the next 9-12 months, with cable stuck in the mid-$1.20s. But we now see sterling a little less weak against the euro at 86p at the end of this year. 

    Chart 24: Expectations of less support from interest rate differentials have led GBPUSD lower

    Chart 24: Expectations of less support from interest rate differentials have led GBPUSD lower

    Source: Macrobond, Investec Economics

Global Economic Overview - September 2023 PDF 1.34 MB

For more information contact our economists

Get more FX market insights

Stay up to date with our FX insights hub, where our dedicated experts help provide the knowledge to navigate the currency markets.

Please note: the content on this page is provided for information purposes only and should not be construed as an offer, or a solicitation of an offer, to buy or sell financial instruments. This content does not constitute a personal recommendation and is not investment advice. 

  • Disclaimer

    For the purposes of this disclaimer, “Investec Securities” shall mean: (i) Investec Bank plc (“IBP”); (ii) Investec Europe Limited; (iii) Investec Bank Limited (“IBL”); (iv) Investec Capital Asia Limited (“ICAL”); (v) Investec Capital Services (India) Private Limited; (vi) Investec Singapore Pte. Ltd (“ISPL”) and from time to time, in relation to any of the forgoing entities, the ultimate holding company of that entity, a subsidiary (or a subsidiary of a subsidiary) of that entity, a holding company of that entity or any other subsidiary of that holding company, and any affiliated entity of any such entities. “Investec Affiliates” shall mean any directors, officers, representatives, employees, advisers or agents of any part of Investec Securities. This document has been issued solely for general information and should not be considered as an offer or solicitation of an offer to sell, buy or subscribe to any securities or any derivative instrument or any other rights pertaining thereto. This document may have been issued to you by one entity within Investec Securities in the fulfilment of another Investec Securities entity’s agreement to do so. In doing so, the entity providing this document is in no way acting as agent of the entity with whom you have any such agreement and in no way is standing as principal or a party to that arrangement.

    The information in this document has been compiled by Investec Securities from sources believed to be reliable, but neither Investec Securities nor any Investec Affiliates accept liability for any loss arising from the use hereof or makes any representations as to its accuracy and completeness. Any opinions, forecasts or estimates herein constitute a judgement as at the date of this document. There can be no assurance that future results or events will be consistent with any such opinions, forecasts or estimates. Past performance should not be taken as an indication or guarantee of future performance, and no representation or warranty, express or implied is made regarding future performance. The information in this document and the document itself is subject to change without notice. This document as well as any other related documents or information may be incomplete, condensed and/or may not contain all material information: its accuracy cannot be guaranteed. There is no obligation of any kind on Investec Securities or any Investec Affiliates to update this document or any of the information, opinions, forecasts or estimates contained herein. Investec Securities (or its directors, officers or employees) may, to the extent permitted by law, act upon or use the information or opinions presented herein, or research or analysis on which they are based prior to the material being published. Investec Securities may have issued other documents or reports that are inconsistent with, and reach different conclusions from, the information presented in this document. Those reports and/or documents reflect the different assumptions, views and analytical methods of the analysts who prepared them. This document does not contain advice. Specifically, it does not take into account the objectives, financial situation or needs of any particular person. Investors should not do anything or forebear to do anything on the basis of this document. Before entering into any arrangement or transaction, investors must consider whether it is appropriate to do so based on their personal objectives, financial situation and needs and seek financial advice where needed. No representation or warranty, express or implied, is or will be made in relation to, and no responsibility or liability is or will be accepted by Investec Securities or any Investec Affiliates as to, or in relation to, the accuracy, reliability, or completeness of the contents of this document and each entity within Investec Securities (for itself and on behalf of all Investec Affiliates) hereby expressly disclaims any and all responsibility or liability for the accuracy, reliability and completeness of such information or this document generally.

    The distribution of this document in other jurisdictions may be prohibited by rules, regulations and/or laws of such jurisdiction. Any failure to comply with such restrictions may constitute a violation of United States securities laws or the laws of any such other jurisdiction. By accepting this document, you confirm that you are an "institutional investor" and agree to be bound by the foregoing limitations. This publication is confidential for the information of the addressee only and may not be reproduced in whole or in part, copies circulated, or disclosed to another party, without the prior written consent of an entity within Investec Securities. In the event that you contact any representative of Investec Securities in connection with receipt of this document, including any analyst, you should be advised that this disclaimer applies to any conversation or correspondence that occurs as a result, which is also engaged in by Investec Securities and any relevant Investec Affiliate solely for the purposes of providing general information only. Any subsequent business you choose to transact shall be subject to the relevant terms thereof. We may monitor e-mail traffic data and the content of email. Calls may be monitored and recorded. Investec Securities does not allow the redistribution of this document to non-professional investors or persons outside the jurisdictions referred to above and Investec Securities cannot be held responsible in any way for third parties who effect such redistribution or recipients thereof.