
Rising optimism over the economic outlook has been a major macro theme this year, in part driven by an improved energy situation, as well as the abandonment of China’s zero Covid policy. Correspondingly, we have upgraded our forecasts for global growth this year to 2.7% (from 2.4%). 3.0% growth is expected in 2024. At the same time markets continue to grapple with the outlook for monetary policy, with the firmer than expected data for January prompting a repricing in interest rate markets for higher terminal rates and for longer. We suspect that US January data may have been distorted upwards, but the coming month will be crucial in determining whether there is underlying resilience. If so, the risks to our interest rate forecasts are very much tilted to the upside.
A plethora of hot data releases for January has driven a ‘higher for longer’ narrative for policy rate expectations in markets. We too think that the recent data – particularly the PCE inflation release – will encourage the US Federal Reserve (Fed) to keep tightening for longer, penciling in an additional 25bp hike to 5.00-5.25% in May and pushing rate cuts back to early 2024. Accordingly, we have lifted our end-2023 10Y UST yield forecast to 3.50% (prior: 3.00%).
Recession in the EU20 seems to have been averted this winter, and prospects for the ’23/’24 winter have brightened too, as energy savings have slowed the drawdown of gas storage and energy prices have fallen. We have lifted our GDP forecasts for the Eurozone by 0.4%pts to 0.5% for 2023 and by 0.2%pts to 1.1% for 2024. Inflation, however, remains a worry. Even though loan growth data suggest rate hikes are starting to bite, labour market resilience may keep wage growth elevated. Despite what may well be its first downgrade to inflation forecasts for some time, the ECB looks set to hike rates somewhat further – we see a peak of 3.25% in the Deposit rate – and only cut them again in 2024. Over time, as a turn in US rates moves back into view, EUR may strengthen, to $1.12 by year-end.
UK CPI inflation is likely to fall below the 2% target by end-year helped by lower gas prices. Pay growth remains firm with private sector regular earnings growth at 7.3% (yoy), although we expect this to moderate through the course of the year as unemployment rises. We have revised up our 2023 GDP forecast to -0.5% from -1.0%, now expecting a milder recession lasting three quarters. Note though that official figures currently seem prone to material revisions. Our forecast peak for the Bank rate remains at 4.25% and we still see rates coming down later this year as the economy stutters and inflation falls. Similarly we have held our sterling forecasts at $1.25 and 90p against the euro at end-year. We doubt that the new agreement on the NI protocol (officially announced as we were going to print) will make a big difference to the currency. Nicola Sturgeon’s resignation as SNP leader though adds an interesting dynamic to the political outlook.
Global
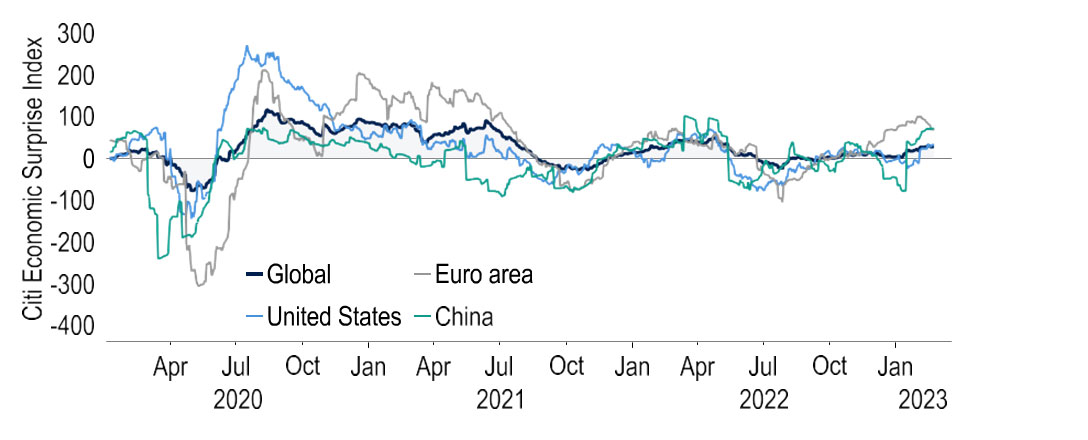
The start to 2023 has been marked by several macro themes; rising optimism over the economic outlook, signs that inflation may have peaked and rising expectations of central bank terminal rates. Regarding the growth outlook, a number of indicators, ranging from January’s US payrolls to the PMI surveys have provided evidence of resilient activity in major economies. The weather has played a part, milder conditions in Europe easing energy demand and spot gas prices declining sharply (-33% ytd*). Unseasonably warm weather in the US also likely boosted spending, as evidenced by strong retail sales readings.
Chart 1: Economic indicators at the start of 2023 have been firmer than expected
* European natural prices (TTF)
Source: Macrobond
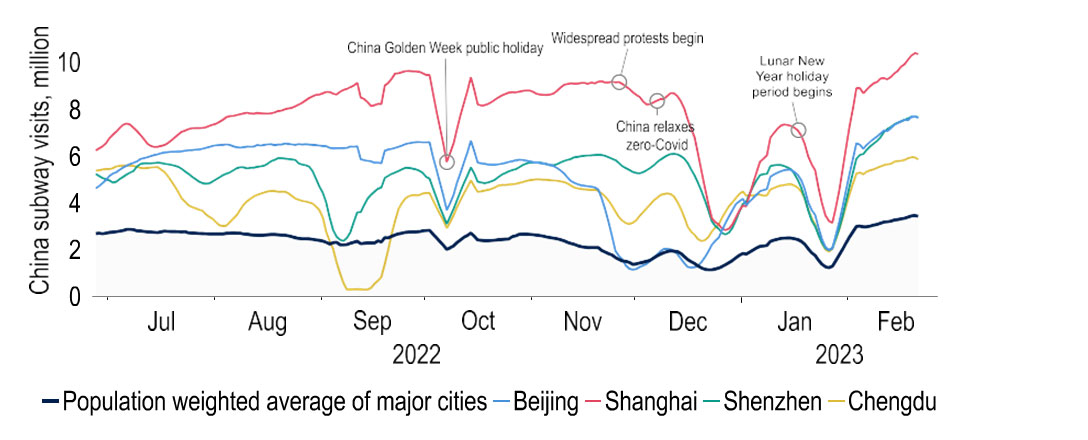
Meanwhile the end of Beijing’s zero Covid policy is set to boost Chinese domestic demand and help ease supply chain issues further. Q1 GDP will therefore be a key gauge of how consumers reacted to the end of social restrictions. High frequency indicators such as subway use encouragingly point to a pickup in activity. Consequently, we estimate a 2% q/q rise in GDP. The consumer will also play a material part in the recovery through the year, given an element of pent-up demand. Excess savings, estimated at CNY10trn, will be a factor here. However, we would note that Chinese predisposition to save is greater than that in the West, so the recovery in demand may be more modest than seen elsewhere.
Chart 2: China’s subway use points to a pick-up in activity post-social restrictions
Sources: Investec, Macrobond
A recovery in the housing market may also be in train. January’s data provided perhaps the first glimmer of this, prices rising 0.1% m/m, the first increase in 16 months. Given these trends we have pushed our 2023 GDP forecast up to 5.2% (from 4.9%), but 2024 remains at 5.0%. Clearly a resurgent China will also lend support to global growth, where we have lifted our 2023 forecast 0.3%pts to 2.7%. But risks remain – the cost-of-living crisis continues, and we doubt that the full effects of global monetary tightening have been felt as yet. Geopolitics should not be dismissed either. Tensions between the US and China are rising following the spy balloon incidents and could rise further still given US concerns over the possible supply of Chinese lethal aid to Russia.
Chart 3: More optimistic outlook prompts GDP upgrades for 2023

Sources: Investec, Macrobond
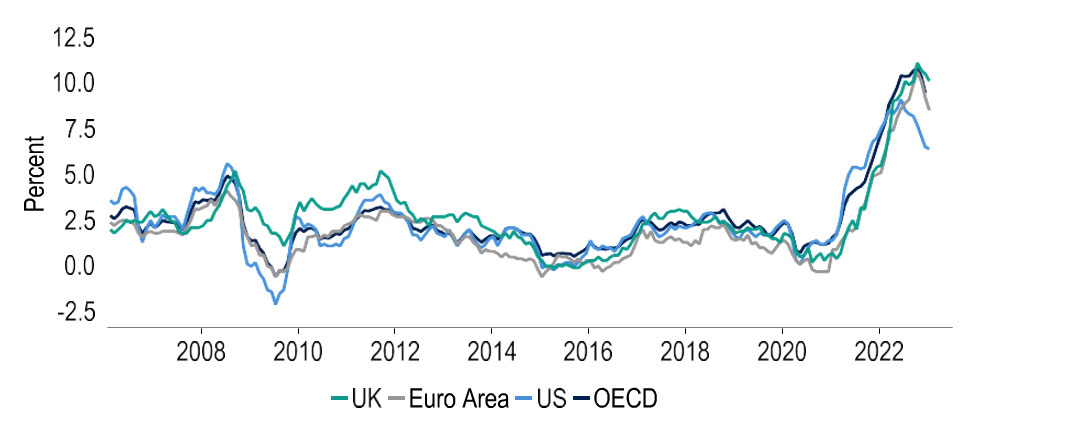
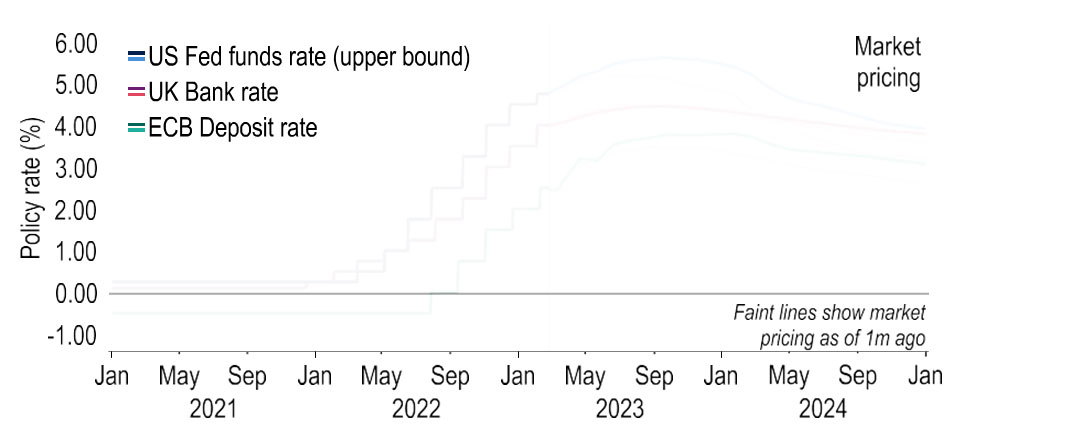
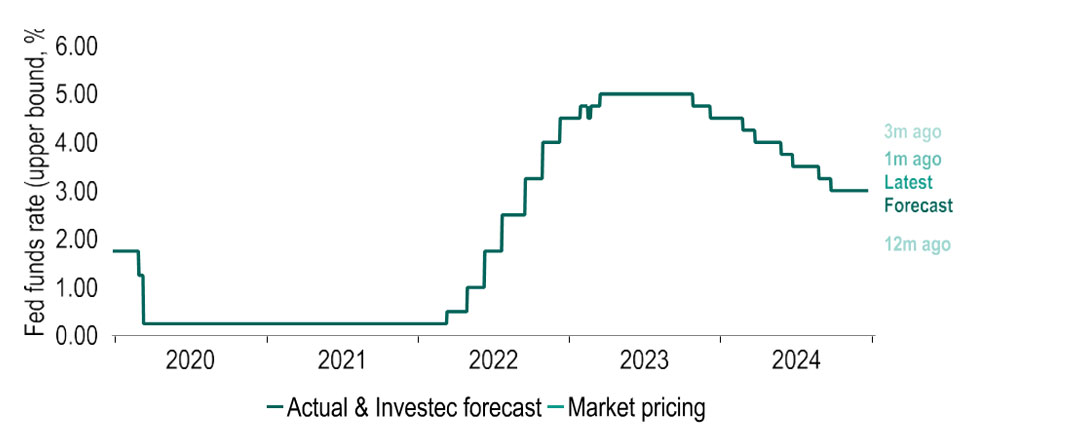
Despite signs that headline inflation has peaked (Chart 4) robust data have led to market speculation of stronger demand and further ‘core’ price pressures, which have remained stickier, and ultimately higher terminal rates. Certainly, the moves in rate markets have been notable, both in terms of the upward drift in terminal rates, but also the pricing out of rate cuts this year (Chart 5). End-2023 US rate expectations have for example jumped 70bps since 1 Feb. As noted above, there are reasons to believe that much of the strength this year has been due to the weather and other distortions, but we are mindful of the risk that there may be genuine resilience in activity.
Chart 4: In many places headline CPI inflation looks to have peaked
Sources: Investec, Macrobond
We have shifted our US rate and bond yield forecasts upwards (see US section), but data over the next month will still be crucial. If there is no softening in economic momentum (or indeed if activity collapses suddenly), our views will need to be reviewed again. Ultimately this period could be volatile as markets grapple with the outlook, especially so for rates, where option volatility has remained higher than the 3-year average though equity volatility is marginally lower (Chart. 6). US 10yr Treasury yields for example have already swung 60bps since the start of this month rising to 3.95%, sentiment swinging due to softer inflation data through to thoughts of higher for longer rates. As with our policy rate forecasts, risks are tilted to the upside.
Chart 5: Market interest rate pricing has adjusted sharply in February
Sources: Investec, Macrobond
This interest rate backdrop has also had knock-on impacts on FX markets given the strength of the USD. In the G7 space the policy differential between the US and Japan has been stark, putting pressure on the BoJ to loosen or even drop its yield curve control policy. To date this has been resisted, but speculation is building that incoming Governor Ueda may make changes. Pressure is also building in the EM space, where Egypt, Pakistan and Lebanon have all been forced to drop longstanding policies linking their currencies to the dollar, prompting sharp devaluations. More could follow as EM central banks face the tough decision of burning through foreign exchange reserves to support their currencies or devaluing, which could prompt a worsening of the inflation picture.
Chart 6: Implied volatility has been more pronounced in rate markets
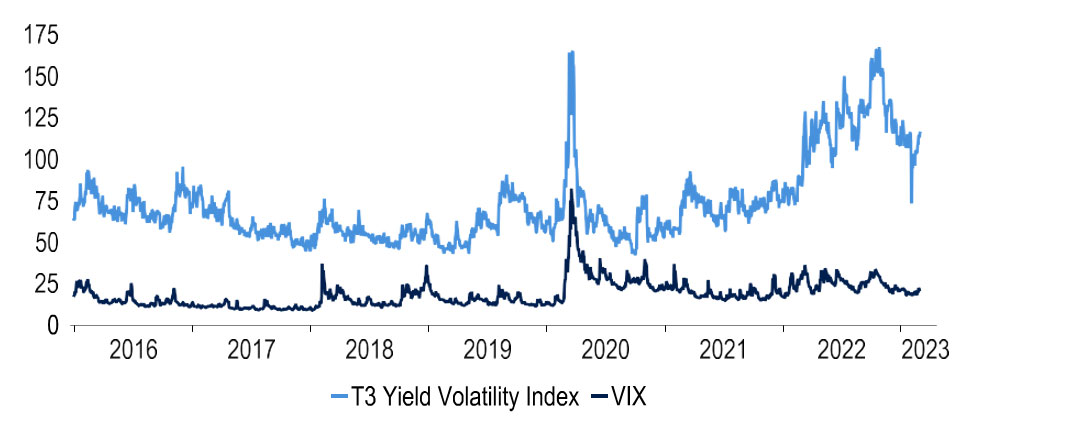
# T3 Yield Volatility index: 1m implied volatility in 10yr US rates
Source: Macrobond, Investec
United States
Fixed income markets have become increasingly sensitive to economic data and a flurry of hotter-than-expected US data releases this month has reinforced this theme. Markets have scaled up terminal rate expectations in response to the whopping 517k non-farm payroll print, the upward surprise on CPI inflation and most recently to strong retail sales, PMI and PCE inflation data (Chart 7). Although the data is pointing to a more resilient economic backdrop, we suggest reserving judgement on underlying trends in the economy until the February numbers are published. This is because there is a risk that weather distortions had a sizeable impact on most numbers.
Chart 7: Recent data has led to a repricing in interest rate expectations
Sources: Investec, Macrobond
For now, we have added one 25bp hike to our forecasts, taking the peak Fed funds range to 5.00-5.25% in May, and pushed out the time when we expect cuts to begin to early 2024. Further upside risks to this call remain, taking into account more hawkish Fed comments. A key risk centres on the extremely tight labour market. Although the strong payrolls print was most likely supported by the milder weather in Jan and recognising that these numbers can be volatile, there is the risk that this wasn’t a ‘freak-print’ and that still- ample vacancies are filled through above- productivity wage growth. There is also the concern that even if conditions do ease, the ‘new normal’ involves a permanent shift higher in the Phillips curve and thus sustained wage pressure.
Chart 8: Has the relationship between wage growth and unemployment shifted?
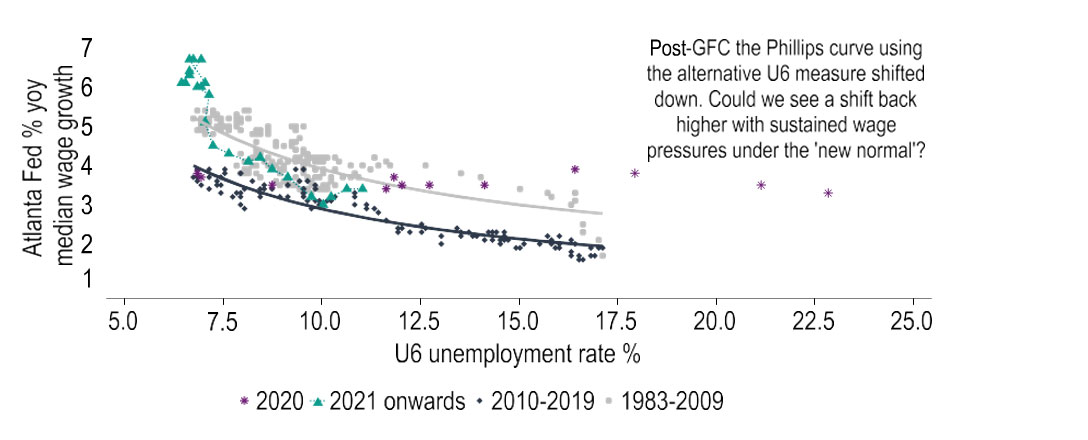
Source: Investec, Macrobond
Alongside the labour market numbers, the strong activity data for Jan has also raised ‘higher for longer’ bets. Taken at face value, the 3.0% monthly gain in nominal retail sales would point to a truly robust consumer environment. But c.70 million US citizens did see an 8.7% uplift to social security payments in January, no doubt encouraging high street spend and one data point does not define a change in the trend. This is especially true considering that Jan sales could also have been lifted by the milder weather enticing people to the high street, particularly after the ‘bomb cyclone’ in Dec. There is a correlation between winter temperatures and retail sales, albeit a fairly weak one (Chart 9).
Chart 9: Can the mild weather explain the retail sales bounce in January?
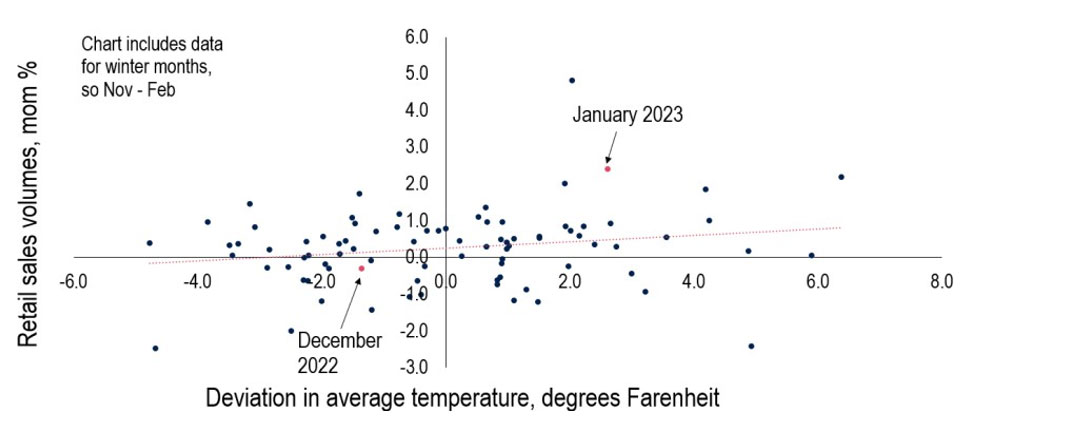
Source: Investec, Macrobond
Ultimately though, we will have to wait until the Q1 final demand data to reveal the true strength of the domestic economy. If the consumer environment remains as strong as is shown in the Jan activity data, then final domestic demand (which strips out inventories & trade) should rebound in Q1 after having run below the pre- pandemic trend since Q3 ’21. Indeed, the latest GDP prints have been boosted by trade and inventory swings, rather than domestic economic strength. As such, on the activity data alone, there is an argument for a ‘wait and see’ approach to the path for interest rates to see if trends have indeed changed – a retracement in the Feb data is entirely possible.
Chart 10: Final demand data does not suggest a booming economy, will there be a revival in Q1?
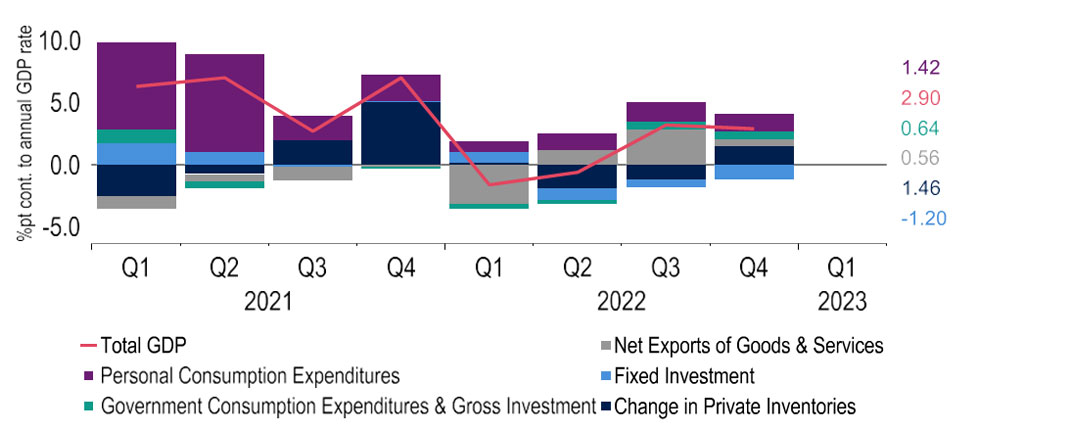
Source: Investec, Macrobond
But it is not just activity and labour market data in Jan that was concerning. It was also inflation data, and this changes the outlook in our view. The PCE price index, the Fed’s targeted measure of inflation, was hotter than expected in Jan, ending a three-month streak of lower year-on-year reports, edging up to 5.4% (Chart 11). Past data were revised higher (Dec’s print is now at 5.3% from 5.0% previously). Notably PCE core services inflation ex- housing, a subsector that Fed Chair Powell mentioned six times in his Feb FOMC press conference, rose to 4.7% from 4.3%. Even with the various caveats on the activity data we believe these cumulative flashing red warning signs are now too strong for the Fed to ignore.
Chart 11: A hot PCE inflation print raises pressure on Fed to continue hiking
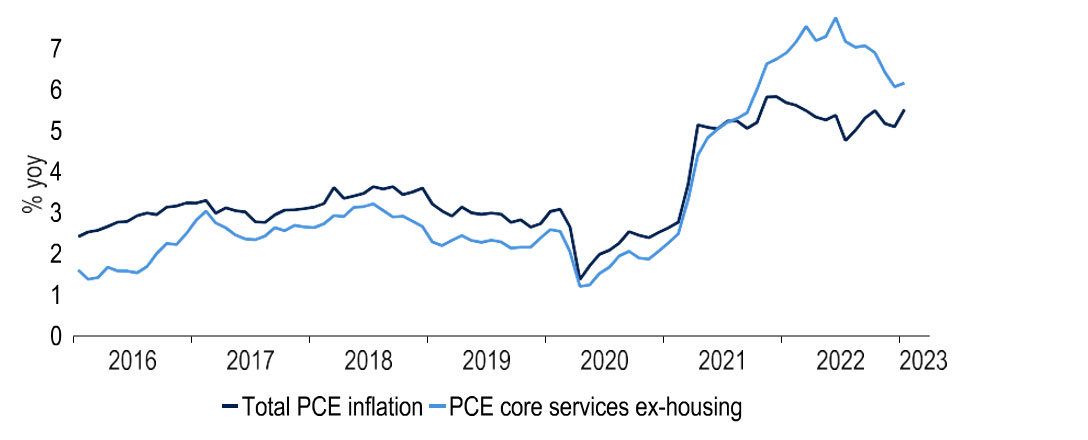
Source: Investec, Macrobond
Indeed, we are operating in a world where the Fed’s reaction function may be more sensitive to inflation surprises, after having been caught out by more persistent inflation in the past and not wishing to make the same mistake twice. This does not mean that we have abandoned our call that the economy will eventually crack, and inflation will return to 2%, however. Our GDP forecasts remain for muted growth of 1.1% and 0.7% in 2023 and 2024, respectively. There are many signs pointing to lower inflation ahead, such as easing new rental price growth and margin compression (Chart 12). But the risks are clearly skewed to the upside, which we have reflected in our new Fed funds forecasts.
Chart 12: Margin compression is one route that will pull headline inflation lower
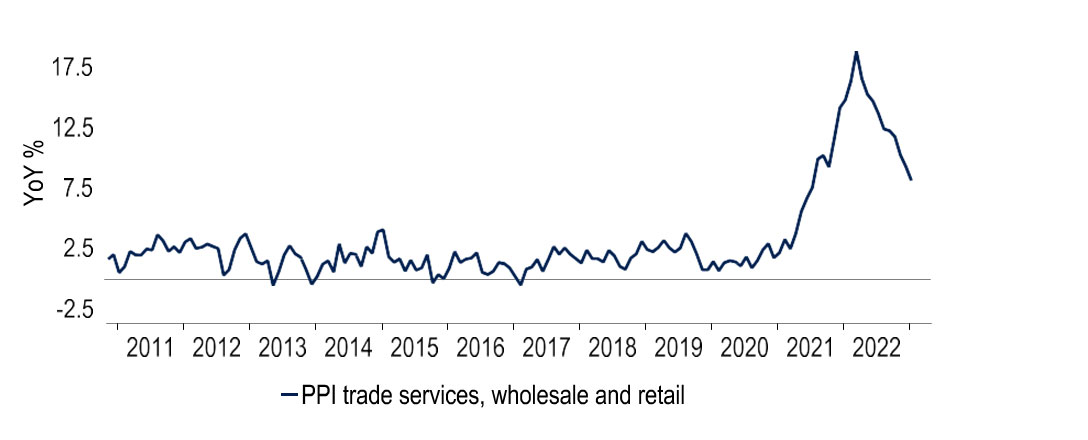
Source: Investec, Macrobond
Eurozone
As per the flash estimate, GDP expanded by 0.1% in Q4. Irish data, heavily affected by the volatile recording of multinationals’ activities, exaggerated strength: ex Ireland, GDP would have slipped a tad (by 0.03%pts; Chart 13). Not only did this beat consensus expectations but, even if it is followed by a contraction in GDP in Q1 (as seems plausible), recession – defined as two consecutive quarters of falling output – looks to have been averted this winter. Moreover, lower wholesale gas price futures and energy savings (also aided by a mild winter) slowing the drawdown of gas storage have brightened prospects for the ‘23/‘24 winter too. We have upped our GDP forecasts for ’23 by 0.4%pts to 0.5% and for ’24 by 0.2%pts to 1.1%.
Chart 13: Had it not been for Ireland, Euro area GDP would have contracted (marginally) in Q4
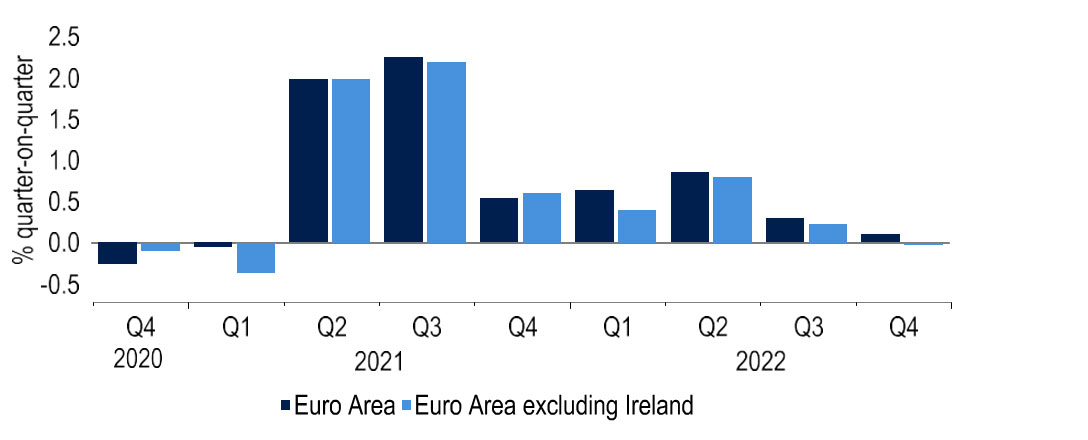
Source: Eurostat, Macrobond and Investec
For a net energy importer such as the EU20, lower energy prices are unequivocally good news, lowering inflation and raising external purchasing power through improved terms of trade, reversing some of the recent sharp deterioration (Chart 14). That said, the ECB’s concerns will be that the inflationary genie may have been let out of the bottle. Amid structural labour shortages due to population ageing, workers have been seeking, and increasingly securing (Chart 15), higher wages to compensate for recent losses of purchasing power. So even though the direct energy hit to inflation may subside more quickly than had been hoped for inflation may prove more persistent on second-round effects as firms seek to pass on higher wages through subsequent price rises.
Chart 14: The terms of trade have plummeted in the euro area, holding back EUR
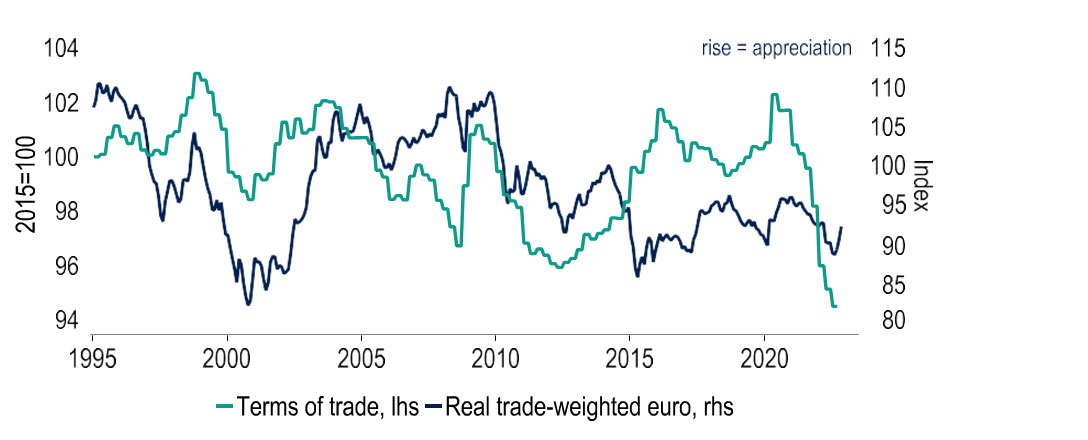
Source: Eurostat, ECB, Macrobond and Investec
Hence the need to engineer a labour market slowdown through higher rates remains, in the expectation that this helps cool wage growth and therefore lowers cost and price pressures. We continue to see a 50bp rate hike in March. But we also still anticipate a slowdown in the pace of tightening to 25bps at the next (May) meeting, and rate hikes to pause thereafter for the remainder of the year, giving a peak ECB Deposit rate of 3.25%, with rate cuts only from spring 2024 onwards.
Chart 15: Euro area wage growth has picked up markedly, whichever measure is used
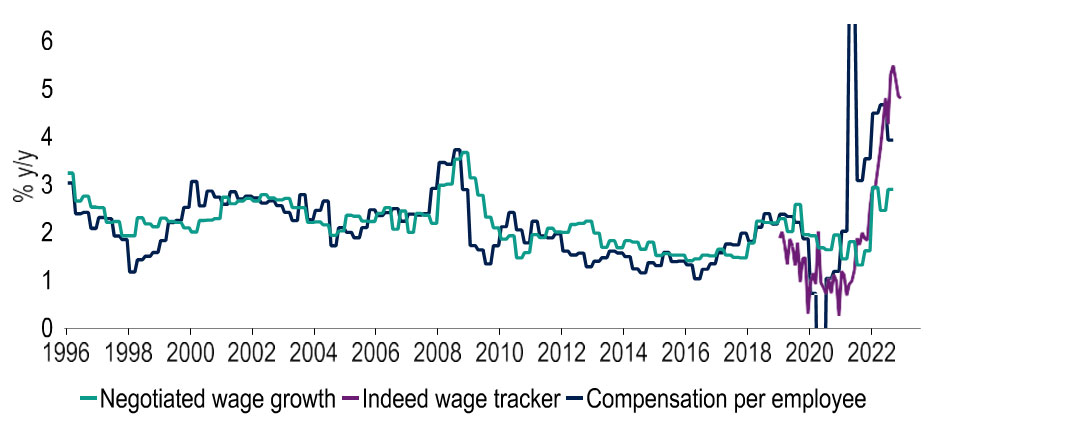
Source: ECB, Indeed, Macrobond and Investec
This is because there are incipient signs of higher rates starting to cool activity, if not yet the jobs market. Specifically, the ECB’s monthly loan figures show annual loan growth to the private sector in January to have slowed to its lowest level since March ‘22 (+4.9% y/y). Moreover, the ECB bank lending survey for Q1 reported a plunge in loan demand by both businesses and especially households in Q4, chiefly driven by higher interest rates as well as deteriorating expectations (Chart 16). As these effects build, and crucially as the labour market starts to soften too, the Governing Council will be aiming not to tighten the screws more than necessary.
Chart 16: Interest rates are now weighing on bank loan demand by firms
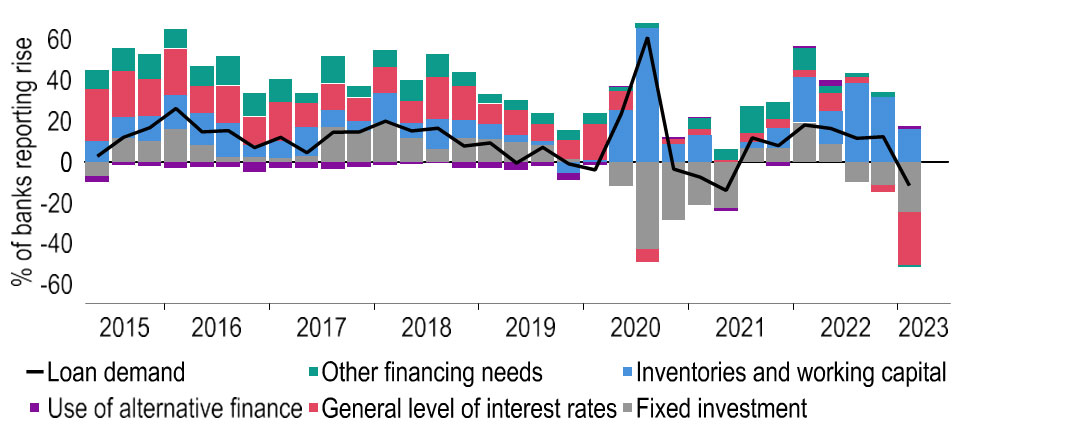
Source: ECB, Macrobond and Investec
From the perspective of inflation, after a long string of upside surprises relative to the ECB’s Staff Projections, we see the outlook developing better than the latest (December) forecasts (Chart 17). Indeed, we would expect the March HICP Staff Projections to be revised lower relative to December’s. January inflation, at 8.6%, was clearly below the 9.1% average the ECB predicted for Q1. Already by Q4 this year, we could see inflation rates of below 3%, as Fabio Panetta (one of the more dovish ECB members) has acknowledged. Even so, forward-looking though monetary policy is, risk management considerations, with core inflation yet to peak, argue for raising rates somewhat further for the time being.
Chart 17: The string of upside revisions to ECB inflation projections could be broken
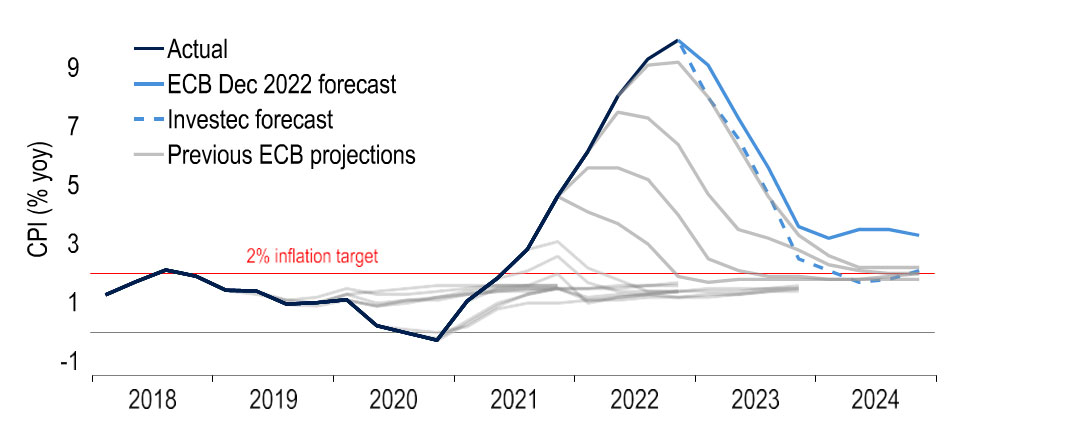
Source: ECB, Macrobond and Investec
In our view, it will be only in early 2024 that the ECB will be comfortable enough to reverse course and take back some of what look less restrictive rate settings than elsewhere. In time, the contrast of this with prospects of steeper rate cuts in the US in particular is likely to help the Euro recover ground against USD, as part of a wider dollar move. A further helpful factor for the single currency will be the reduced import bill, as a result of lower gas prices improving the terms of trade. Our forecasts envisage EURUSD to end 2023 at 1.12 and 2024 at 1.18. Against sterling we foresee little change, anticipating year-end levels of 90p in both 2023 and 2024 (Chart 18).
Chart 18: EUR is likely to gain ground as USD loses its shine
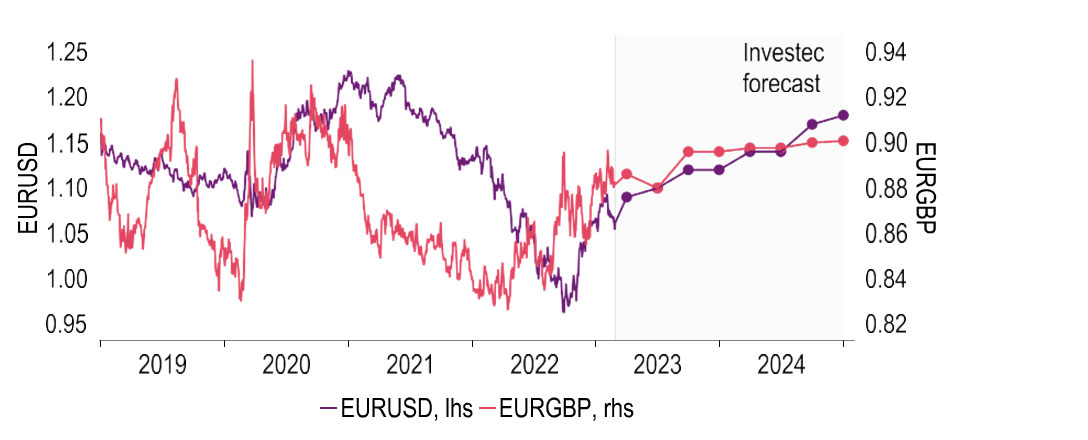
Source: Macrobond and Investec
United Kingdom
CPI inflation now stands at 10.1% (January), exactly 1% point lower than October’s peak, helping to confirm that the worst of the inflationary storm has passed. Our latest forecasts show inflation falling back to 6.4% in Q2, 1.6% in Q4 this year and 1.8% in Q4 2024. The rapidity of this drop mainly reflects sharp declines in wholesale gas prices, our assumption being that spot prices evolve as current futures suggest. But in terms of monetary policy the Bank of England, in common with the Fed, is looking closely at a ‘core services’ measure to gauge the strength of underlying price pressures. This is currently at 6.1% and we envisage it easing back to 3.1% by end-2024.
Chart 19: CPI and ‘core services’ inflation are set to fall further this year
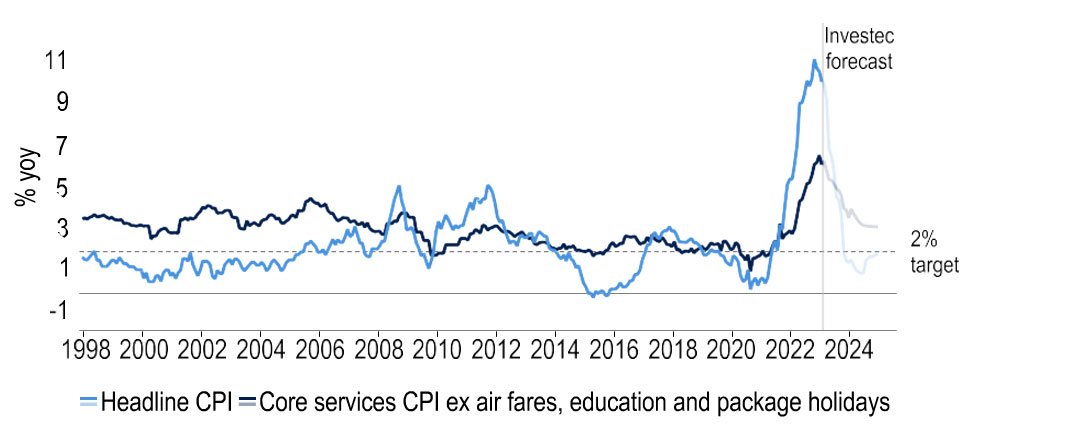
Source: Macrobond, Investec
Labour market trends are likely to be the key here, given that wages make up a particularly material proportion of service sector firms’ costs. The labour market remains tight. Unemployment stands at 3.7%, close to a 48-year low, with private sector regular earnings growth running at 7.3% (yoy), its highest since the series began in 2001, barring pandemic related distortions. But we still see a UK recession and the jobless rate pushing above 5% by early 2024, reinforced by a recovery in labour participation. Our Phillips Curve estimates imply pay growth dipping below 5.0% towards the end of this year, driving the moderation in core services inflation referred to above.
Chart 20: The Phillips curve has moved out since the pandemic – back to pre-2013 levels??
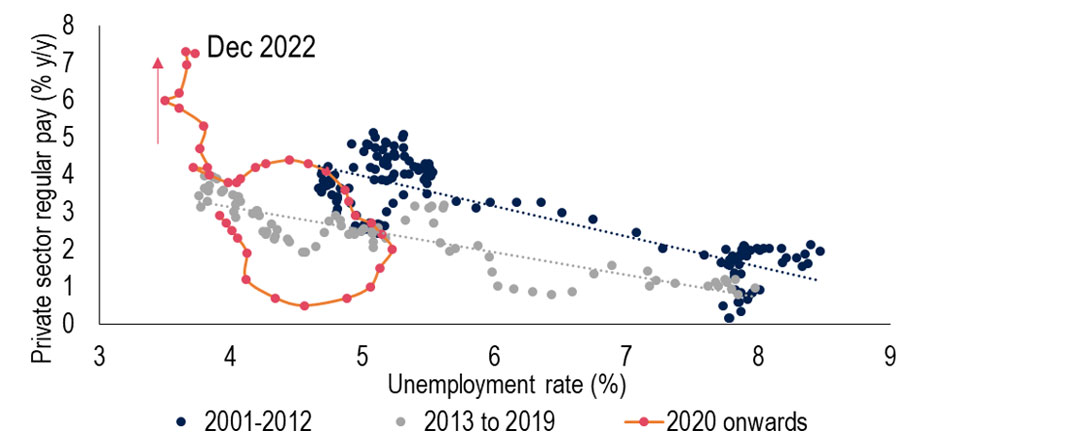
Source: Macrobond, Investec
European gas prices have fallen sharply since last summer. This helps UK public finances as well as inflation prospects. Our Utilities team calculates that at current futures prices, the domestic energy cap will fall to an average of £2178 in H2 this year, below April’s planned Energy Price Guarantee threshold of £3000. Even if the government kept the EPG limit at £2500, the subsidies budgeted for would no longer need to be paid. Second, in H1 this year, a 129% y/y rise in consumer-level gas prices plus the mild weather seem to have resulted in less gas consumption than expected (Chart 21), also implying lower government outlays than budgeted. In all, data on the public finances suggest that borrowing will comfortably undershoot the OBR’s £177bn deficit forecast for this year, sparking hopes of tax cuts next year.
Chart 21: Gas consumption has been lower for any given temperature since October (red dots)
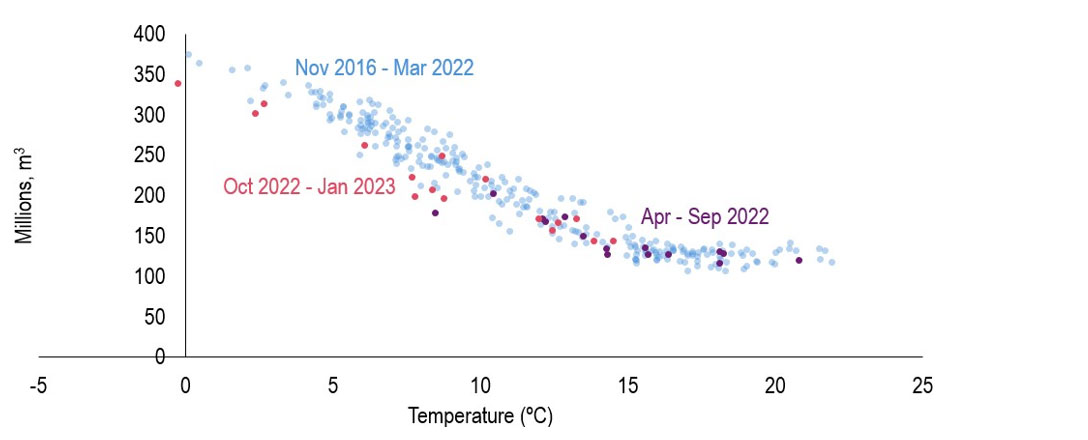
Sources: Macrobond and Investec
A recession was avoided in H2 2022 as GDP was ‘flat’ on the quarter in Q4, after Q3’s 0.2% fall. But GDP figures have seen hefty revisions recently and so this can change. Indeed, business investment has been revised up heavily - the level for Q3 last year is now some 4% higher than before. Pressure on the consumer and a (still) sluggish global economy continues to point to a recession over 2023, but we now expect a shallower downturn in Q1- Q3. Our GDP forecast is upgraded to -0.5% from -1.0%. We also recognise upside risks to demand from, for example, households running down their stocks of excess pandemic savings which we estimate to be £154bn, or 10% of annual consumer spending.
Chart 22: Business investment was revised sharply higher between Q1 and Q3 2022
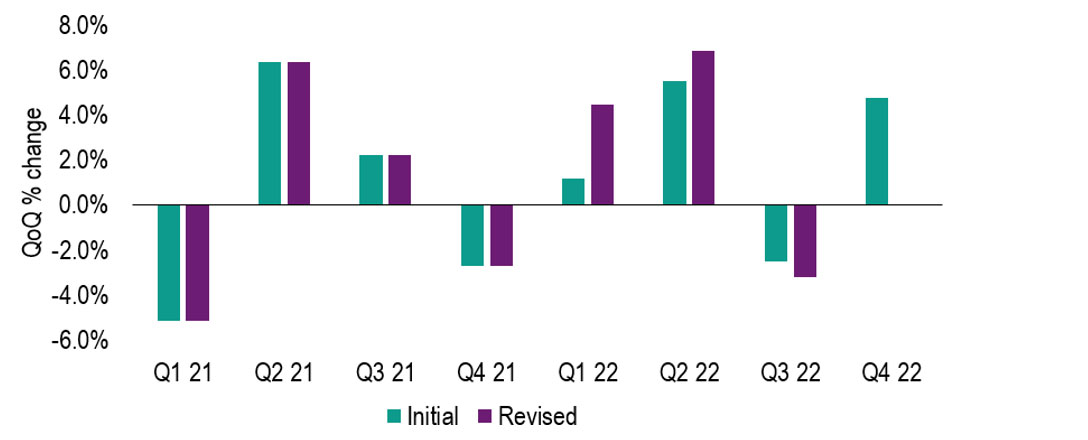
Sources: Macrobond and Investec
The MPC raised the Bank rate by 50bps to 4.00% on 2 Feb, but its guidance was equivocal on the need for further hikes. UK interest rate markets reacted positively, as they did to the news that inflation had fallen to 10.1%. Sentiment though has since been reversed by the global tide of strong US data. UK market policy rate expectations are now for a Bank rate peak of 4.75%, their highest so far this year. We predict upside risks from a tight labour market to prompt another 25bp hike in March, but expect that to be the peak as the economy contracts and headline inflation falls sharply. Indeed, unless proved wrong on the economy, we still see the Bank rate coming down this year as the MPC is able to justify a less restrictive stance of policy.
Chart 23: Market Bank rate expectations have risen recently but not back to late 2022 levels
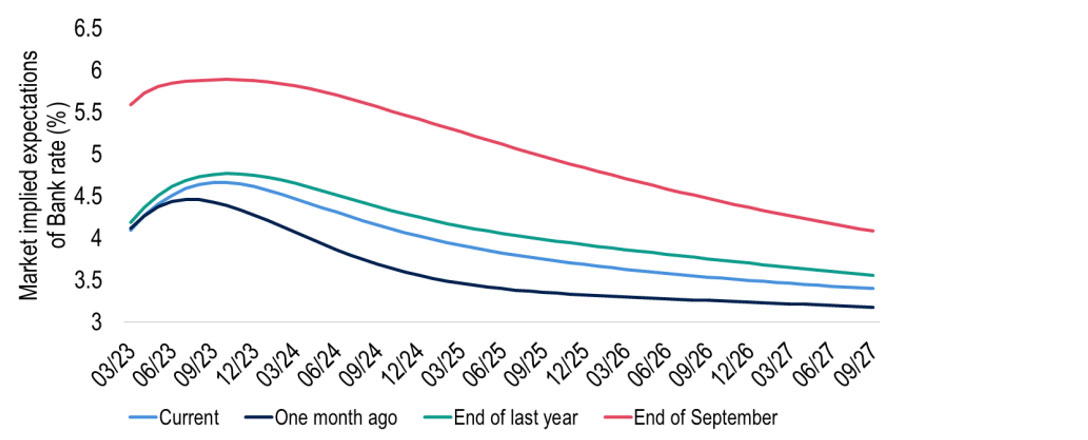
Sources: Macrobond and Investec
Sterling has come under pressure over the past month, with cable dipping below $1.20. This partly reflects the resurgent dollar, but the perception that the UK economy is performing badly relative to its peers has prevented gains against the euro. Our end-2023 targets of $1.25 and 90p (against the euro) remain intact. We had identified a second independence referendum in Scotland as a possible downside threat. But a move in this direction has probably receded further after Nicola Sturgeon’s resignation as SNP leader. This could help to reinforce Labour’s comeback in Scotland, where it won just one seat at the 2019 General Election, giving it further impetus towards an overall majority at the next election.
Chart 24: Will Labour recapture Scottish seats from the SNP at the next General Election?
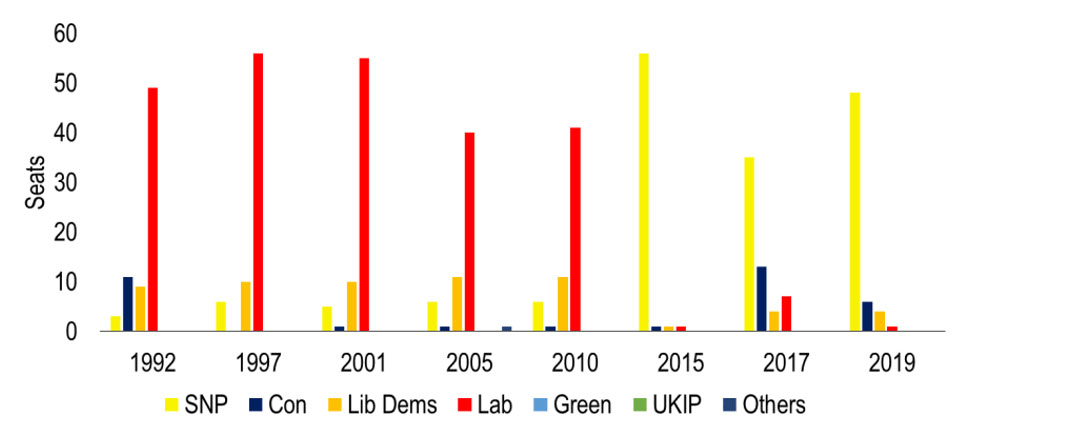
Sources: Macrobond and Investec
Get more FX market insights
Stay up to date with our FX insights hub, where our dedicated experts help provide the knowledge to navigate the currency markets.
Browse articles in
Please note: the content on this page is provided for information purposes only and should not be construed as an offer, or a solicitation of an offer, to buy or sell financial instruments. This content does not constitute a personal recommendation and is not investment advice.