
Turmoil across the banking sector, including the failure of SVB and the forced takeover of Credit Suisse, has erased the positive economic sentiment ushered in by 2023. The authorities have responded quickly via generous liquidity provision, (some) higher deposit guarantees and in Switzerland the speedy resolution of CS. Such prompt actions should be enough to help stave off another GFC. Indeed ‘liquidity provision’ is as much about engendering confidence as supplying readily available assets. Even so we are concerned that banks will tighten lending standards, hitting growth – central bank surveys suggest that credit standards had already become more restrictive well before recent events. Bank regulation seems certain to be reformed again – despite being the 16th biggest bank by assets, SVB was not stress-tested by the Fed last year. Also CS’s metrics included a seemingly healthy CET1 ratio of 14.1% and Liquidity Coverage Ratio of 150%. Talk of needing to hold still greater buffers of liquidity is already doing the rounds.
As it stands the US appears to be at the centre of the storm in regard to the current banking turmoil, with particular concern over the health of the regional banking system. Despite the risks to financial stability, with inflation in mind the Federal Reserve went ahead with a 25bp hike to the Federal funds target range in March, but hinted at a policy pause in the near-future. We have maintained our call for one more quarter-point move, to 5.00-5.25%, but do now see a rate cut from the Fed by end-year. This is driven by our slightly weaker projections for theeconomy, having downgraded both our 2023 and 2024 GDP growth forecasts by 0.1%pt to 1.0% and 0.6%, respectively, in part due to the suspected tightening in credit conditions stemming from the current banking woes.
Market volatility and concerns over banks have also hit the Euro area, culminating with UBS’s purchase of Credit Suisse. Despite market conditions the ECB followed through with a 50bp hike, but the future path of rates very much depends on financial market conditions as well as inflation. We look for one more 25bp hike to 3.25% in May, before a pause as H2 2023 presents a clear picture of inflation falling and a tightening in credit conditions which began before the current market stresses dampens demand. Our forecasts for GDP envisage the EU20 skirting a recession, with GDP forecast at +0.5% in 2023 and +1.1% in 2024.
Near-term momentum in the UK economy looks stronger; and the Budget set fiscal policy on a less restrictive course. But although the UK has entered banking sector turbulence on what ought to be a relatively resilient footing, and not directly experienced banking failures, its bank shares too have suffered. Overall, and despite disappointingly high inflation, we have thus raised our terminal Bank rate projection by a sliver, to 4.50%, as we expect tighter credit conditions to do some of the work that otherwise might have had to be done via extra rate hikes. We still anticipate steep falls in actual inflation to allow rate cuts in due course, but have pushed back the timing of the first move to November. Our ’23 GDP forecast israised by 0.2%pts to -0.3% but our ’24 forecast cut by 0.1% to +0.9%.
Global
Up until mid-March, the story of the global economy in 2023 so far had been one of increasing optimism. Energy prices, notably European gas, have plummeted. In addition, improving official data and strengthening survey evidence were suggesting that Beijing's reversal of its zero-Covid policy had resulted in recovering demand. The past few weeks have put those trends to the sword. The collapse of Silicon Valley Bank and Signature Bank was followed by a shotgun wedding between Credit Suisse and UBS. Markets have experienced a tidal wave of volatility (Chart 1) with fears expressed over contagion sweeping across the banking system.
Chart 1: Daily movements in mid & end-2023 US rate (Fed funds) expectations have been wild
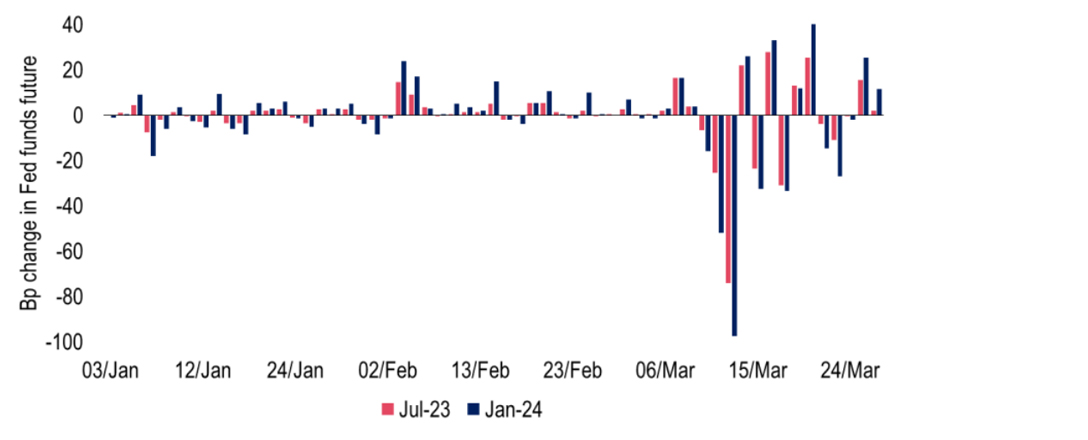
Source: Investec, Bloomberg
Global banks are in far better shape than before the 2007/08 Global Financial Crisis. We note though that CS’s woes occurred despite a relatively healthy CET1 ratio of 14.1% and a Liquidity Coverage Ratio of 150%. A lesson learnt during the GFC is that liquidity is as much about confidence as about volumes of available cash. In this respect the comforting effect of the Fed’s actions to provide term liquidity and daily USD swap lines with other central banks are critical. The consequences of institutions’ losses from exposures to failed banks (note, for the time being at least, NOT depositors’ losses) will come to light from time to time and other banks may well find themselves in difficulties. But prompt actions by the authorities should ensure that the current episode is not systemic.
Chart 2: Implied volatility of US Treasuries has soared, that of equities not so much
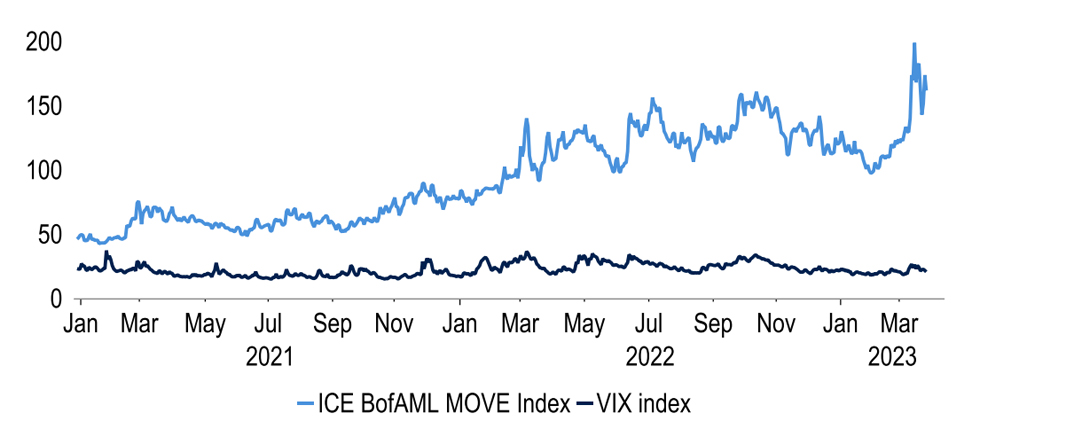
Source: Investec, Bloomberg, Macrobond
What we are wary about though is that banks’ concerns over their liability bases will result in their adoption of more cautious lending policies. This could be especially the case with smaller banks, which in the US have suffered deposit outflows to larger banks. At the wholesale level, our dashboard of money market strains has shown much volatility, with spreads (at times) reaching elevated levels (Charts 2&3). For example, USD 1y Libor/OIS swap spreads widened beyond 90bps earlier this month, indicating discomfort with term lending in interbank markets. This specific metric has since normalised, but the chances are that a return to cautious conditions would filter through to the retail space.
Chart 3: 1y LIBOR/OIS spread (bps) – considerable volatility has been seen in recent weeks
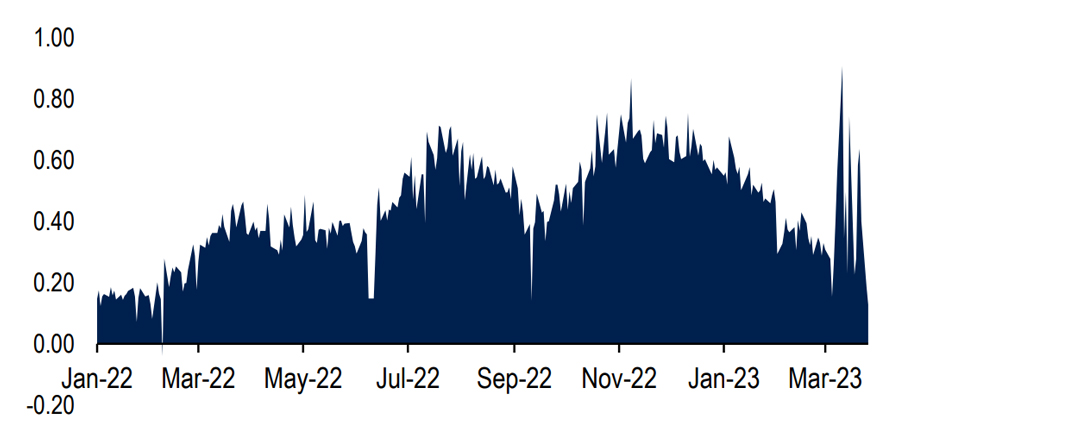
Source: Investec, Bloomberg
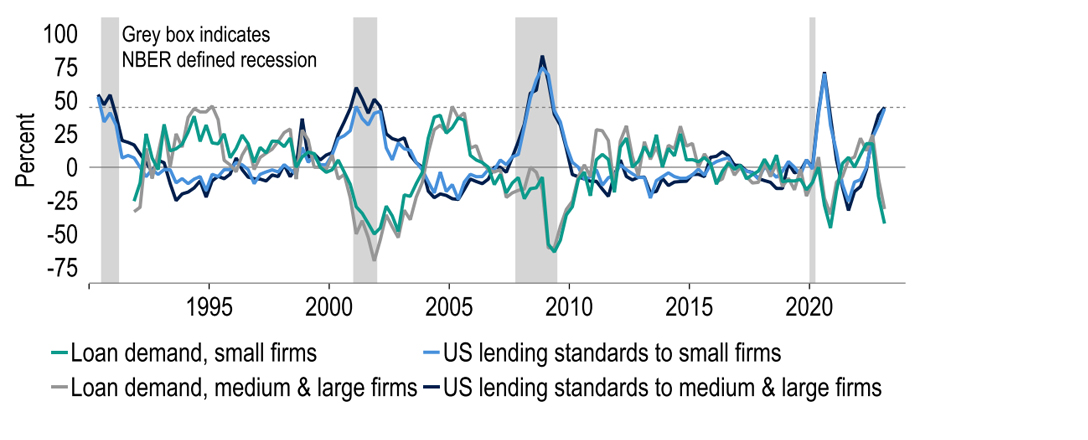
In fact, banks had already begun to tighten credit conditions well before the current turmoil. Recent surveys of bank lending attitudes by the Fed, ECB and BoC show a less ready supply of loans to firms. Meanwhile although the BoE reported overall conditions unchanged from the previous quarter, banks were expected to reduce availability over the following quarter. Similarly from the perspective of lending to households, the surveys either reported that conditions had been or were about to be tightened. Loan demand also seems to be weakening in the Euro area and the UK and a further realignment of lending standards could result in a material impact on economic activity.
Chart 4: Central bank surveys have shown a tightening in bank lending standards to firms
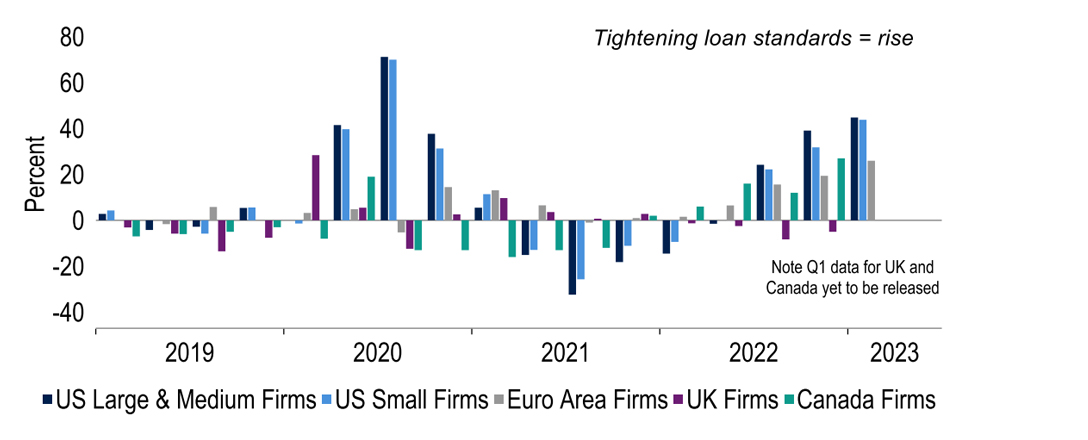
Source: Investec, Macrobond
In the absence of the latest bank-related uncertainties, we might have lifted our GDP and interest rate forecasts higher. But our latest call is that better economic momentum in the rear-view mirror and tighter credit standards ahead broadly offset each other, although we have nudged down both our 2023 and 2024 global GDP forecasts to 2.6% and 2.9%. Without global contagion we judge that the US takes the brunt of the adjustment – we now see the Fed cutting rates from this year and have downgraded our USD forecasts. Note that in 2008, markets at first sold the USD, believing it to be a US based event before realising the global nature of the shock, resulting in the dollar benefiting from safe-haven status.
Chart 5: USD eventually rallied post Lehman Bros, when markets realised it was a global event
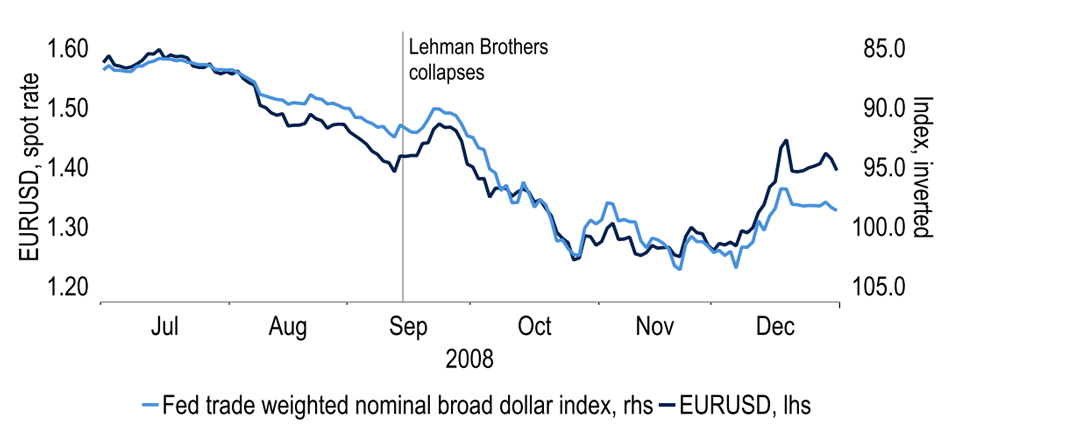
Sources: Investec, Macrobond
For now there are more questions than answers. But it seems most likely that by ‘acting early and acting big’ the authorities are shoring up confidence and liquidity levels sufficiently to avoid a 2008-style implosion. A final point is that the global authorities will undoubtedly want to revisit the stringency of their bank supervision regimes. For example, in the US although SVB was the 16th largest bank by assets, it was not one of the 34 banks stress-tested by the Fed last year. But both SVB and Signature had to be made Systemic Risk Exceptions to protect all depositors while the banks were put into resolution. Exactly how (and where) supervision will be made more rigorous though is yet to be seen.
Chart 6: SVB – a large US bank, but not stress tested
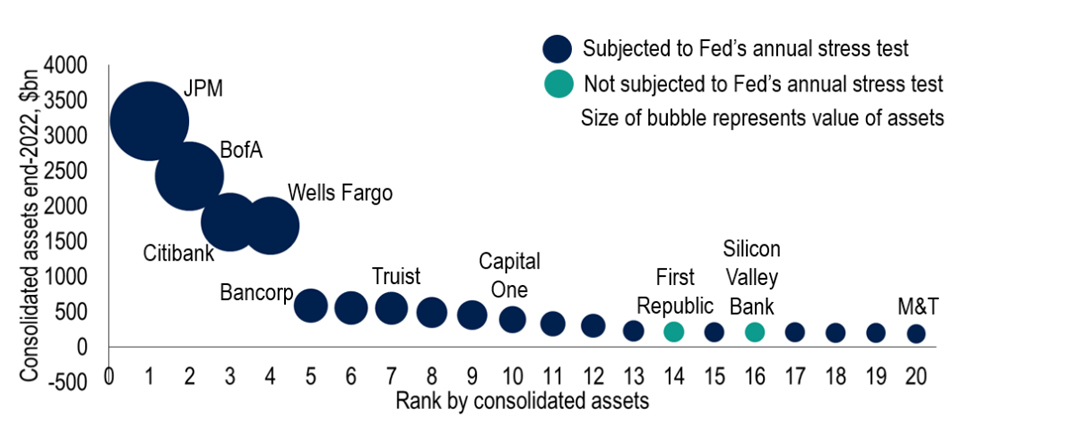
Source: Investec, Federal Reserve
United States
Economics 101 should teach you that under the weight of an aggressive set of interest rate rises it is likely that something will crack. Such a reckoning point came this month as distress spread across the financial system, starting with SVB (Chart 7) and then spreading to other regional banks in the US and across the Atlantic with the demise of Credit Suisse. After a turbulent couple of weeks in markets, the situation seems to have calmed, with deposit flows stabilising. This is unlikely to be the end, however, with concern about the financial stability of US regional banks still rife. Yet we do not envisage this to be the start of a systemic banking crisis similar to 2008/09.
Chart 7: The twelve days of banking turmoil, what comes next?
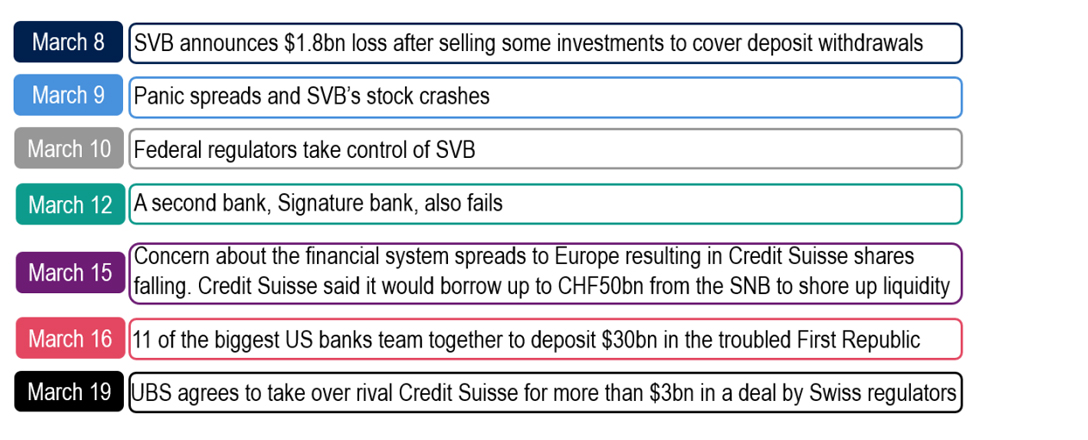
Sources: Investec
Part of this assessment is thanks to the Fed’s quick intervention in response to the financial difficulties. On March 12 the Fed announced its new emergency lending programme, the Bank Term Funding Program (BTFP), to help ensure that banks have adequate liquidity to meet withdrawal requests, aiming to increase confidence in the banking system and prevent the sort of bank runs that contributed to the collapse of SVB. The programme offers loans of up to one year in length to borrowers that pledge collateral. This is in addition to the existing discount window, which offers loans up to 90 days. In all Fed emergency lending to the banking sector has reached levels not seen since the GFC (Chart 9).
Chart 8: Fed’s quick intervention to prevent contagion effects
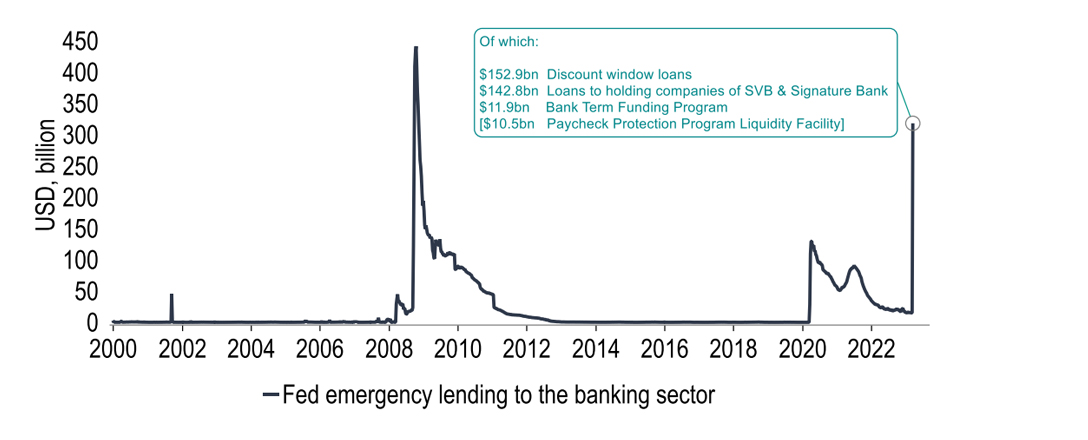
Latest data is for week ending March 22
Source: Investec, Bloomberg, Macrobond
Although these emergency measures will indeed increase the size of the Fed’s balance sheet at a time when it is aiming to shrink it, it is important to distinguish the BTFP from Quantitative Easing. Broad money is not being created and the Fed is not buying the collateral. Once the loan is repaid, the Fed’s balance sheet will shrink once again. There is a question however whether these measures will be enough to restore confidence in the banking system and prevent a looming credit crunch. Indeed, even before the news of SVB, credit conditions were tightening to levels that would typically precede a recession (Chart 9). We wait with bated breath for the next SLOOS* update.
Chart 9: Credit conditions were deteriorating even before news of potential banking crisis
*SLOOS = Senior Loan Officer Opinion Survey, which assesses lending conditions in the US
Source: Investec, SLOOS, Macrobond
But despite the banking woes the FOMC opted to press ahead with a 25bp hike last week focusing on the inflation risk, whilst sending a signal of business-asusual to markets. Fed Chair Powell did reveal however that a policy pause was considered and with the recent hike, the days of the Fed lifting interest rates in this cycle seem limited. This was evidenced by the softer language used in the forward guidance: the Fed now states that ‘some additional firming may be appropriate’, with emphasis on the ‘some’ and ‘may’. This is an extraordinary turn of events from just a few weeks ago, where Powell’s hawkish semi-annual testimony stoked market expectations for rates to reach near 6%!
Chart 10: Market rate pricing - a lot can change in two weeks
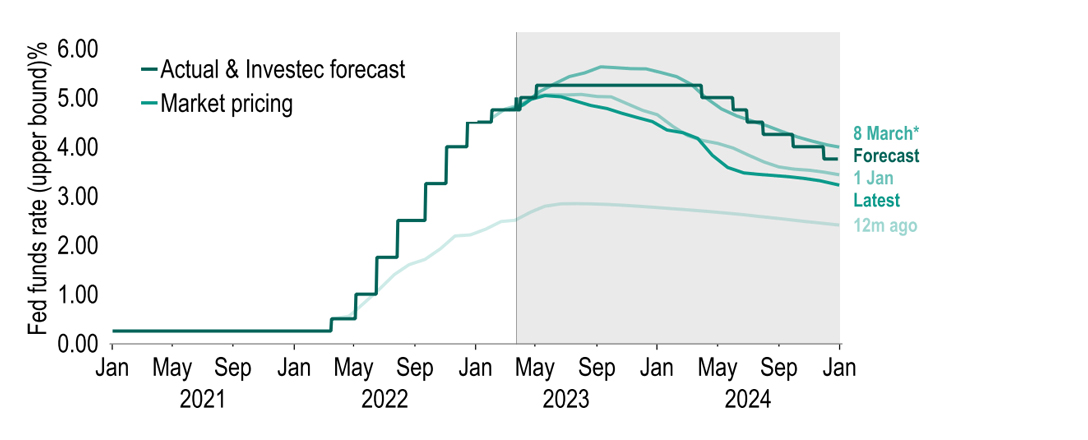
*8 March is the day after Chair Powell delivered his semiannual testimony, suggesting rates could be lifted by half a point.
Source: Investec, Macrobond
Indeed, at the start of the month the Fed’s tunnel focus was price pressures, as financial pressures grew in the shadows. As such, when labour market and activity data came in far hotter-thanexpected for January, particularly nonfarm payrolls, and then remained strong in February (pouring some cold water on the weather-swings argument) the immediate question was whether the Fed needs to do more to tackle the upside risk to inflation. Yet the Feb NFP data was accompanied by more reassuring results from the alternative household survey, with both the unemployment rate and labour participation rising. Moreover, headline CPI inflation fell once again in February, now 3.1%pts below its peak.
Chart 11: February activity data was a mixed bag, is the economy cooling?
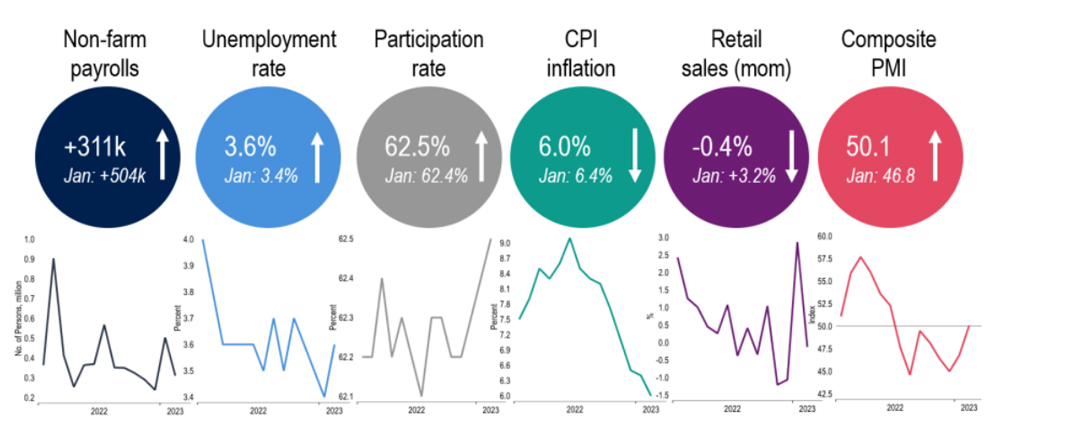
Note: We have since had composite PMI for March which jumped to 53.3.
Source: Investec, Macrobond
For our own forecasts, although economic data have as a whole started the year healthier than we would have expected, the troubles in the banking sector does cloud the outlook. On balance, due to the impact the tightening in credit conditions is likely to have on economic activity, we see a slightly more subdued economic outlook than before. We have downgraded our 2023 and 2024 GDP forecasts by 0.1%pts to 1.0% and 0.6%, respectively. The readthrough to interest rates is that we now see a greater risk of rate cuts this year and have pulled forward our first rate cut to Dec this year (prior: Mar’24), but have held our peak Fed funds target range at 5.00-5.25%, i.e. one more 25bp move.
Chart 12: US economy is losing momentum; banking sector woes will not help
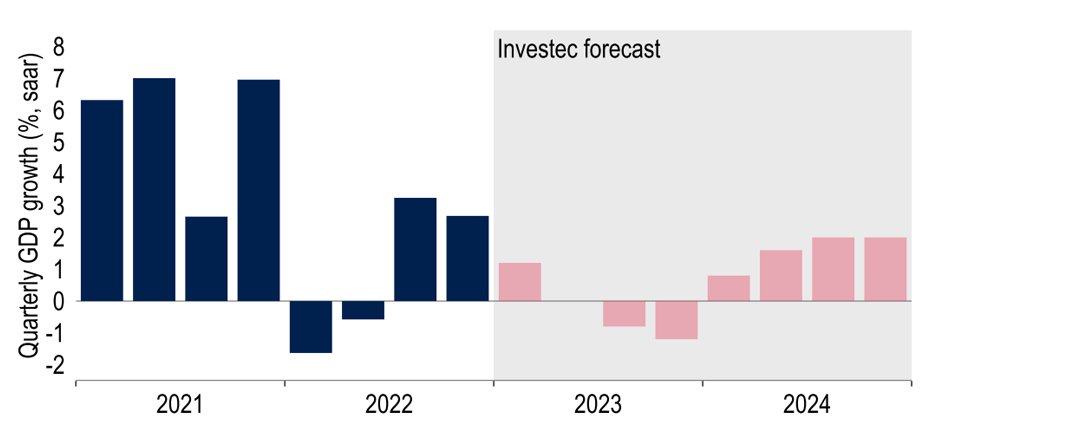
Source: Investec, Macrobond
Eurozone
March saw significant market volatility return to European shores as concerns over the global banking system intensified. 2yr Bund yields for example recorded their biggest one-day move on record (-52bps) on 15 March as worries over Credit Suisse intensified and which culminated the following weekend with UBS agreeing to buy it for CHF0.76 per share. We judge that the current crisis of confidence is not a systemic one given that banks are in a more robust position than in the past. For example, capital and liquidity ratios are well ahead of regulatory minimums, with average CET1 and LCR ratios standing at 15% and 163% respectively. Nonetheless sentiment may remain fragile.
Chart 13: March has been a difficult month for equities and bonds in the Eurozone
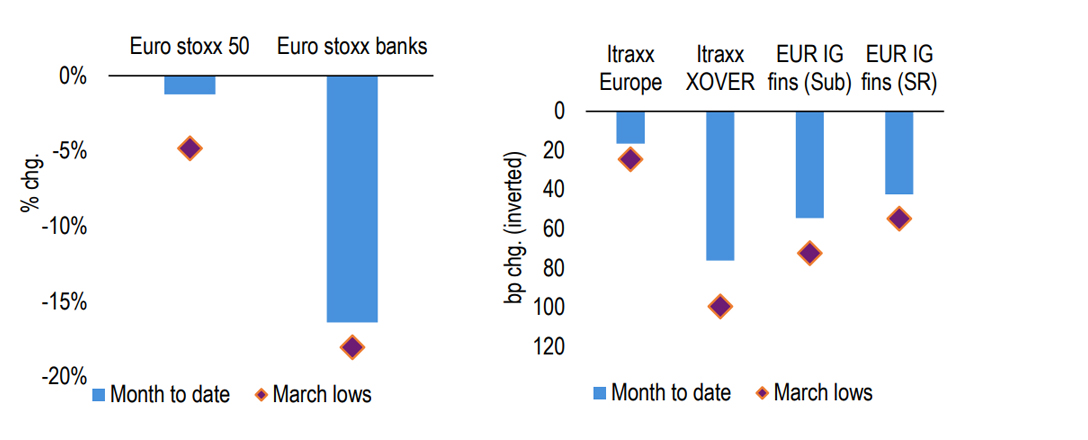
# iTraxx Europe- references CDS on 125 most liquid IG-rated entities, XOVER- 50 non-IG rated, EUR IG fins-European financials (investment grade) bond spreads (senior - SR and subordinated- sub)
Source: Bloomberg
Consequently, the outlook for ECB policy is less clear. March’s meeting saw it follow through with its well-telegraphed 50bps hike, lifting the Deposit rate to 3.00%, but it left future moves open to economic and financial conditions. As noted, we do not believe that the current banking worries will evolve into a systemic crisis, meaning financial uncertainties should subside. If so, the ECB is likely to hike rates a little further, although to our mind not to the 4% terminal rate which was being priced into the curve before the banking woes. Our baseline view is that the ECB will enact one further 25bps hike at the May meeting and therefore see a peak of 3.25%. There are reasons to be cautious: even if financial market volatility eases, it is a reminder that aggressive rate rises risk something breaking.
Chart 14: Market expectations for ECB rates have changed markedly over the month too
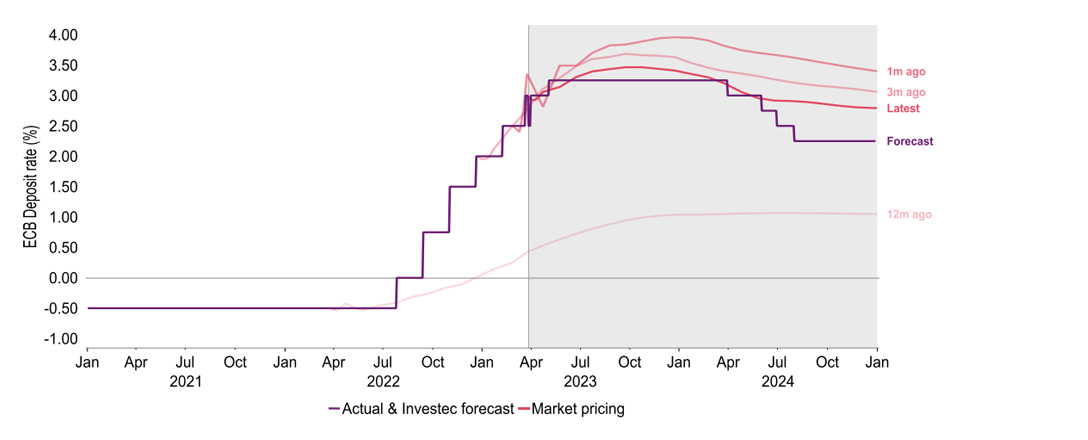
Source: Investec, Macrobond
And as President Lagarde stated there is no trade-off between financial and price stability. At the same time we continue to expect clear evidence of inflation moderating as we progress through the year, our forecasts standing at 3.3% in Q4, as energy effects wane and cumulative ECB tightening bears fruit. The ECB’s own March forecasts, as expected, downgraded the profile for headline HICP, by 1%pt in 2023 and 0.5%pts in 2024 to 5.3% and 2.9%, whilst HICP is expected to hit the target in H2 2025. However, it is core HICP that is gaining the most attention having hit a record 5.6% in February.
Chart 15: The ECB has revised down its inflation forecasts for the first time since June 2020
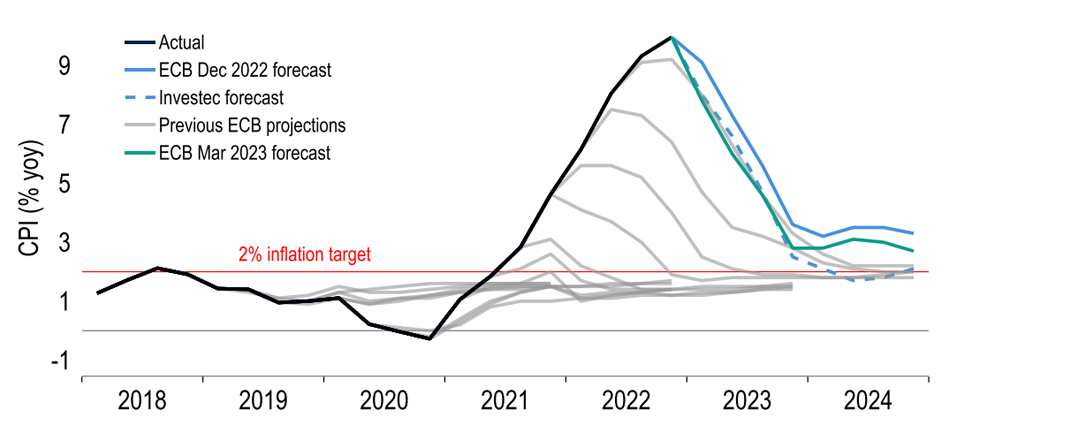
Source: Macrobond, ECB and Investec
But aside from an upgrade to 2023 the rest of the profile was downgraded by 0.25% on average. Notably these forecasts were predicated on rates of 3.25%, suggesting a little more tightening was needed. However, as Lagarde made clear, they were finalised before the recent market turmoil, which when taken into account is likely to be disinflationary. In fact financial conditions were already beginning to tighten as evidenced by the ECB’s last Bank Lending Survey, where the reported net tightening in credit standards was the greatest since the Euro debt crisis. In fact, the net balance of banks reporting tightening standards (26% corporate, 21% households, Q4’22) has only been seen during recessionary periods.
Chart 16: Euro area credit conditions have been tightening
# ECB bank lending survey- credit standards to corporates
Source: Investec, Macrobond, ECB, Bloomberg
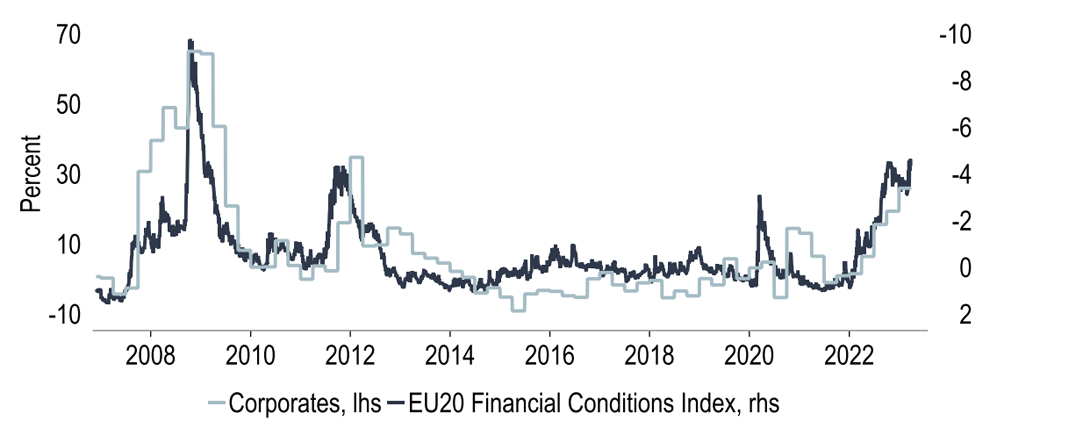
Taking together various dimensions of monetary data does suggest that cumulative ECB rate rises are beginning to have an effect. Lending to the real economy has already slowed significantly in recent months; and the latest developments are likely to prompt a further tightening in conditions, ultimately dampening demand. It is still too early to make a definitive call on the economic hit. At present we suspect that the EU20 will just about skirt a recession, the headwinds from tighter credit conditions offsetting what would have otherwise been an upgrade in our forecasts due to more resilient data.
Chart 17: M3 bank lending flows to households and corporates have been weakening
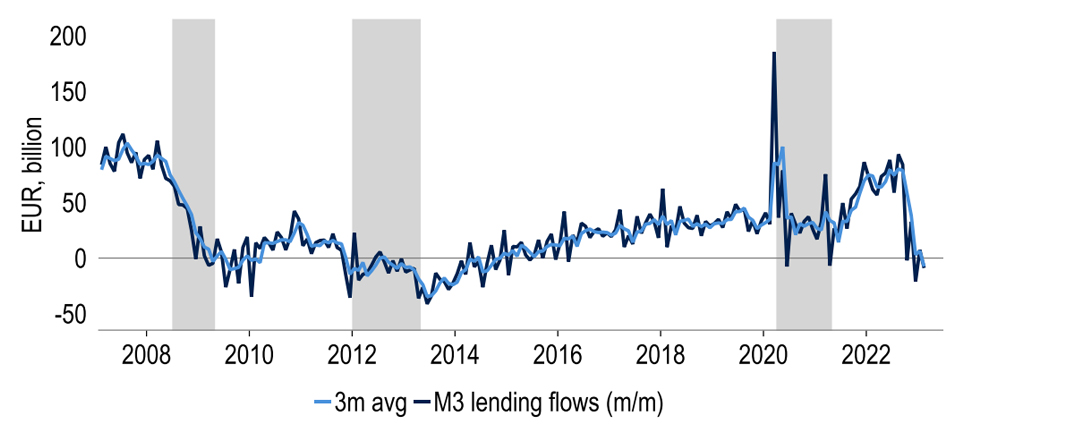
Source: Investec, Macrobond, ECB
As such our GDP forecasts stand at 0.5% (2023) and 1.1% in 2024 At the same time our market forecasts are set against elevated levels of uncertainty, especially in rates where, bar a spike last year, implied volatility surpasses the peak during the pandemic and is at its highest level since ‘08/’09. EUR:USD volatility by comparison has been more restrained. We have made only make small changes to our forecasts but did nudge up our expectations for a rising euro. This was driven by our expectation of a US recession, which may prompt the Fed to cut rates. Additionally, we suspect that banking worries will remain more US focused, also weighing the USD. As such our end-’23 and ’24 EUR forecasts stand at $1.14 and $1.18 respectively.
Chart 18: Uncertainty in markets is high, judging by interest rate (and EUR:USD) volatility
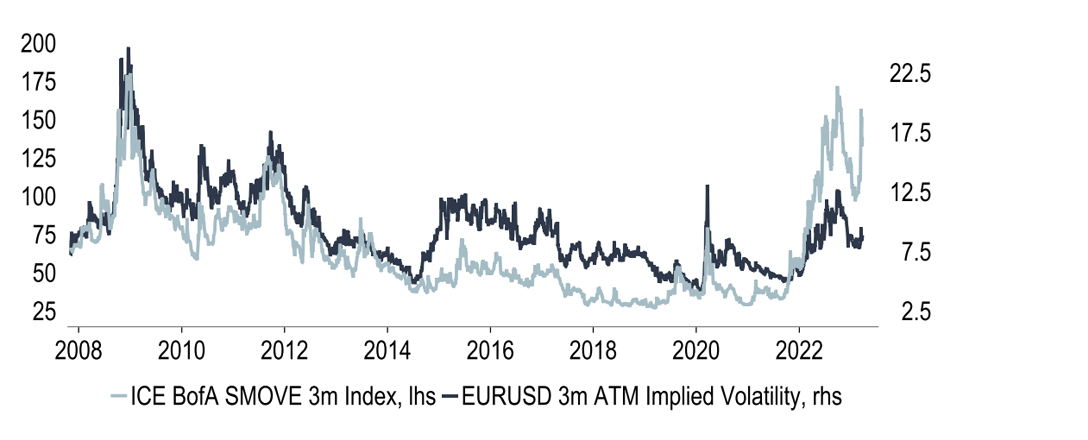
# SMOVE- EUR yield curve weighted implied volatility on 3m swaptions
Source: Investec, Bloomberg, Macrobond
United Kingdom
The UK has, to date, avoided the direct bank failures seen in the US and in Switzerland. That is not to say its banking sector has been unscathed, however. Banks’ shares have plunged steeply, far outpacing non-bank equities (Chart 19); the UK authorities have facilitated a quick sale of SVB’s business in the UK to HSBC; and the BoE has stepped in to provide reassurance, akin to that issued by the European Banking Authority, that the hierarchy of the capital structure in the UK would see shareholders taking losses ahead of bondholders in a banking resolution, subject to prospectus provisions for individual instruments.
Chart 19: UK bank shares have far underperformed under equities, despite no bank failures
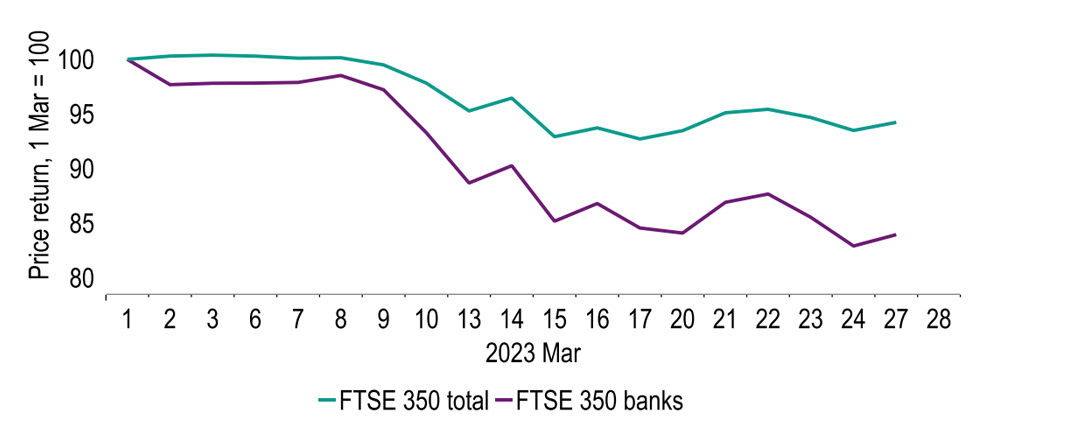
Source: Macrobond and Investec
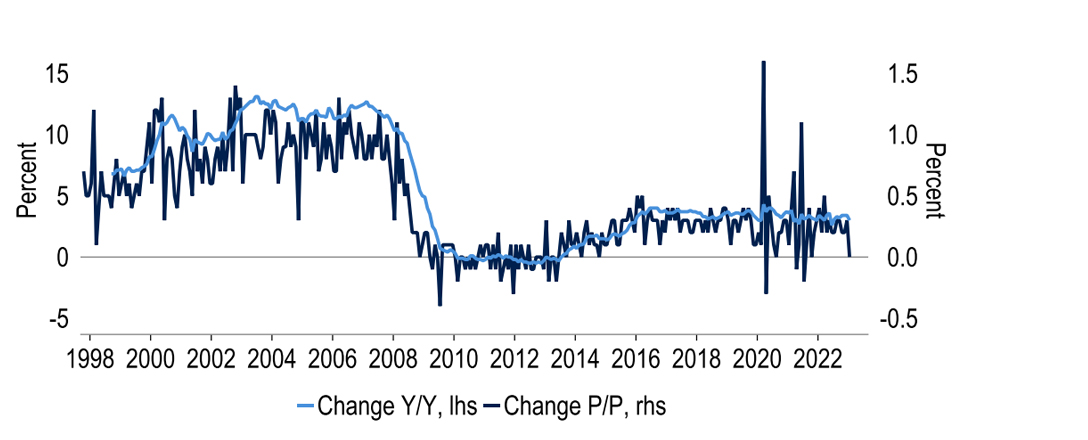
Immediate monetary policy implications, though, have been limited. The MPC appeared reassured by the briefing it had received by the BoE’s Financial Policy Committee that the UK banking system remained resilient (Chart 20), leaving it free to focus on its main objective of bringing inflation back down to target. Spooked also by a 0.6%pt upside surprise in Feb inflation, and fears that a stronger-than-expected labour market may make high inflation persistent, it hiked the Bank rate by 25bps to 4.25%. We suspect that tighter credit conditions due to the banking crisis will bear down on inflation. But the MPC may await evidence, not just forecasts, of steeply falling inflation before halting tightening. A final 25bp rate hike in May looks likely.
Chart 20: The major UK banks’ CET1 capital ratios, in aggregate, are far above GFC levels
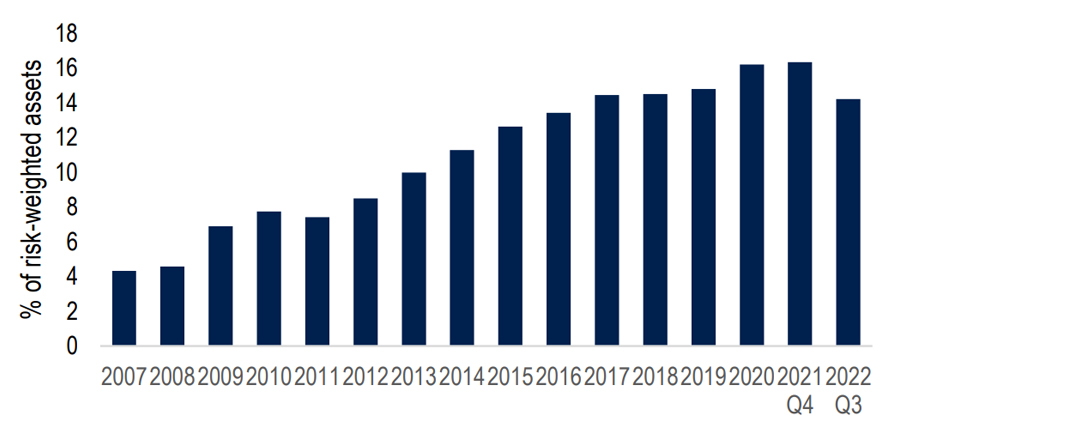
Note: The major UK banks are Barclays, HSBC, Lloyds Banking Group, Nationwide (Building Society), Natwest Group, Santander UK, Standard Chartered and from end-2020, Virgin Money UK. Prior to 2011, the chart shows BoE estimates of banks' CET1 ratios.
Source: Bank of England and Investec
The aim of the authorities is to avoid the prolonged slump in lending to households and firms that took place in the GFC (Chart 21). We are tentatively of the view that tighter regulation and proactive intervention will avert a banking and credit crunch. But we expect that banks’ loan supply will nonetheless become more restrictive, constraining GDP and doing some of the work that the MPC would otherwise have done through extra rate hikes. Market pricing would seem to agree. At the start of March, a peak Bank rate of 4.70% and an end-‘23 level of 4.68% was priced in; now these are 4.56% and 4.43%. If inflation expectations continue to recede, room for rate cuts to a less restrictive policy stance ought to open up.
Chart 21: Bank lending to the non-financial private sector was in the doldrums post-GFC
Source: Bank of England, Macrobond and Investec
That said, a complicating factor for the MPC is that fiscal policy is acting in the opposite direction. Ahead of his Budget, Chancellor Hunt was presented with a £24bn annual reduction in projected borrowing from 2024/25, as lower energy prices have improved the GDP outlook and lower interest rates have cut projected debt servicing costs. But he spent two thirds of this windfall (Chart 22). Although supply side measures are a key part of that, these build gradually in the medium term, whereas demandboosting initiatives take effect immediately. All else equal, adding to demand ahead of supply would argue for a tighter monetary policy stance.
Chart 22: The Chancellor’s policy decisions have added to projected borrowing
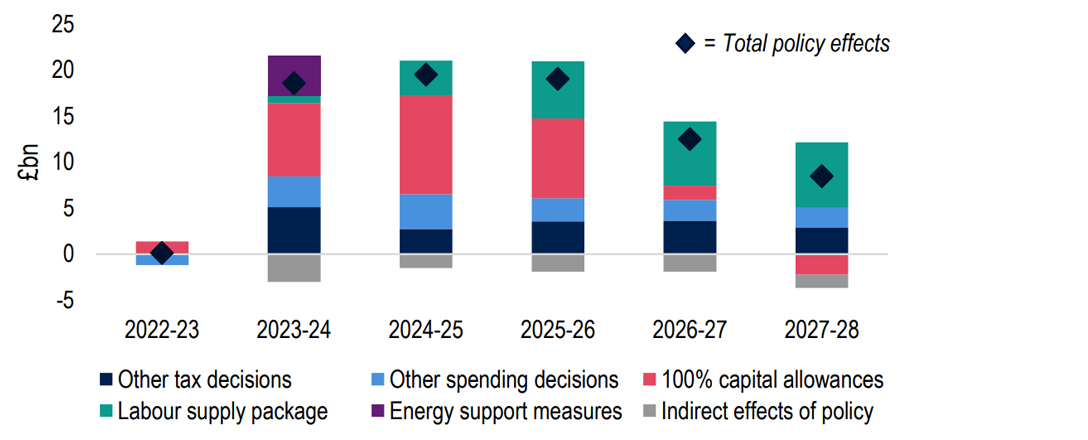
Source: OBR, ONS and Investec
Given the banking turmoil too, we think the MPC will still feel in a position to start cutting rates, but a little later than previously (in Nov not Sep), even as inflation falls sharply this year. Our end2023 Bank rate forecast is 4.00%, and we expect further rate cuts to 3.00% by end-2024. Our GDP growth forecasts incorporate the mixed set of influences too. Greater near-term momentum sees us upgrade our 2023 forecast by 0.2%pts from last month to -0.3%. Meanwhile, the additional brake from tighter credit conditions largely offsets the positive impact from more expansionary fiscal policy. This leaves our 2024 forecast just 0.1%pts lower, at +0.9% (Chart 23).
Chart 23: We have upgraded our 2023 GDP growth forecast a little; 2024 growth is a tad softer
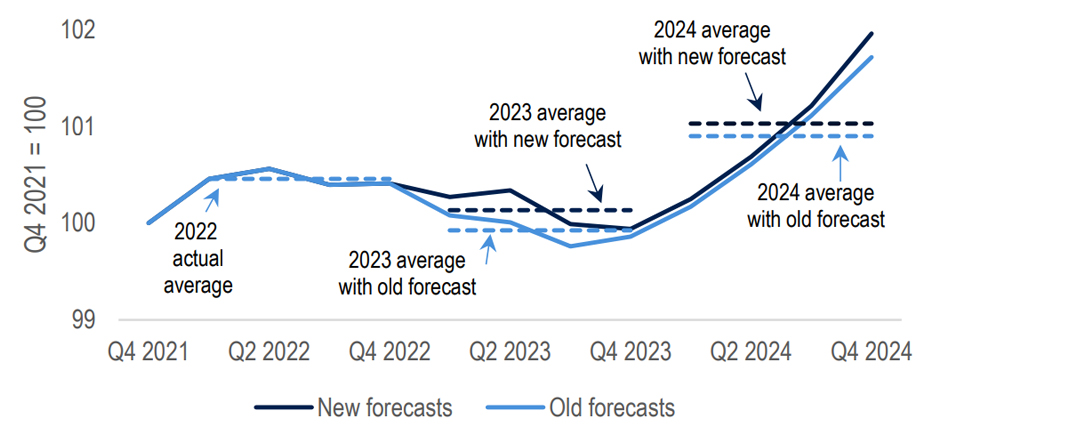
Source: ONS, Macrobond and Investec
Amid the volatility seen in other parts of financial markets, GBP has moved fairly moderately over the course of March so far, daily closes against EUR varying in a 2.1% range. Moves against USD have been larger, the equivalent range having spanned 4.1%. Looking ahead, we would expect GBP to be one of the counterparts to USD losing further ground. Although US-UK policy interest rate differentials may not change much by end-2023 or indeed end-2024, the thawing of UK-EU relations now that the Windsor Agreement has parliamentary approval paves the way for GBP holding its own against EUR. Our end-‘23/‘24 Cable forecasts are $1.27 & $1.31, and our EURGBP forecasts a steady 90p.
Chart 24: We expect GBP to gain some ground as USD weakens
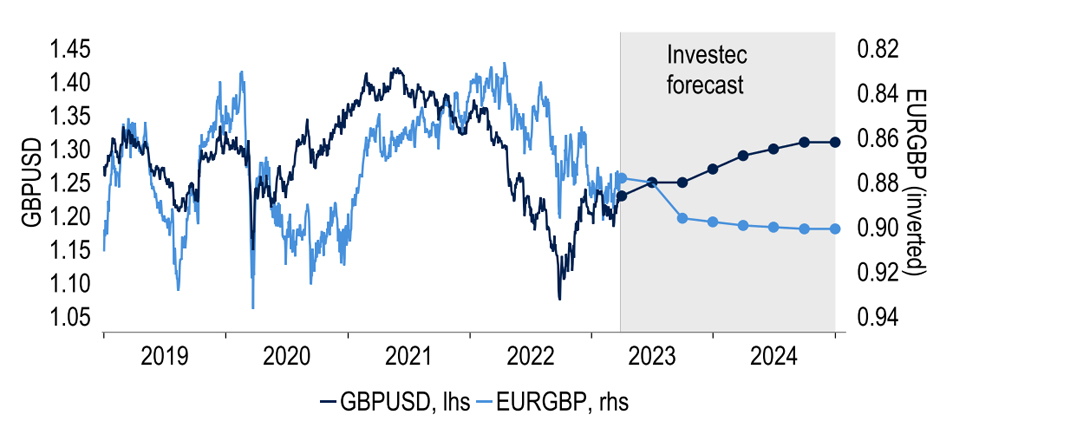
Source: Macrobond and Investec
Get more FX market insights
Stay up to date with our FX insights hub, where our dedicated experts help provide the knowledge to navigate the currency markets.
Browse articles in
Please note: the content on this page is provided for information purposes only and should not be construed as an offer, or a solicitation of an offer, to buy or sell financial instruments. This content does not constitute a personal recommendation and is not investment advice.