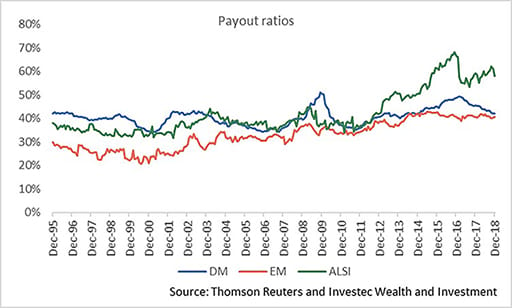
Over the past year close to 60% of earnings have been paid out as dividends, well above the post-1995 average of 42%. The current payout ratio is also well above the averages for both developed (DM) and emerging markets (EM), of close to 40%. It would appear that the current uncertain environment has led to listed companies returning cash to shareholders, rather than investing in either low return or high-risk projects.
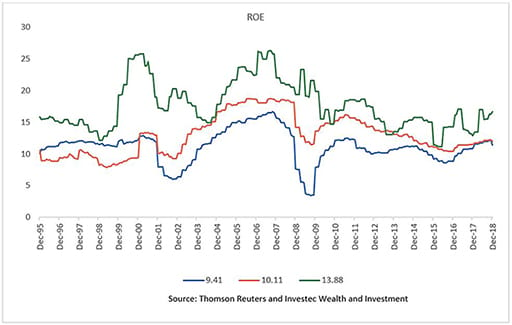
This is a desirable attribute in listed companies. The conservative approach of SA-listed corporates results in a return on equity that is consistently above that of both EM and DM peers. In aggregate, SA companies don’t go on empire building missions when growth is weak.
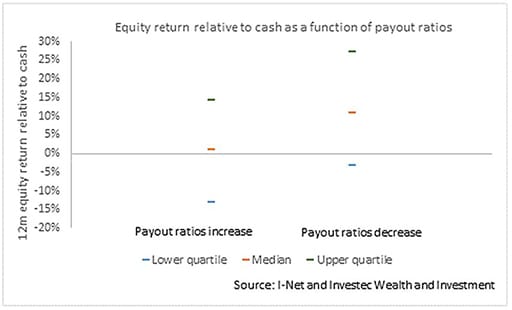
The net result is a higher starting dividend yield for the market, but with lower expected growth as a result of lower investment. However, that comes with optionality – should the growth outlook improve, then companies will be able to invest and still maintain high returns on equity (ROE). The payout ratio would come down, but growth and (presumably) price/earnings (PE) ratios would rise.
This is confirmed by the data. The chart below shows what the JSE All Share Index (excluding Naspers, whose sheer size would otherwise distort the numbers) did relative to cash, as a function of a change in the payout ratio (1990-spot). A decline in the payout ratio typically sees equity returns well above cash.
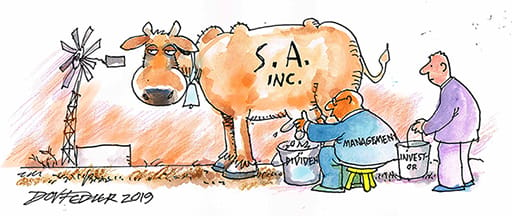
Valuation
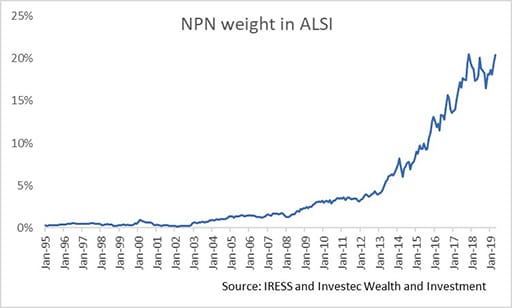
As noted above, any historical analysis of the valuation of the All-Share Index needs to adjust for the presence of Naspers. Naspers has such a large weighting in the Index and has characteristics so different from the rest of the market, that it makes the current All-Share Index materially different in a few aspects from that of old (see below).
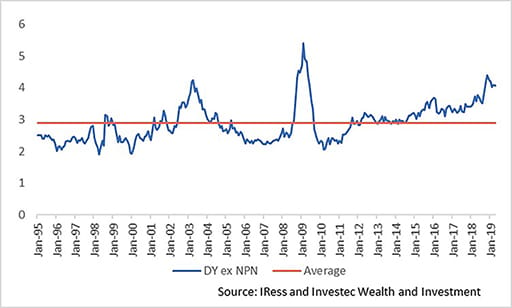
The extreme change in the payout ratio for the All-Share Index, even after adjusting for Naspers, leads to two very different estimates of market valuation – the dividend yield is suggesting something very different from the PE ratio. Excluding Naspers, the dividend yield for the All-Share Index is currently just over 4%, well above the historic average of 2.89% and suggestive of a market that is very cheap.
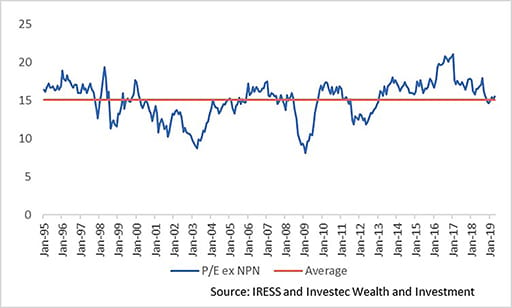
The PE ratio for the All-Share Index (ex Naspers) is currently 15.48 vs the historic average of 15.08 – suggesting a market that is close to fair value.
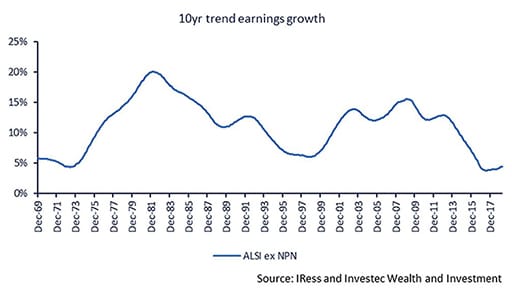
However, the weak growth environment that has seen SA companies raise their payout ratios has also been reflected in modest earnings growth. The latest 10-year earnings growth rate trend for the All-Share Index is close to the lowest on record. This is a performance that has been poor, both relative to emerging market peers and relative to history.
The big question is when (or if) this will turn? Will the new dawn in SA not be a false one and will global growth continue to tick along?
Early evidence suggests that the global growth fears expressed in markets at the back end of last year and the beginning of this year were overdone. Activity is picking up across the world with the exception of Europe.
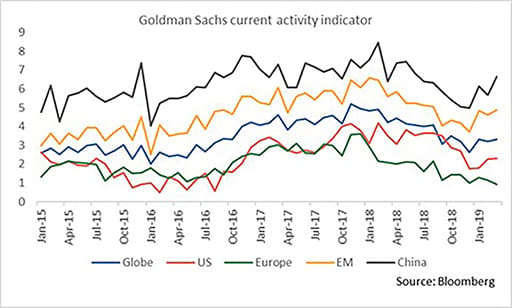
In SA, the early data suggests that GDP growth is likely to be weak or even negative in the first quarter of the year. However, the earnings base for the All-Share Index is very depressed, and growth has been near a cyclical low – which we expect to pick up over the next few years. This should result in a reduction of the payout ratio, as companies find opportunities to invest.
This environment has historically seen a re-rating of the market as earnings growth picks up. The equity market is by no means a clear “buy” but we remain mildly optimistic, given the cyclically weak earnings growth and the ability for SA corporates to take advantage of any improvements in growth.
About the author

Chris Holdsworth
Investment strategist
Chris holds an MSc (Statistics) and is a CFA. He joined Investec in 2007 as a quantitative analyst for the institutional equities team. He started covering strategy from the beginning of 2013 and headed up the research team from 2017. At the beginning of 2019, he moved to the Wealth and Investment (SA) Team as Chief Investment Strategist. He is also a member of the Global Investment Strategy Group and Chair of the Global Sector View Group.
Receive Focus insights straight to your inbox


