London business district

Global Economic Overview – April 2024

Philip Shaw, Ryan Djajasaputra, Ellie Henderson and Sandra Horsfield | London Economics team

Global markets have reevaluated the Fed outlook, impacting global bond markets and monetary policy expectations. A later Fed may not influence the timing of easing in other countries cut, and rate cuts are expected in the Eurozone and the UK.

Global Economic Overview - April 2024 PDF 2.09 MB
Summary
Global

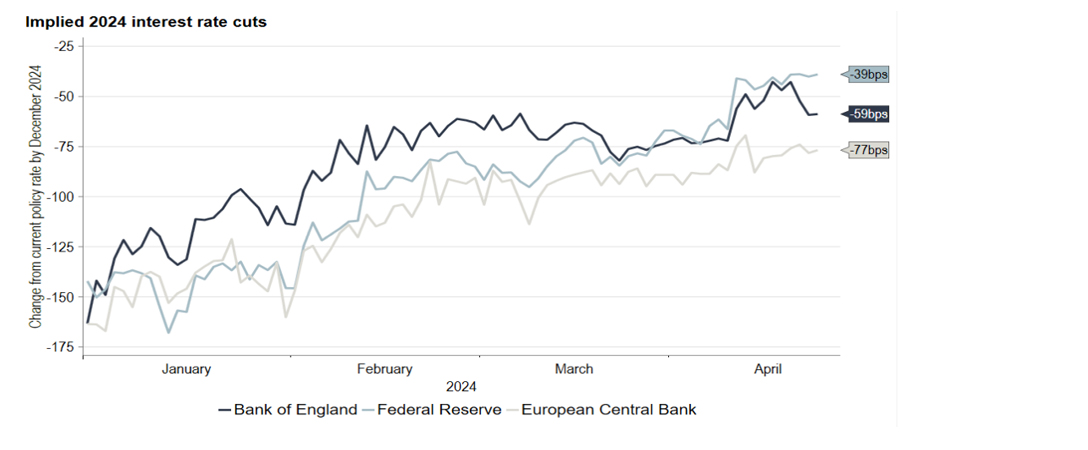
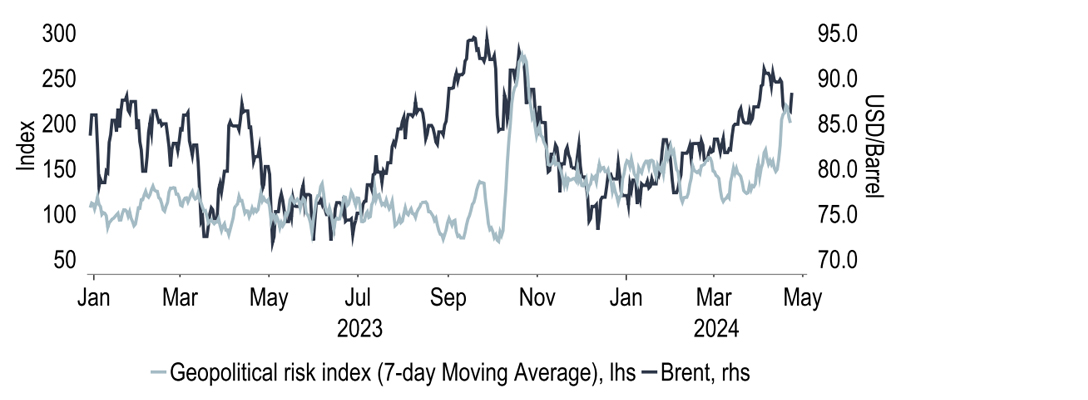
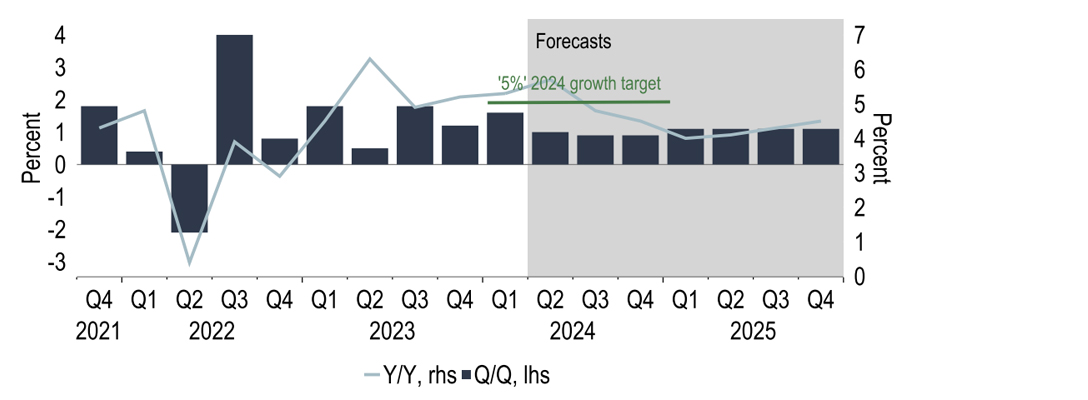
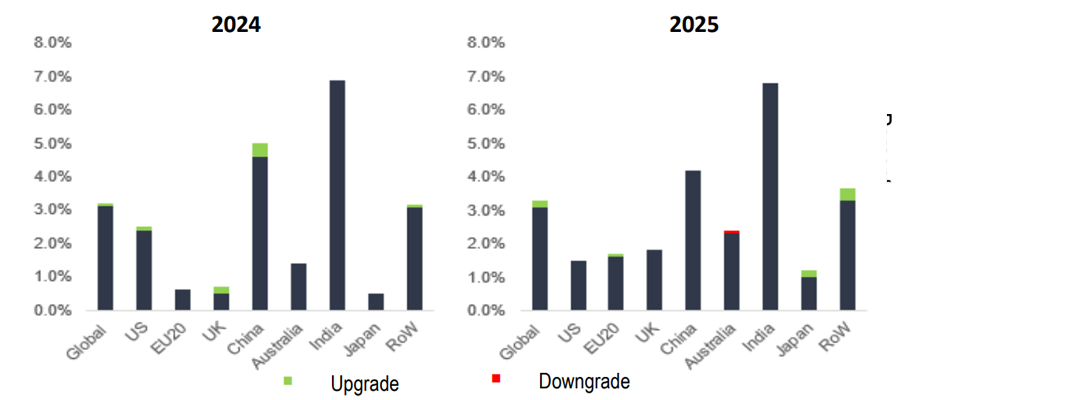
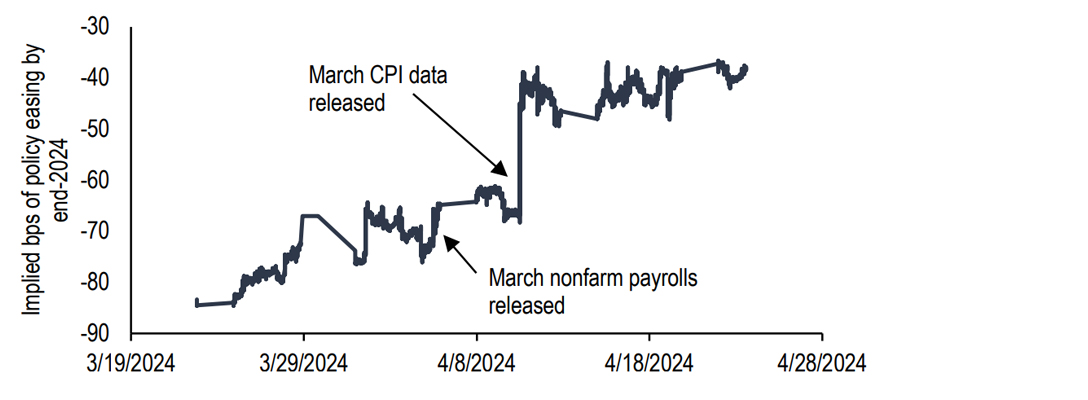
Markets have again reassessed the Fed outlook this month following another disappointing CPI print. This is a fact that has had ripple effects across global bond markets and expectations for monetary policy this year. However, does a later Fed cut really have an impact on the timing of easing elsewhere? We suspect not given the divergent economic trends between the US and the likes of the UK and Euro area. As such we suspect that there will be a decoupling in the timing of policy easing, with the ECB and BoE assumed to cut rates before the Fed. Any easing this year however remains dependent on the path of inflation, with geopolitical developments in the Middle East adding a renewed upside risk, although absent a regional conflagration we do not foresee this derailing Western monetary policy easing. Meanwhile, our view of global growth has seen a small upgrade with 2024 now standing at 3.2% thanks to upgrades to China and the US. Whilst 2025 has also been lifted to 3.3%.

United States

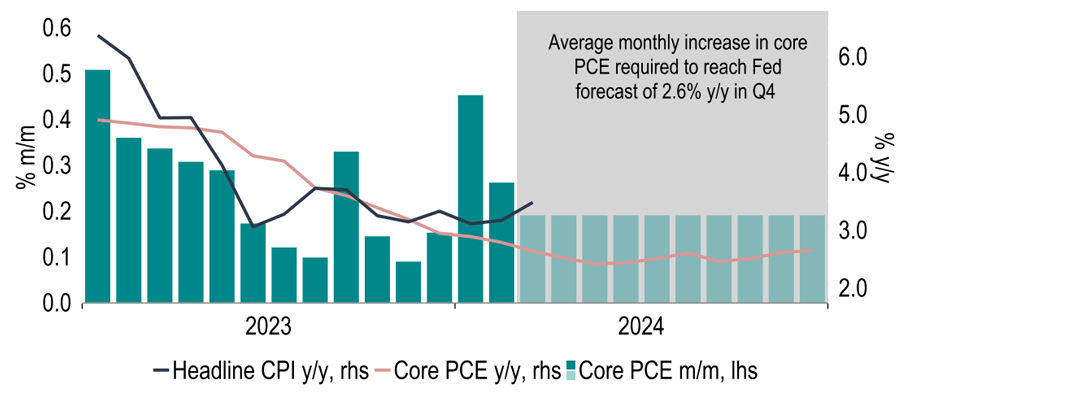
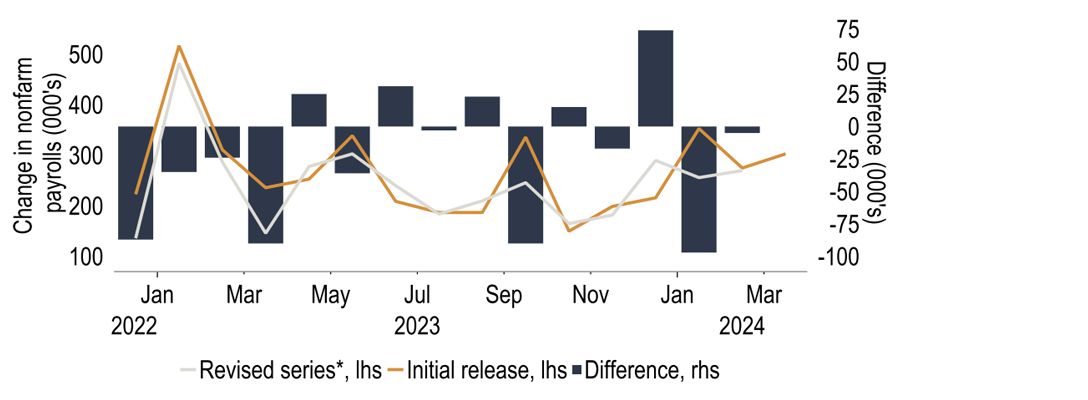
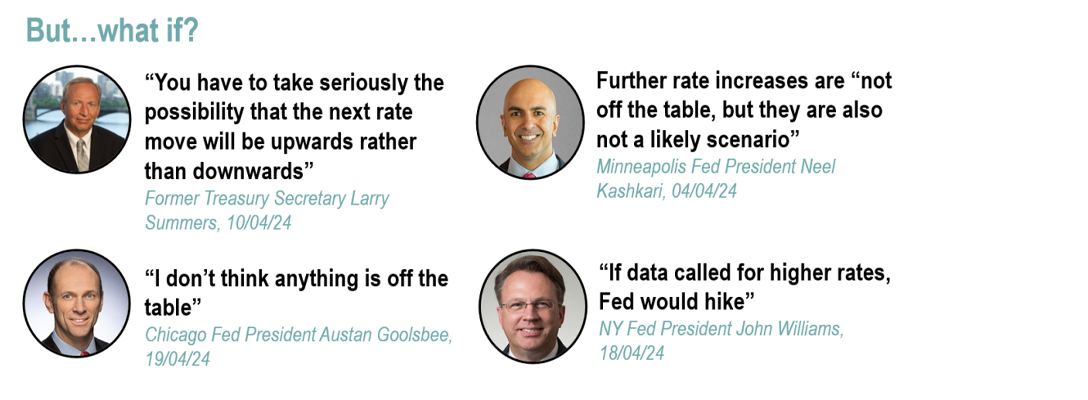
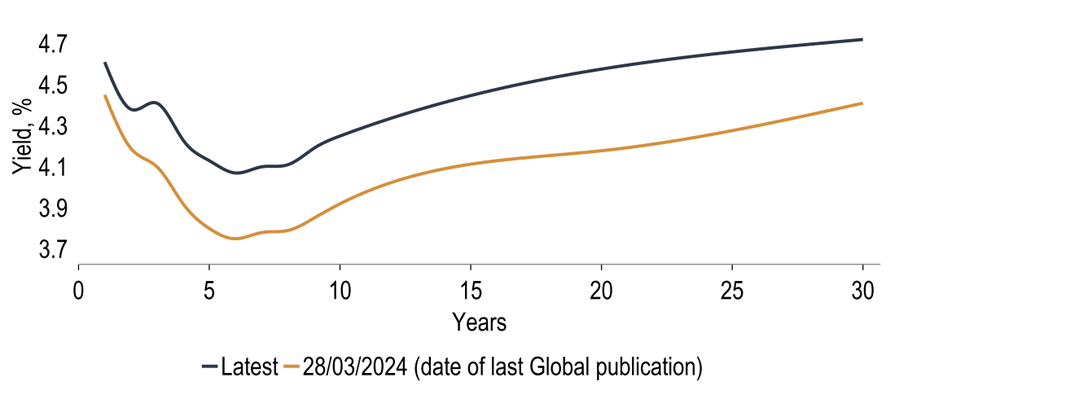
Market expectations of Fed rate cuts have been scaled back again, primarily due to a poor March CPI and continued strong economic momentum. Also, job growth has been buoyant, but we note that non-farm payrolls have tended to be revised down over the past year or so and other indicators hint at a loosening labour market. A restrictive stance of monetary policy ought to slow demand and we stand by our call of a September rate cut followed by a December move. We have though trimmed our view for 2025 to four cuts from five. The current curve is pricing in a policy rate in excess of 4% in the medium-to-long term, which we consider to be unrealistic and our base case is that Treasury yields subside again following another nervous sell-off. There has been more public talk over the possibility that the next FOMC move could be a tightening. This is not our central view, but one which we cannot totally dismiss.

Eurozone

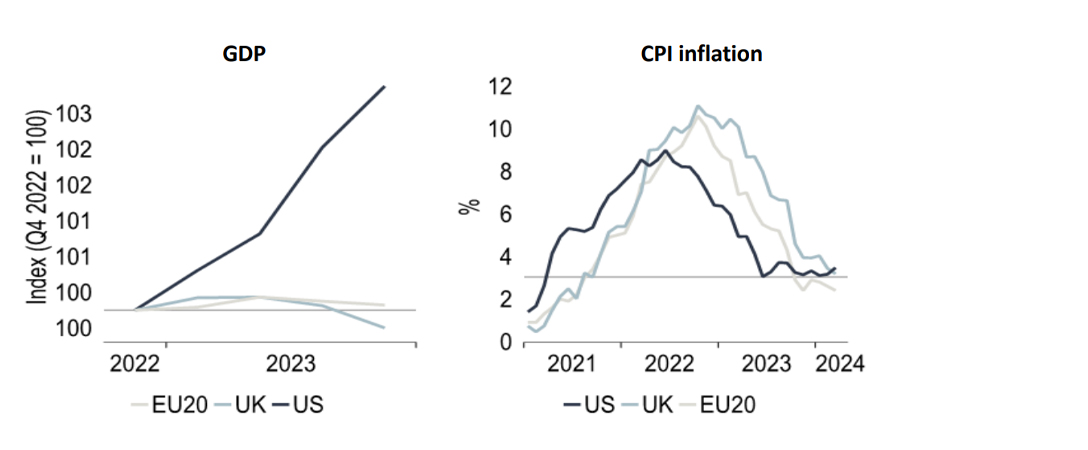
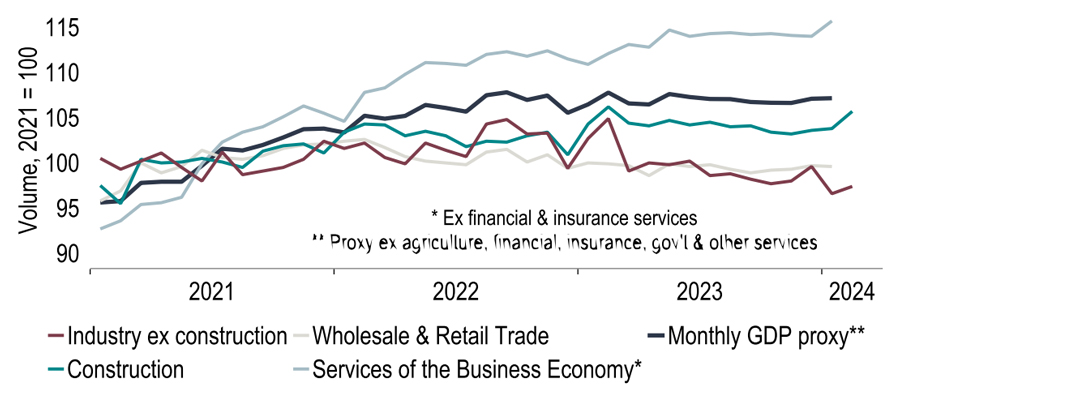
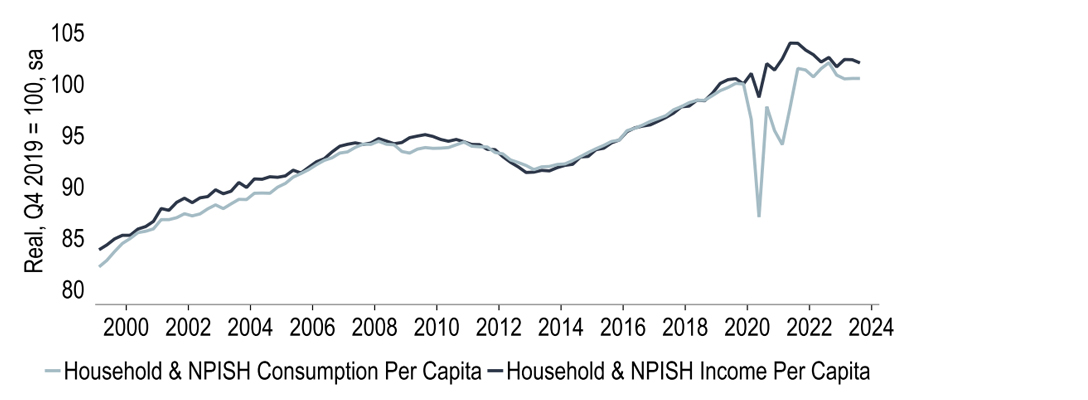
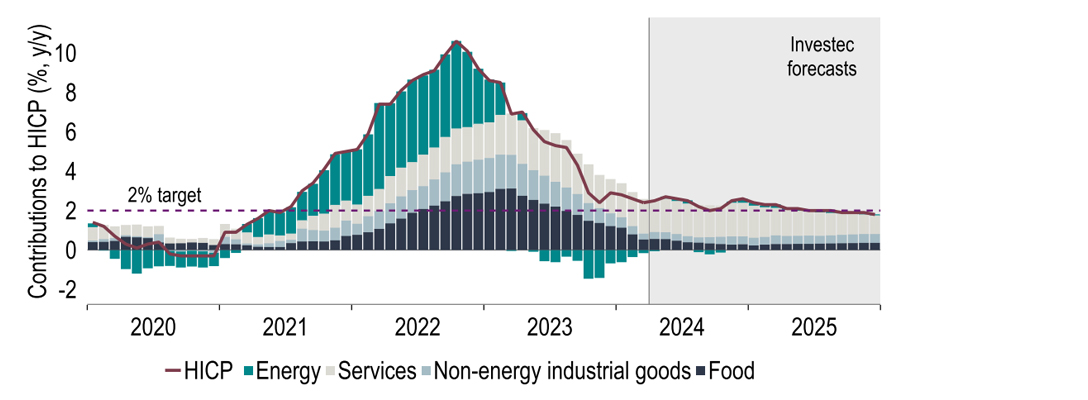
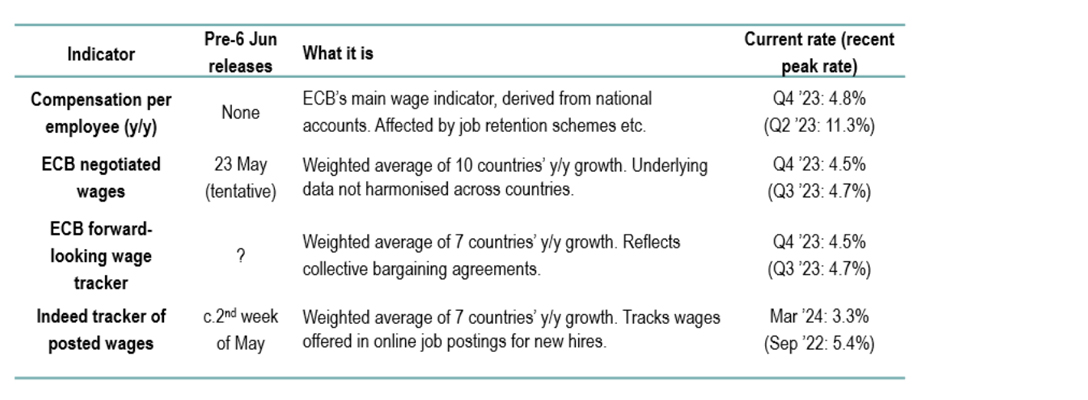
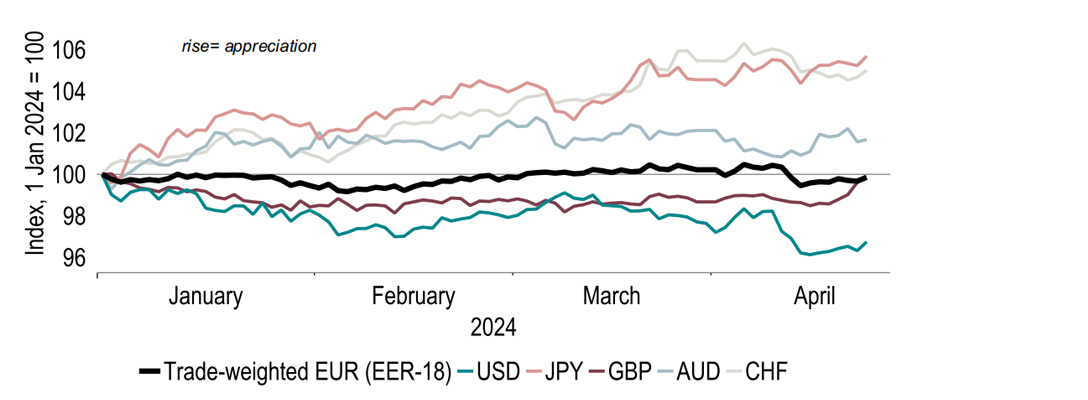
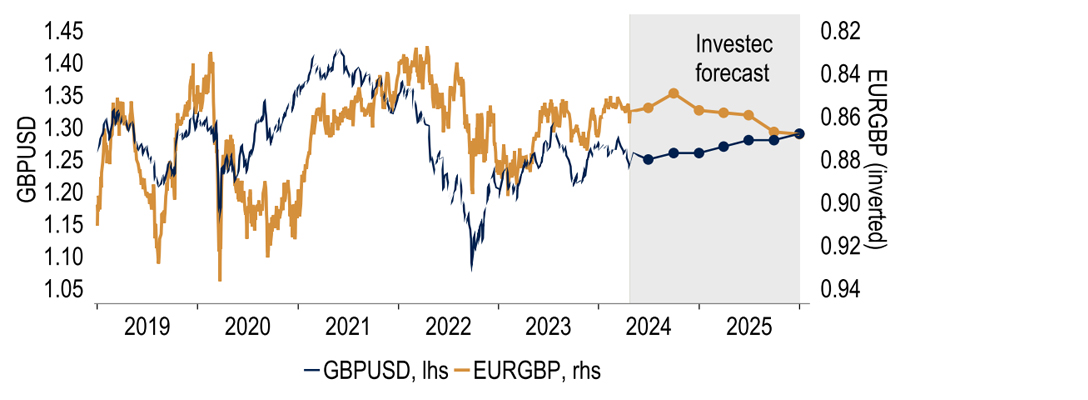
Revisions show the Eurozone to have tipped into a recession after all during H2 2023, albeit by the narrowest of margins. But the latest ‘hard’ monthly data corroborates the improved trend in surveys and points to renewed expansion from Q1. Our GDP growth forecast for this year is unchanged at 0.6%; for 2025 it is 0.1%pt higher, at 1.7%. Rising real incomes, amid lower inflation, should aid recovery, as should rate cuts. We continue to expect three 25bp cuts from the ECB this year, starting in June, and four further moves in ‘25: the pre-conditions for rate reductions the Governing Council had set out now look met. Less helpful for growth, in some countries, is fiscal policy: France too has had to find extra savings in its 2024 budget plans, joining Germany. For the euro, we expect some appreciation against USD and, to a lesser extent, against GBP.

United Kingdom

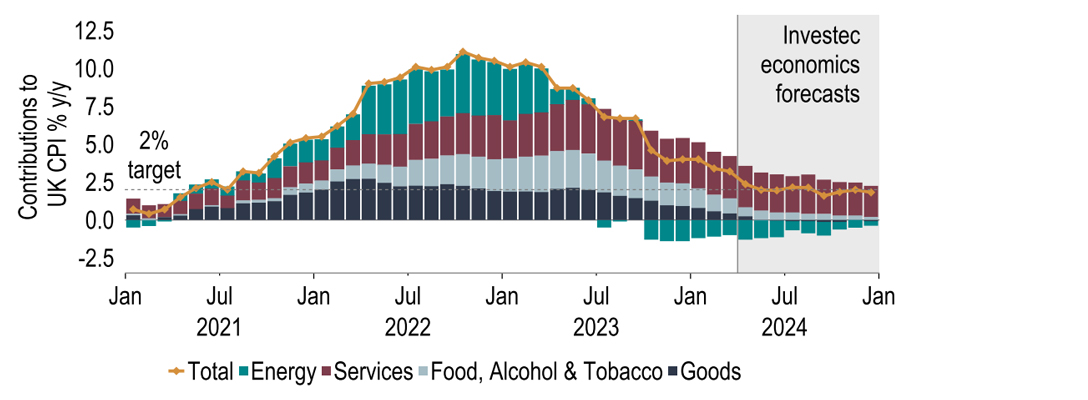
The data published so far this year have pointed to the UK economy having exited recession in Q1, as we expected. In fact, the recovery has been a little stronger than we anticipated, leading us to lift our GDP forecast for this year by 0.2%pts to 0.7%. Next year’s forecast remains unchanged at 1.8%. The economic outlook is brighter thanks to lower inflation and fiscal measures supporting growth. This naturally prompts the question as to whether interest rate cuts will be appropriate in this environment. We think so. There is a risk that rates remain higher for longer, but considering lower inflation expectations make real rates increasingly restrictive, we think the MPC will opt to dial down some of this restrictiveness, possibly from June. We expect three 25bp reductions this year, and 100bp of cuts next year (prior: 125bps in ‘25). 

Read the full commentaries

  • Global

    Global market developments over the last month have again been driven by US data. March’s CPI report in particular triggered worries that inflation’s progress towards target was stalling, prompting renewed selling in US Treasuries, with 2 and 10y yields now 20bps higher. At 4.64%, 10y yields are now at their highest since Nov-23. Underlying this has been a repricing in US rate expectations with the first cut now not expected until September and just 40bps of easing this year. This is a far cry from January’s exuberance, when six-seven cuts were priced in. Ripple effects over the US outlook have also been felt far beyond US shores with gilt and Bund yields rising and easing prospects having been revised too. 

    Chart 1: Less easing is now expected in 2024

    Chart 1: Less easing is now expected in 2024

    Source: Macrobond, Investec Economics

    Our baseline view is that the Fed will not cut until September given inflation dynamics and the strong economy (see US section). However, we would question some of the repricing in UK and EU20 rate expectations given the fundamental picture is quite different to that of the US. The US economy for example continues to run hot, whilst the UK and EU20 have flatlined over the last year. Inflation trends are also more encouraging than in the US. Despite this - April’s ECB meeting also specifically added a reference to a rate cut and ECB members have consistently pushed the idea of a June move - markets have yet to fully price it in. Equally, UK markets are only pricing in a first cut in August- our base case remains June.

    Chart 2: Divergent economic trends to prompt a decoupling in rate cut timing?

    Chart 2: Divergent economic trends to prompt a decoupling in rate cut timing?

    Source: Macrobond, Investec Economics

    April has also seen Middle East tensions rise and worries over inflation risks with them. This was prompted by a direct Iranian missile and drone attack on Israel, triggering fears of all out war, initially driving Brent to $92 per barrel. However a limited Israeli retaliation has seen concerns ease and oil prices fall back. As things stand we do not believe the situation will derail western monetary policy easing. But the region remains a key risk and one miscalculation away from a conflagration. What impact could that have on the global economy? As per the IMF’s latest WEO, an escalated regional conflict could prompt a 15% rise in oil and a 150% rise in freight costs, in turn pushing up global headline inflation by 0.7%pts in ‘24 and ‘core’ by 0.2-0.3%pts. 

    Chart 3: Market concerns ease, but Middle East geopolitical risk remains elevated

    Chart 3: Market concerns ease, but Middle East geopolitical risk remains elevated

    # Geopolitical risk index: Index representing the number of articles related to adverse geopolitical events across 10 US news providers
    Source: Macrobond, Investec Economics, Economic Policy Uncertainty

    The repricing of US rate expectations has also had a notable impact on the USD which has risen 3.3% YTD*. However, gains against the Yen have been even more stark. At 154.9 the Yen is at its weakest level since Jun-1990. This is despite the BoJ’s historic decision to increase rates in March.  A risk is that the dollar remains firmer for longer given divergent fundamentals and the possibility of a decoupling in the timings of global policy easing. In itself a later Fed cut should not directly affect policy decisions elsewhere. But indirectly much weaker local currencies as seen in Japan and Korea could have implications for inflation. Certainly, currency concerns there have become apparent this month, highlighted by a trilateral meeting with the US. This has raised speculation over multilateral FX intervention.

    Chart 4: Yen hits a three-decade low - will this trigger intervention? 

    Chart 4: Yen hits a three-decade low - will this trigger intervention?

    * Federal Reserve trade weighted index
    Source: Macrobond, Investec Economics

    Chinese data this month, in terms of GDP at least, were surprisingly strong with Q1 growth outpacing expectations at 1.6% q/q and 5.3% yoy. There were also notable positive revisions to recent history which arithmetically, mean that the government’s 5% 2024 growth target looks more achievable. Indeed, we have revised up our forecast to 5.0% from 4.6%. Despite the upgrade, the outlook for the year remains challenging. Q1 GDP may have stolen the limelight, but the monthly data for March were less encouraging with industrial output and retail sales falling short of expectations. Meanwhile issues in the property sector remain unresolved. 

    Chart 5: China’s 2024 growth target looks achievable given revisions and Q1 GDP 

    Chart 5: China’s 2024 growth target looks achievable given revisions and Q1 GDP

    Source: Macrobond, Investec Economics

    As for our view of global growth, 2024 sees a 0.1%pt uplift to 3.2%. China’s 0.4% upgrade accounts for 80% of this and a positive revision to the US (2.5%) also contributes. In broad terms the 2024 outlook is driven by familiar themes, namely an economic recovery following stagnation in H2 2023, prime examples being the UK and EU20. Evidence of economic green shoots has already begun to appear this year and should be helped further by easing cost-of-living pressures and the expected fall in interest rates. As for 2025, our world GDP forecast has been nudged up to 3.3% from 3.1%, courtesy of a more detailed assessment of a wider group of countries.

    Chart 6: Upgrades to China nudge global growth higher this year

    Chart 6: Upgrades to China nudge global growth higher this year

    Source: Macrobond, Investec Economics

  • United States

    Three factors have shifted US rate cut expectations back abruptly over the past month. Most importantly, +0.4% monthly increases for both core and headline CPI in March represented the third straight above-consensus outturn. Some point out that headline CPI inflation has stopped falling since mid-2023. Although that is true, core PCE inflation has still been coming down (Chart 7). At an annual rate of 2.8% though, the monthly rises over the rest of 2024 need to ease to an average of 0.19% from 0.29% over the past three months to reach the FOMC’s forecast of 2.6% in Q4. This looks a big ask and so essentially invalidates the median March ‘dot plot’ of three rate cuts in 2024.

    Chart 7: Core CPI inflation is still falling, but not as fast as the FOMC has expected? 

    Chart 7: Core CPI inflation is still falling, but not as fast as the FOMC has expected?

    Source: BLS, Macrobond, Investec Economics

    The second factor is economic strength. Q1 GDP data were due on 25 Apr and a 7th straight quarter in excess of 2% (saar) looked likely. But we maintain our view that the restrictive stance of monetary policy should bite on demand soon. Real post-tax household incomes have slowed, which should presage weaker consumer spending growth. Also, the saving rate fell to 3.6% in Feb, compared with a 5-year average of 6.2% before the pandemic, increasing reliance on savings levels to drive consumption. Separately durable goods orders seem to be flattening, which should weigh on corporate investment. Our GDP forecasts (2.5% & 1.5% for 2024 & 2025) are only trivially different from March and embody slower activity through the remainder of this year.

    Chart 8: Real household income growth is slowing and the saving rate is falling

    Chart 8: Real household income growth is slowing and the saving rate is falling

    n.b. Jan-23 boosted by Social Security Cost Of Living Adjustment
    Source: BEA, Macrobond, Investec Economics

    The third is the labour market. Beats on nonfarm payroll prints have helped defy expectations that high rates would trigger a surge in job losses. But we note that revisions to back data over the past year or so have been in a downward direction, particularly from Dec 22 to Mar 23. And there are other signs that the labour market may be looser than initial reports suggest. The NFIB hiring intentions survey has shown a steep fall in the last four months and Challenger data show job layoffs have been on the rise. We also point out that when assessing the tightness of the labour market, high immigration seems to be boosting supply, putting downward pressure on wages.

    Chart 9: Beware revisions to initial payroll data - they have frequently been revised down

    Chart 9: Beware revisions to initial payroll data - they have frequently been revised down

    *February data is first revision only
    Source: BLS, Macrobond, Investec Economics

    FOMC decisions remain dependent on the path of the PCE data, but with activity still robust for now, the Fed can afford to be patient before easing. The yield curve is now pricing in 1-2 25bps cuts this year and a further 2-3 next. Interest rate markets have been highly volatile over the past year, falling way short of a reliable guide to the outlook. But we agree with the curve that, barring an inflation miracle or an economic disaster, a June cut is off the cards. We stand by our recent change of view that the FOMC will ease twice this year, beginning in September. Moreover we have tweaked our forecast from five reductions to four over 2025. This would take the Fed funds target range to 3.75%-4.00% at the end of next year. 

    Chart 10: Markets have priced out even more cuts this year

    Chart 10: Markets have priced out even more cuts this year

    Source: Bloomberg, Investec Economics

    We would point out that markets are currently pricing in a policy rate of 4% and above right across the curve. We suspect that the ‘neutral’ rate is probably closer to 3.5% than the Fed’s 2.6%. Either way though there seems little reason to expect policy to remain restrictive indefinitely and at some stage, the Fed funds target range will need to be brought to its neutral level and below. In other words we judge the level of the curve to be too high. This is also relevant in the context of Treasury yields which have reacted to events by soaring by over 40bps so far this month to 4.63%. If our economic analysis is correct, markets should become more sanguine over inflation prospects and we are pencilling in yields easing back to 4.0% by end-year and 3.75% by end-2025.

    Chart 11:  Markets price in a Fed funds rate in excess of 4% in perpetuity – is this realistic??

    Chart 11: Markets price in a Fed funds rate in excess of 4% in perpetuity – is this realistic??

    Source: Macrobond, Investec Economics

    But what if our analysis is incorrect? As discussed previously, a feasible scenario is that that the outlook shifts from a soft landing to no landing, at least in the near term, resulting in inflation pressures remaining engrained. In this case, easing is delayed longer and bond yields stay elevated (and the US dollar better supported). It is also not impossible that, in a more extreme version of events, the Fed needs to consider a further tightening of policy. The extent to which markets perceive these risks is not straightforward to gauge: although the forward rate curve is downward sloping, the risk is not 0%. Recent media reports suggest that options markets are pricing in as much as a 20% chance of a 2024 hike.

    Chart 12: The next move in rates is upwards? Not totally impossible… 

    Chart 12: The next move in rates is upwards? Not totally impossible…

    Source: Federal Reserve, US Treasury, Reuters, Investec Economics

  • Eurozone

    Some very minor revisions to back data have meant the Eurozone economy is now reported to have been in recession in H2 2023 after all. That, however, was by the tiniest of margins, with quarterly growth of -0.058% in Q3 and -0.053% in Q4. Moreover, it looks to have been short-lived. Chiming with the broad message from survey figures, ‘hard’ activity data from the euro area largely support the idea that GDP expanded again during the first quarter of the year. We have constructed a proxy of EU20 monthly GDP, which hints at 0.1% m/m growth in January, with industrial production and construction pointing upwards in February too (Chart 13). Our ’24 GDP growth forecast remains 0.6%, as before, and our ’25 forecast is 0.1%pt higher, at 1.7%. 

    Chart 13: Early Q1 ‘hard’ data hint at an escape from (a very shallow) recession in the Eurozone

    Chart 13: Early Q1 ‘hard’ data hint at an escape from (a very shallow) recession in the Eurozone

    Source: Eurostat, Macrobond, Investec Economics

    That we see growth gather pace reflects a number of factors. One is that we expect real household income, and thereby consumption, to recover some lost ground now that inflation is lower (Chart 14). Interest rate cuts should also help soon, also by lessening the downturn in housing construction. But these supportive drivers need to be weighed against some headwinds. Like in Germany, fiscal belt-tightening has now become a necessity for France, where the 2023 deficit was a higher-than-expected 5.5% of GDP. Tightening is required to avoid a credit downgrade (€20bn of extra spending cuts are now planned in ’24.) Meanwhile Italy’s costly ‘superbonus’ left its 2023 borrowing even higher, at 7.4%.

    Chart 14: Inflation has eaten into household incomes, and thereby held back GDP

    Chart 14: Inflation has eaten into household incomes, and thereby held back GDP

    Source: Eurostat, Macrobond, Investec Economics

    The debt impact of this, from a high starting point, is yet to be felt in full, and fiscal tightening will have to follow under EU rules. But as a large part (75%) of Italy’s Next Generation EU funds remains unspent, the drag on Italian GDP may come only in later years. All in all, that leaves the EU20 outlook for growth, but not at a pace that would signal excess demand. Against this backdrop, we see the inflation trend as likely to continue to point towards a sustained on-target 2% rate. Even if, as elsewhere, services are still a sticking point for now, we note that the headline inflation rate is, at 2.4%, already back to its Nov ‘23 low, despite what is now a much less negative energy contribution (Chart 15).

    Chart 15: Inflation is back to its November low, despite a less negative energy contribution

    Chart 15: Inflation is back to its November low, despite a less negative energy contribution

    Source: Eurostat, Macrobond, Investec Economics

    At its last policy meeting, and since, the ECB made explicit its intention to proceed with a first rate cut at its next meeting in June, data allowing. Wage figures are key to the longer-term inflation outlook, and more information is due soon (Chart 16). Provided that there is at least some deceleration, we think the ECB will feel comfortable to cut then, even if the Fed’s planned monetary easing now looks almost certain to start only later. All other pre-conditions appear, in essence, met: as regards underlying inflation, the ECB can point to a raft of ‘core’ measures, almost all of which are heading south, albeit at varying rates. Shrinking profit margins (as of Q4) amid a moderate growth path certainly fit with an on-target medium-term inflation outlook. 

    Chart 16: An overview of wage measures in the EU20: what data is available pre-ECB meeting?

    Chart 16: An overview of wage measures in the EU20: what data is available pre-ECB meeting?

    Source: ECB, Bloomberg, Investec Economics

    And when it comes to the strength of monetary policy transmission, the latest (Q1) Bank Lending Survey pointed to the level of interest rates as a powerful restraint on investment demand (Chart 17). Why cut rates at all though? This time there is no crisis in sight in which it would be necessary for the central bank to act aggressively to stem a plunge in demand. Instead, receding inflation expectations gradually make the prevailing level of nominal rates increasingly restrictive and thereby inappropriate. Unlike in a crisis, we therefore see rate cuts proceeding fairly slowly, and in 25bp steps, to 3.25% by end-’23 and 2.25% by end-’24. This leaves room for only a minor rally in Bund yields, to 2.25% by end-’24 and the same at end-’25, we think.

    Chart 17: High-interest rates are now deterring loan demand, according to banks

    Chart 17: High interest rates are now deterring loan demand, according to banks

    Source: ECB, Macrobond, Investec Economics

    Turning to currencies, the trade-weighted EUR has shown little movement since the start of this year. This, however, masks clear divergence: EUR has weakened against USD, as one counterpart to the greenback’s general appreciation, but the single currency is visibly up against CHF and JPY (Chart 18). Looking ahead, we see more scope for a retracement in US than in EU20 policy rate expectations relative to what is priced in, and so in USD as well: our year-end EURUSD forecasts are $1.08 for ’24 and $1.12 for ’25. A similar story applies against GBP: our end-’24 and end-‘25 forecasts are 86p and 87p, respectively. 

    Chart 18: The Euro has been caught in the cross-currents of a stronger USD and weaker CHF

    Chart 18: The Euro has been caught in the cross-currents of a stronger USD and weaker CHF

    Source: ECB, Macrobond, Investec Economics

  • United Kingdom

    UK interest rate markets have followed the US lead with the UK yield curve shifting higher since our last Global (Chart 19). Financial markets are no longer pricing in three interest rate reductions this year, favouring two 25bp cuts instead. This move was predominantly fuelled by the hotter-than-expected US CPI inflation print, which sparked a sell-off in global interest rate markets. Comparatively, domestic data releases over the same period have had a muted impact. For example, an above-consensus UK CPI inflation report caused less of a reaction, despite the 0.1%pt beat being the same size as the US overshoot, as did the slightly stronger-than-expected pay data.

    Chart 19: The UK yield curve was seemingly dragged higher by movements in US rate markets

    Chart 19: The UK yield curve was seemingly dragged higher by movements in US rate markets

    Source: Macrobond, Investec Economics

    We maintain our call for a first policy rate reduction in this cycle from the Bank of England in June. One factor supporting this view is the likely step down in inflation in April. This is all-but-confirmed, thanks to the downward influence from energy arising from the already announced 12% cut to the Ofgem energy price cap, which feeds directly into the inflation calculation. When deciding policy, the MPC will look at inflation prospects at a two-to-three year horizon, but there would likely still be a degree of comfort from inflation closer to the 2% target as a starting point. We have pencilled in three 25bps cuts this year and 100bps in total over ‘25 (revised from 125bps). The balance of risks does tilt to less easing this year, though.

    Chart 20: We expect UK inflation to hit 2% (and below!) this year, opening door to rate cuts

    Chart 20: We expect UK inflation to hit 2% (and below!) this year, opening door to rate cuts

    Source: Macrobond, ONS, Investec Economics

    There are a few reasons for this. Although economic expansion is in general a good thing, it does come with concerns in an inflationary environment. Indeed, with two months of GDP data for this year already published, it is highly likely that in Q1 the UK economy exited its recession experienced in H2 last year. As the figures currently stand, it would require a monthly contraction of 1.0% or more in March to prevent the economy having escaped from recession. There is the fear though that if demand accelerates too quickly, it could fuel further inflationary pressure. This is one upside risk to our inflation forecasts. Another regards food costs. Wet weather has hit harvesting, resulting in farmers warning about limited supply and higher prices.

    Chart 21: Wet weather in the UK is causing havoc for farmers

    Chart 21: Wet weather in the UK is causing havoc for farmers

    Source: Macrobond, Met Office, Investec Economics

    Food price inflation could also be pushed higher by post-Brexit checks and charges that are due to be applied this year, including physical checks from the end of this month. There has long been concern that systems are not ready for this: checks have already been pushed back five times. But the sixth time is apparently not the charm either, with a leaked document advising the rate of checks to initially be set to zero to avoid border logjams. These are not the only trade measures that have been announced. The government also revealed 126 new tariff suspensions for two years, such as on car parts and food items. This could counteract inflationary pressure from physical checks.

    Chart 22: Sixth time’s the charm? Maybe not… Rate of post-Brexit physical checks set to zero

    Chart 22: Sixth time’s the charm? Maybe not… Rate of post-Brexit physical checks set to zero

    Source: Gov.uk, Investec Economics

    More recently, though, lower energy (and food) prices are no longer the only drivers of lower inflation: even the sticker core service price component is now 1.4%pts below its peak (although, at 6.0%, still too high). Meanwhile, inflation expectations, for both households and firms, are receding (Chart 22). This lowers the likelihood of entrenched above-productivity wage growth and thereby the risks of inflation persistence. It also directly affects the ex-ante real interest rate factored into borrowing and lending decisions. As inflation expectations slide, the appropriate policy rate does too. We continue to forecast a first rate cut in June and 75bps of rate reductions in total by the end of ’24, with more to follow in ’25. Market pricing has now largely, although not fully, converged to this profile as well.

    Chart 23:  Reassuringly, inflation expectations have declined as actual inflation has fallen

    Chart 23: GBP could struggle against stronger EUR if markets price in more UK rate cuts

    Source: Macrobond, Investec Economics

    Early next month local elections are taking place in 107 local authorities in England (Chart 24). Current polls point to the Tories suffering a heavy defeat, and speculation that if two crucial mayoralties - West Midlands and Tees Valley - are lost, on top of losses elsewhere, Sunak could be facing a vote of no confidence. Although likely to survive this, the pressure will be on to turn the polls around ahead of the general election later this year. Chancellor Hunt hopes to squeeze in a fiscal event before voters head to the ballot, targeting a further 2p cut to employees' NICs contributions, halving the rate of the tax in a single year. But given the minimal impact of the previous two NICs cuts on the polls, a third seems unlikely to change the Tories’ fortunes. 

    Chart 24: Another crushing defeat for the Tories? 107 local authorities head to the polls

    Chart 24: Another crushing defeat for the Tories? 107 local authorities head to the polls

    *not including mayoral elections
    Source: Institute for Government, Investec Economics

Global Economic Overview - April 2024 PDF 2.09 MB

For more information contact our economists

Get more FX market insights

Stay up to date with our FX insights hub, where our dedicated experts help provide the knowledge to navigate the currency markets.

Read more on the global economy

Please note: the content on this page is provided for information purposes only and should not be construed as an offer, or a solicitation of an offer, to buy or sell financial instruments. This content does not constitute a personal recommendation and is not investment advice. 

  • Disclaimer

    For the purposes of this disclaimer, “Investec Securities” shall mean: (i) Investec Bank plc (“IBP”); (ii) Investec Europe Limited; (iii) Investec Bank Limited (“IBL”); (iv) Investec Capital Asia Limited (“ICAL”); (v) Investec Capital Services (India) Private Limited; (vi) Investec Singapore Pte. Ltd (“ISPL”) and from time to time, in relation to any of the forgoing entities, the ultimate holding company of that entity, a subsidiary (or a subsidiary of a subsidiary) of that entity, a holding company of that entity or any other subsidiary of that holding company, and any affiliated entity of any such entities. “Investec Affiliates” shall mean any directors, officers, representatives, employees, advisers or agents of any part of Investec Securities. This document has been issued solely for general information and should not be considered as an offer or solicitation of an offer to sell, buy or subscribe to any securities or any derivative instrument or any other rights pertaining thereto. This document may have been issued to you by one entity within Investec Securities in the fulfilment of another Investec Securities entity’s agreement to do so. In doing so, the entity providing this document is in no way acting as agent of the entity with whom you have any such agreement and in no way is standing as principal or a party to that arrangement.

    The information in this document has been compiled by Investec Securities from sources believed to be reliable, but neither Investec Securities nor any Investec Affiliates accept liability for any loss arising from the use hereof or makes any representations as to its accuracy and completeness. Any opinions, forecasts or estimates herein constitute a judgement as at the date of this document. There can be no assurance that future results or events will be consistent with any such opinions, forecasts or estimates. Past performance should not be taken as an indication or guarantee of future performance, and no representation or warranty, express or implied is made regarding future performance. The information in this document and the document itself is subject to change without notice. This document as well as any other related documents or information may be incomplete, condensed and/or may not contain all material information: its accuracy cannot be guaranteed. There is no obligation of any kind on Investec Securities or any Investec Affiliates to update this document or any of the information, opinions, forecasts or estimates contained herein. Investec Securities (or its directors, officers or employees) may, to the extent permitted by law, act upon or use the information or opinions presented herein, or research or analysis on which they are based prior to the material being published. Investec Securities may have issued other documents or reports that are inconsistent with, and reach different conclusions from, the information presented in this document. Those reports and/or documents reflect the different assumptions, views and analytical methods of the analysts who prepared them. This document does not contain advice. Specifically, it does not take into account the objectives, financial situation or needs of any particular person. Investors should not do anything or forebear to do anything on the basis of this document. Before entering into any arrangement or transaction, investors must consider whether it is appropriate to do so based on their personal objectives, financial situation and needs and seek financial advice where needed. No representation or warranty, express or implied, is or will be made in relation to, and no responsibility or liability is or will be accepted by Investec Securities or any Investec Affiliates as to, or in relation to, the accuracy, reliability, or completeness of the contents of this document and each entity within Investec Securities (for itself and on behalf of all Investec Affiliates) hereby expressly disclaims any and all responsibility or liability for the accuracy, reliability and completeness of such information or this document generally.

    The distribution of this document in other jurisdictions may be prohibited by rules, regulations and/or laws of such jurisdiction. Any failure to comply with such restrictions may constitute a violation of United States securities laws or the laws of any such other jurisdiction. By accepting this document, you confirm that you are an "institutional investor" and agree to be bound by the foregoing limitations. This publication is confidential for the information of the addressee only and may not be reproduced in whole or in part, copies circulated, or disclosed to another party, without the prior written consent of an entity within Investec Securities. In the event that you contact any representative of Investec Securities in connection with receipt of this document, including any analyst, you should be advised that this disclaimer applies to any conversation or correspondence that occurs as a result, which is also engaged in by Investec Securities and any relevant Investec Affiliate solely for the purposes of providing general information only. Any subsequent business you choose to transact shall be subject to the relevant terms thereof. We may monitor e-mail traffic data and the content of email. Calls may be monitored and recorded. Investec Securities does not allow the redistribution of this document to non-professional investors or persons outside the jurisdictions referred to above and Investec Securities cannot be held responsible in any way for third parties who effect such redistribution or recipients thereof.