

Among the periodic shocks to the SA economy and its financial markets, Phala Phala does not measure severely. It’s more a case of strong tremors rather than an earthquake. The shocks to the economy and its financial markets delivered by the Global Financial Crisis of 2008, the Nenegate crisis of late 2015, and the crisis caused by Covid-19 registered far more strongly and dramatically.
The most appropriate measure of an economy’s status is its credit rating. This can be indicated objectively by the interest rate spread between its debt issues that are payable in US dollars (known as Yankee bonds), and the interest offered by the US Treasury for its debt of the same time to maturity (typically five years). This risk premium is arguably the most reliable measure of sovereign risk – the risk that South Africa will default on its obligation to pay back its dollar debt, or may inflate its way out of its obligations to rand creditors. Between 30 November and the morning of 1 December, when the highly critical report requested by Parliament on President Cyril Ramaphosa was released, this risk spread immediately widened by 46 basis points, from 2.17% to 2.63%. By 7 December, this yield spread had fallen back to 2.5% - about the long-term average.
On 1 December the interest yield on the five-year RSA Yankee debt rose from 5.91% to 6.29% overnight, while that on a five-year US Treasury fell from 3.74% to 3.66%. The yield on a five-year, rand-denominated bond rose overnight in predictable sympathy, from 9.34% to 9.96%, more than 60 bps higher.
To compare previous episodes, in early October 2008, before the Global Financial Crisis broke, the SA risk premium was a similar 2%. But by 24 October that month, the risk premium had risen devastatingly to 6.5%. By the end of that tumultuous year, the risk premium had declined to a still elevated and expensive 4%. On 19 October 2015, the sovereign risk premium before Nenegate was an average of 2.4%. But by 20 January 2016, the risk premium had topped out at 3.89%, a 150 bps increase. This declined after the Ministry of Finance had been restored to what was regarded as safer hands.
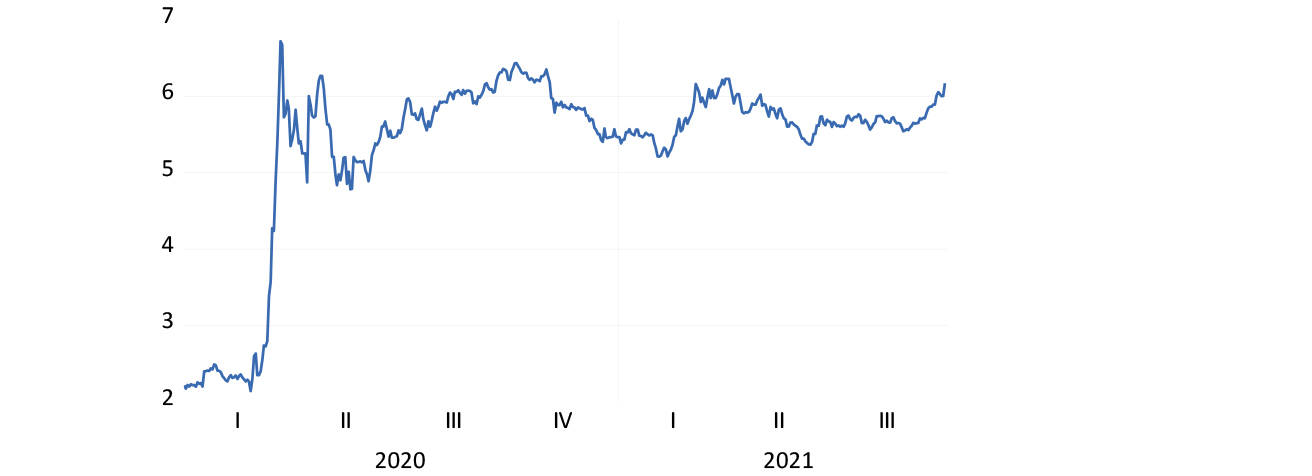
These events of late 2015 and this year could be described as highly specific to South Africa. They did not have their origin in suddenly more risk-conscious global capital markets spreading greater anxiety about riskier borrowers generally (of which South Africa is one). The next crisis for South Africa was again decidedly global in origin. It came with the Covid-19 pandemic and the lockdowns that followed. In early March 2020, the RSA risk premium stood at 1.79%. By early April it had risen to 4.97% – a more than 400 bps increase before it fell gain. By early 2021, this risk premium had declined and came back to hover at about the 2% level.
The SA economy has been punished both absolutely, but also relative to other emerging markets, by international crises not of its own making. During the crises of 2008 and 2020, long-term interest rates tended to rise further than in other emerging markets, while the rand weakened markedly vs other emerging market exchange rates. From these, rapid absolute and relative recoveries have then ensued.
The RSA sovereign risk premium, 2005 to 2022
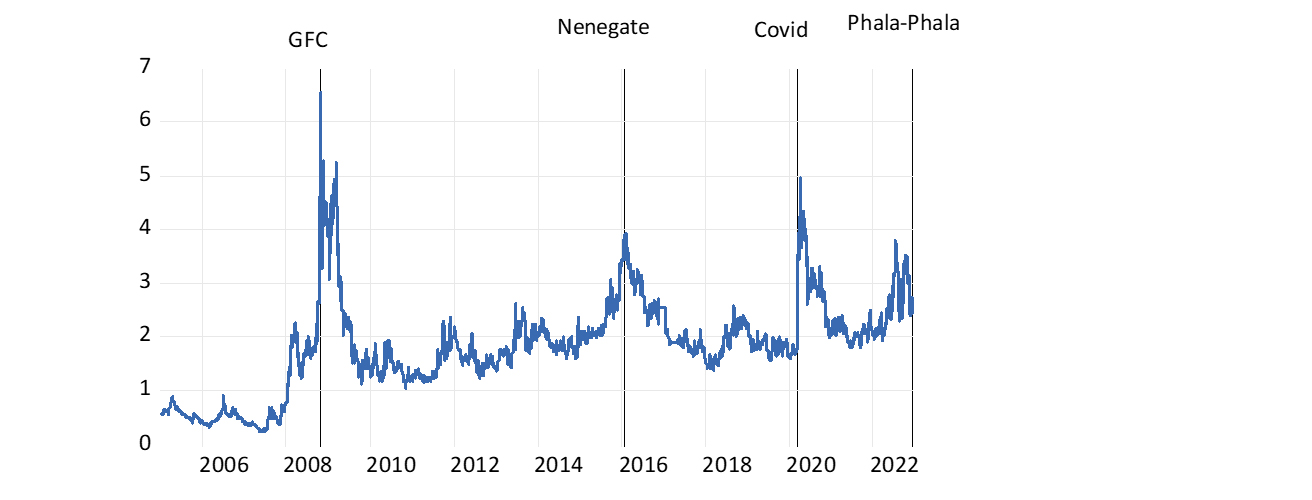
Source: Bloomberg and Investec Wealth & Investment, 8/12/2022
Sovereign risk spread during crises
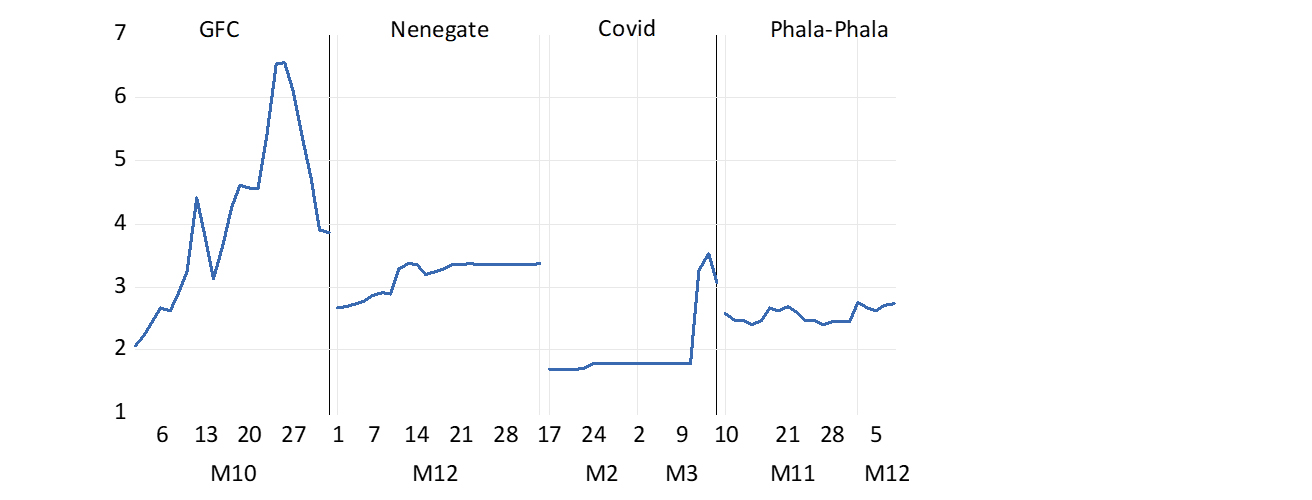
Source: Bloomberg and Investec Wealth & Investment, 8/12/2022
RSA five-year bond yields; rand and US dollar-denominated, 2005 to 2022
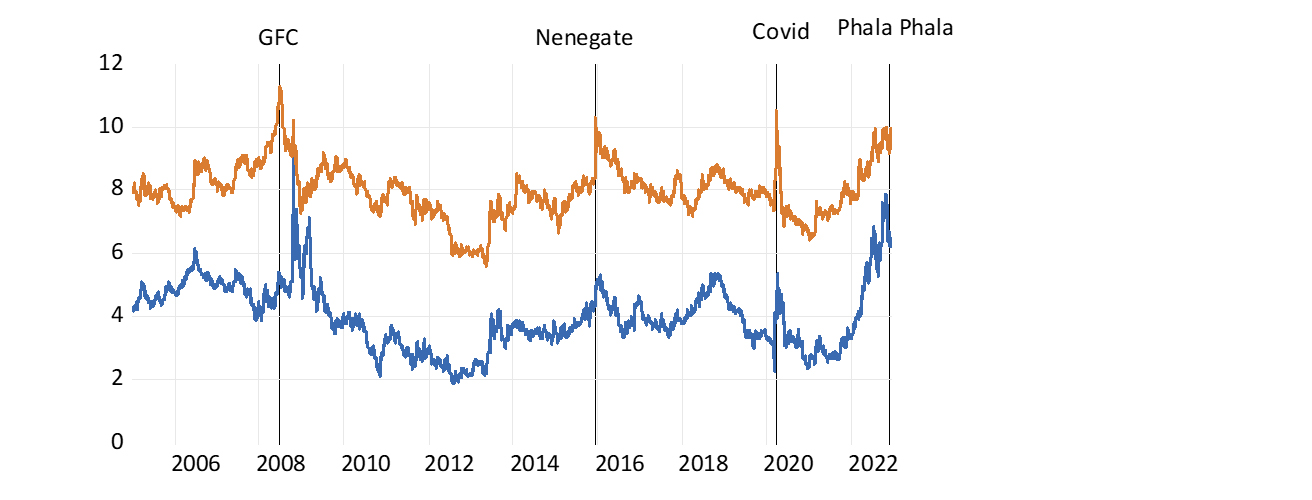
Source: Bloomberg and Investec Wealth & Investment, 8/12/2022
South African risks remain elevated, as are long-term interest rates generally, and the cost of servicing our national and private debt remains a permanent danger to our solvency and growth prospects. It’s essential to address our fiscal policy issues. To this end, I was struck by these remarks that were perhaps influential:
“Finance minister Enoch Godongwana said on Friday (2 December) he expects President Cyril Ramaphosa to remain in the job but if he does quit it will not affect economic policy.….. Economic measures that will be announced in the February budget will follow on from the budget update in October.” Bloomberg, 02/12/2022
About the author

Prof. Brian Kantor
Economist
Brian Kantor is a member of Investec's Global Investment Strategy Group. He was Head of Strategy at Investec Securities SA 2001-2008 and until recently, Head of Investment Strategy at Investec Wealth & Investment South Africa. Brian is Professor Emeritus of Economics at the University of Cape Town. He holds a B.Com and a B.A. (Hons), both from UCT.
Receive Focus insights straight to your inbox
You may be interested in the following Investec products

Wealth Management
Portfolio Management

Offshore Investments
Global diversification is a must. Investec’s offshore investments give you access to the world’s leading companies and fund managers.
Wealth Management
Portfolio Management
Offshore Investments
Global diversification is a must. Investec’s offshore investments give you access to the world’s leading companies and fund managers.
PREVIOUS WEEKS' INVESTMENT INSIGHTS:

17 Nov 2022
Why the Fed needs to act to avoid recession
The market reaction to the release of US CPI data shows the extent to which the inflation dynamics have changed. Central banks should take note.
Professor Brian Kantor / Chief economist and strategist, Investec Wealth & Investment
New York on 10 November was one of those days that will be fondly remembered by those with skin in the game, in the form of investments in the equity and fixed-income markets. This was the day that the key S&P 500 index added 5.54% to its value by the close of trading and the more IT-exposed Nasdaq added even more, 7.35%. These moves were the largest on any one day since the world came to realistic terms with the damage caused to their economies by the lockdowns of 2020.
Government bonds, which typically make up 40% of any conservatively managed portfolio, also became significantly more valuable as longer-term interest rates receded sharply. The yield on the benchmark 10-year Treasury fell from 4.14% to 3.82, on the same day, the largest such daily move since 2009 (the dollar value of bonds moves higher as yields decline). On the following day, as an illustration, the JSE All Share Index had gained 3.2% by 11h15, while the rand was up 2. 7% against the US dollar by mid-morning.
The source of all the good news was unusually obvious. US inflation for October reported that day was surprisingly low. Simply put, the (new) expectation of less inflation implied less aggressive Federal Reserve policies and lower-than-previously-expected short-term interest rates. Furthermore, the higher probability of the US avoiding recession added present value to stocks and bonds. The trend to lower inflation was further confirmed later, with similarly favourable market reactions: producer prices also surprised on the downside with prices rising by a month-on-month 0.2% in October, half the rate expected by the market.
The Fed, having been so completely surprised by the surge in inflation in 2021, seems determined to march the US economy into recession to eliminate an inflation that they seemed unable to forecast with any degree of confidence. Monetary policy has become data-driven, guided by the view through the rear window. This has been accompanied by the fear that persistently high inflation could become a self-fulfilling tragedy for the US economy. The approach of the Fed seemed to be that, if a recession was the price to pay for avoiding permanently higher inflation, then recession it would have to be, much to the discomfort of the US share and bond markets. For the year to 15 November, the S&P 500 is down by 17% and the benchmark bond index is about 12% lower.
US stocks and bonds in 2022. (1 January 2022 = 100)
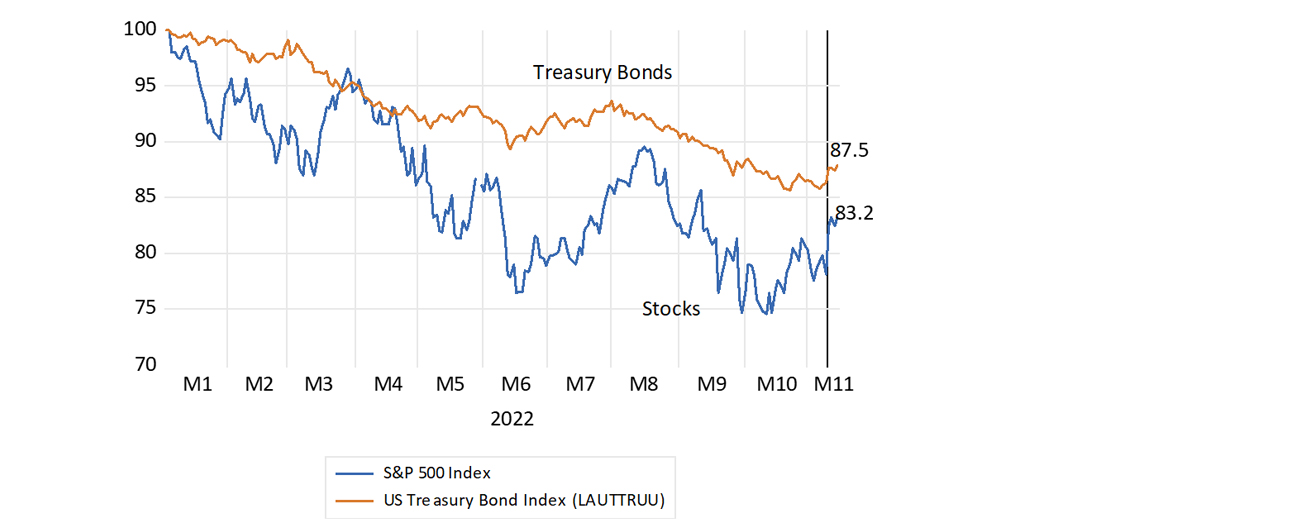
Source: Bloomberg and Investec Wealth & Investment, 16/11/2022
But should the Fed and the market have been so surprised? Surely not – if it had been closely following recent trends in inflation and spending by households and firms, then it would have appreciated why inflation had come to a screeching halt since its peak of 9.1% in June 2022. A year can be a very long time for an economy. The consumer price index (CPI), which was 9% higher in June 2022 than a year before, has flat-lined since June 2022. Consumer prices had stopped increasing in June and the increase over a rolling three-month period has slowed to a 2.3% annualised rate. If this trend in the CPI continues, then the inflation rate will still be a high 6.9% at year-end, but will then fall away sharply to less than 1% by June next year. US headline inflation is apparently on a path to zero.
Inflation in the US
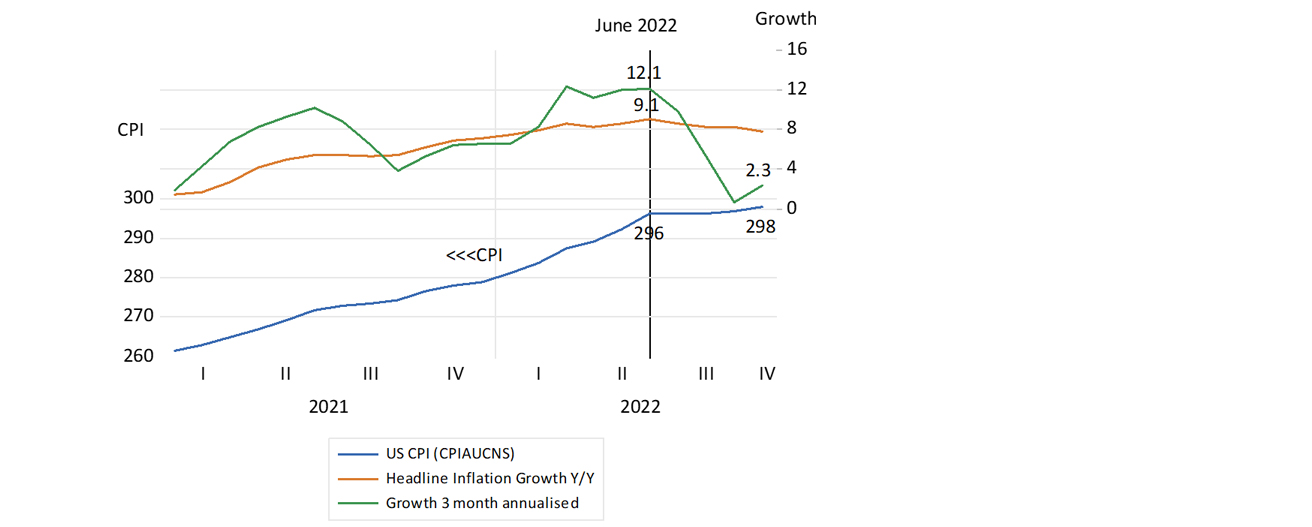
Source: Federal Reserve Bank of St.Louis and Investec Wealth & Investment, 16/11/2022
The Fed should be acting accordingly, by recognising that aggregate spending in the US by households and firms has already slowed down markedly and does not threaten higher prices to come. The weakness of aggregate demand is restraining price increases. Higher prices to date have largely absorbed the spending power that was so boosted by vastly extra money supply and Treasury handouts provided in response to the lockdowns. Higher prices have their demand and supply side causes, but higher prices have their negative effects on spending power. Higher prices absorb disposable incomes and spending power. Higher wages – even given full employment in the US – have not fully kept up with higher prices, further restraining spending.
Inflation cannot perpetuate itself unless it’s accompanied by continuous increases in the demand for goods, which has not been the case in the US or Europe. The notion, endorsed by the Fed and many other central bankers (including the SA Reserve Bank), that higher prices and wages can simply perpetuate themselves, is a false notion. Inflation expectations soon run aground on the rock of deficient demand and unintended excess inventories. This theory of self-perpetuating inflation will not pass the test of evidence. The Fed and the market should be following the weak trends in spending closely. Ever higher interest rates could in these circumstances turn minimal growth in spending into spending declines – truly the stuff of recessions.
The Fed and the market would also be well advised to pay close attention to the trends in money supply growth. Inflation may be defined as a continuous increase in prices caused by an increase in the supply of money over the willingness to hold that extra money. All inflation is associated with excess supplies of money and the recent inflation in the US is no exception to this well-established rule.
A money supply explanation of the weakness of aggregate spending in the US also helps to explain why the demand for goods and services is growing so slowly. The important monetary facts are that money supply, broadly defined as M2 in the US, is now no larger than it was at the beginning of 2022. M2 amounted to US$21.62 trillion in January. By September, M2 had declined to US$21.46 trillion. The year-on-year growth in M2 that had peaked at an extraordinary 27% in early 2021 has slowed to a barely positive 3%, with the three-month growth rates now negative. Growth in commercial bank credit has also slowed down markedly. Year-on-year growth in bank credit was 7.6% in October 2022 while growth in bank credit provided has slowed to an annualised 1.6% over the past there months. The monetary, credit and price trends are pointing strongly to deflation rather than inflation by the end of next year. The market hopes that the Fed will recognise this in good enough time and avoid recession.
Money supply in the US (M2)
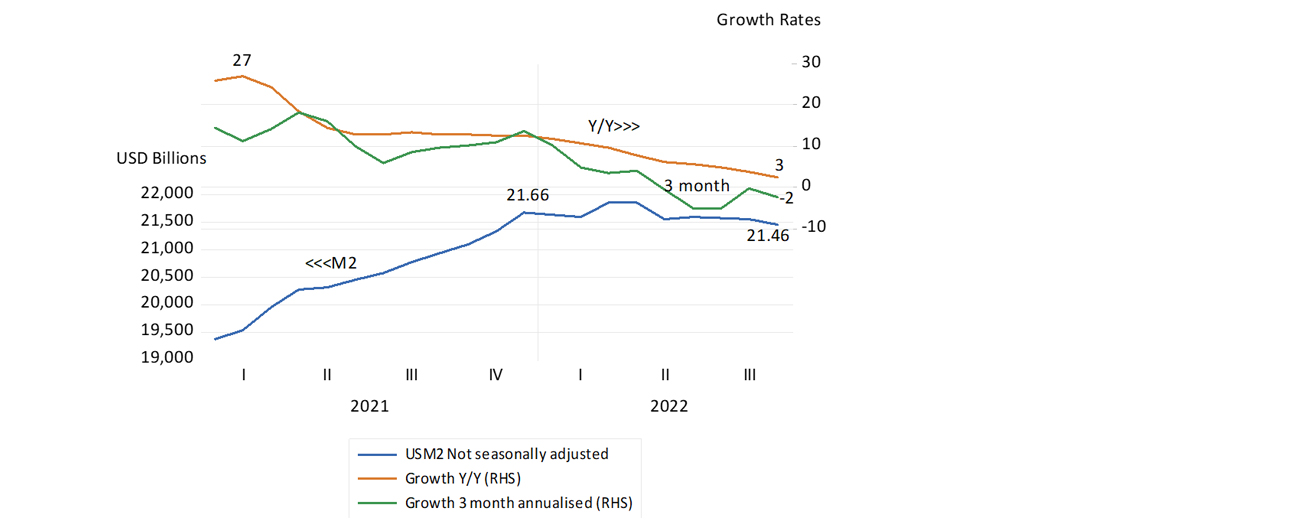
Source: Federal Reserve Bank of St.Louis and Investec Wealth & Investment, 16/11/2022

07 Jul 2022
Equities, volatility and an important lesson in risk
Equity market and volatility moves over the last few months have reminded us that managing risk is as important as seeking return.
Professor Brian Kantor / Chief economist and strategist, Investec Wealth & Investment
From its record heights of January 2022, the benchmark S&P 500 Index has fallen into bear market territory, defined as down by 20% from its most recent peak. The market has not gone quietly into the night. It has lurched across the street, in a series of wide daily moves – mostly down.
Not only has the market declined, but it has also become riskier and more volatile. The difficulty of predicting its value has raised the cost of insuring against such market risks, dramatically so. The closely followed Cboe Volatility Index, known as the VIX for short, which reflects the cost of an option to buy or sell the S&P 500 at current values, has more than doubled. From a below-average 16.6 in early January when the S&P Index stood at 4796, it reached 34 on 13 June (though it was at 36.5 in early March, soon after the Russian invasion of Ukraine), before ending the month of June at 28.7. The S&P 500 ended June at 3785 – down by 21%.
Since 2000, the average daily value of the VIX has been strongly mean-reverting, with a long-term average of 19. This is encouraging for those hoping for a return to something like a normal level of risk aversion. An increasingly risky environment has led rather than followed the share and bond markets. The negative relationship between changes in share market risk, as measured by daily moves in the VIX, and daily changes in the S&P 500 is statistically significant. The simple correlation has been close to a one-to-one (R = -0.85) in 2022. Trading the VIX or the market in 2022 will have given close to equivalent results. Taking on more risk of course demands more expected return, which is then assisted by lower market valuations. Hence, when risks rise, share and bond prices are likely to decline, so as to offer improved expected returns.
The S&P 500 and the Volatility Index (VIX) Daily percentage movements in 2022
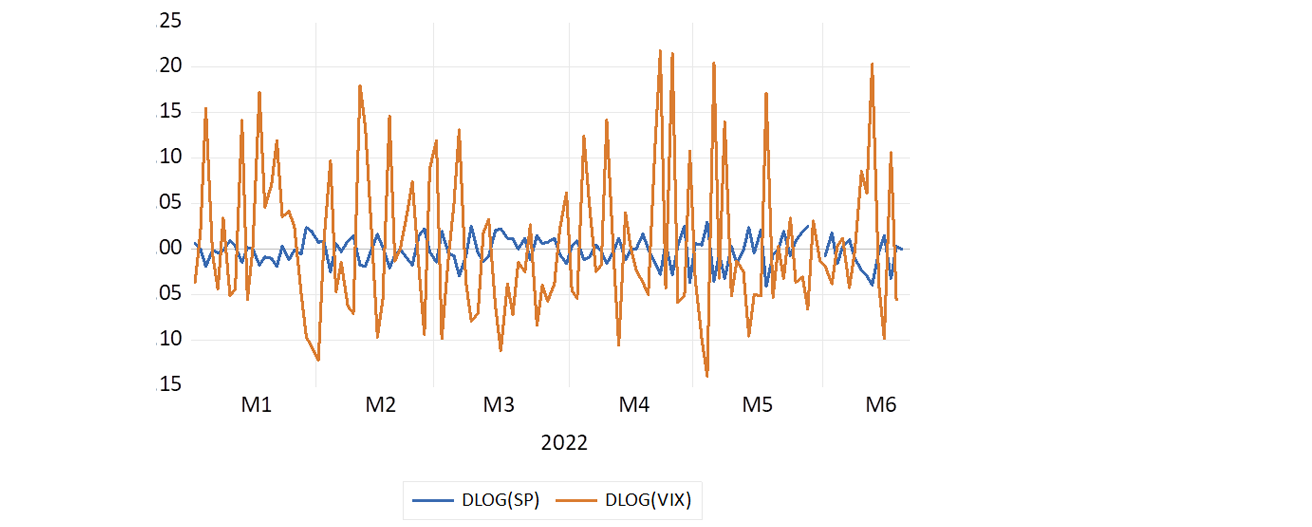
Source: Bloomberg and Investec Wealth & Investment, 21 June 2022
The relationship between daily moves in volatility (VIX) and the S&P 500 in 2022
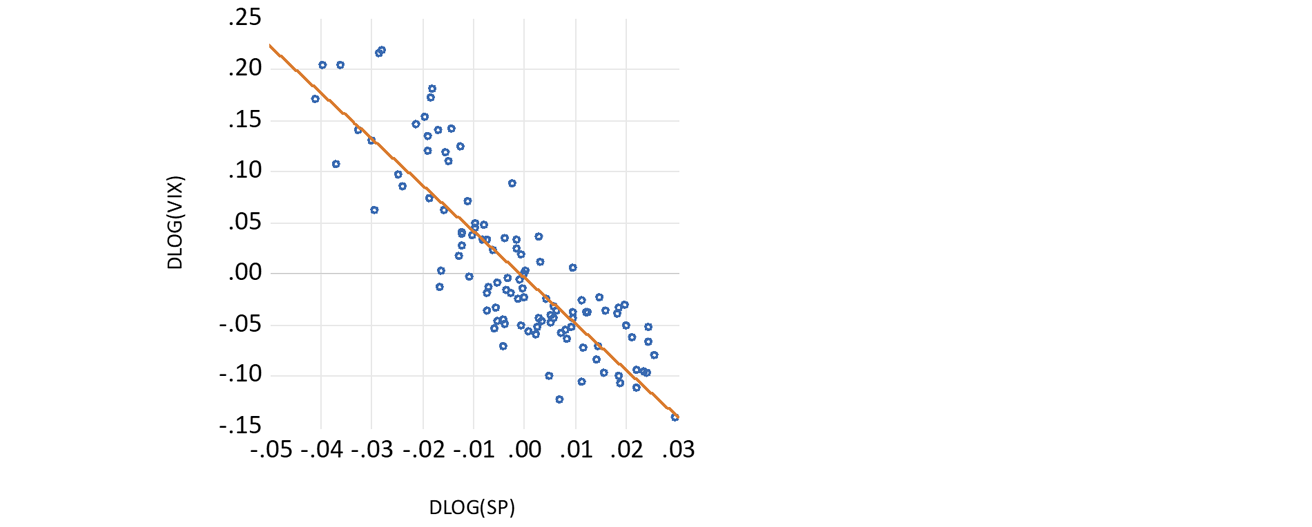
Source: Bloomberg and Investec Wealth & Investment, 21 June 2022
The volatility of the usually less risky market in US Treasuries has also increased dramatically and bond values have declined sharply in 2022. Long-term US bond yields have more than doubled in 2022 and bond values have declined in similar proportion. Bond market volatility is calculated off option prices on bonds in an index known as the Move Index. The Move Index has risen from 83 to 139 this year. Its long-term average is about 80.
US Treasury bond yields and volatility in 2022
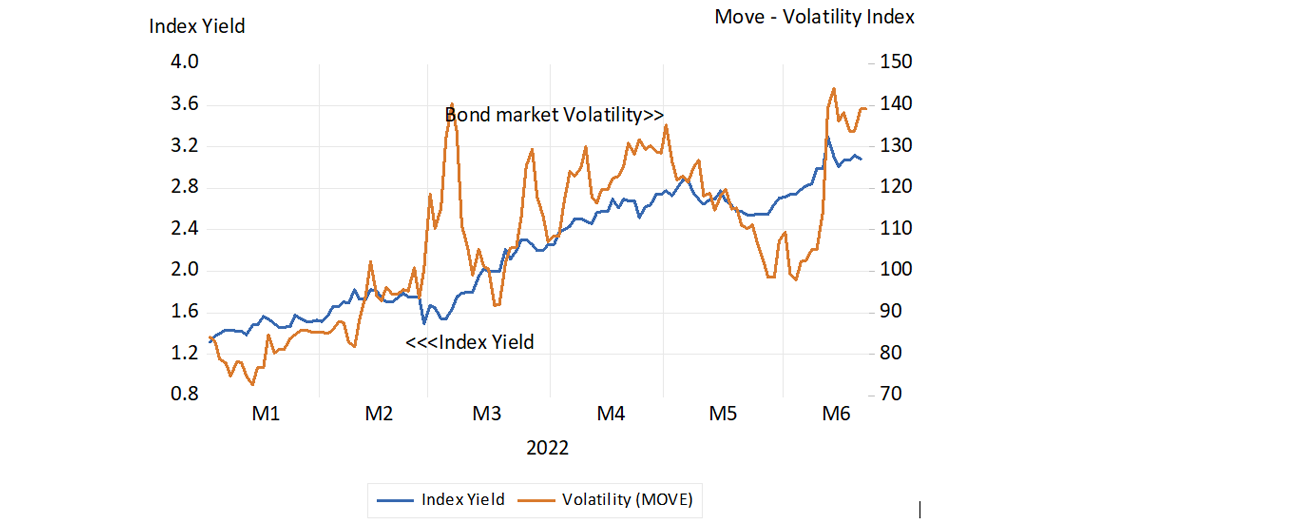
Source: ICE Move Index and Investec Wealth & Investment, 21 June 2022
The origin of these highly elevated market risks is clear. It lies in the way that the Fed and other central banks seem to be going from bad (allowing too much inflation) to worse – a recession that could follow aggressive interest rate increases and a consequently overly sharp reduction in spending. This is a danger that has been intensified by the post-Covid shortages of labour in the sectors of the economy most devastated by the lockdowns, which are recovering strongly. The ‘help wanted’ signs for waiters and airport baggage handlers will not be coming down soon and the unemployment rate in the US is likely to remain very low.
A full employment recession is not in the Fed playbook. However, it perhaps should be in these unusual times that have seen extraordinary stimulus followed by inflation (that could well prove to ultimately be transitory should the right policies be adopted). The optimists in global equity markets must hope that the perceived dangers of Fed errors will decline. If they do, daily volatility will decline and share prices will trend higher.
The relationship between risk and return is easily ignored after the event because the risks assumed have often turned out to be overestimated. When returns are measured and have exceeded the returns provided by an objectively better-diversified and less risky portfolio, the fee-charging, risk-conscious investment adviser is unlikely to be appreciated. But managing risk is as important as searching for returns – you never know for certain what will happen and avoiding risk can be a valuable exercise. The risks taken to achieve the returns realised should be well recognised when evaluating investment performance – as should market risk – given that some markets are riskier than others.

11 Oct 2021
Global inflation – South Africa is not a typical case
While inflation rises across the globe, South Africa’s monetary and fiscal authorities should take note of the weak state of demand locally.
Professor Brian Kantor / Chief economist and strategist, Investec Wealth & Investment
Prices are busting out all over the world. Prices charged by all US producers are 20% higher than they were a year before. Consumer prices were up by a ‘mere’ 5% in August, and that was before the recent tripling of natural gas prices.
US headline inflation rates (annual percentage growth in consumer and producer prices)
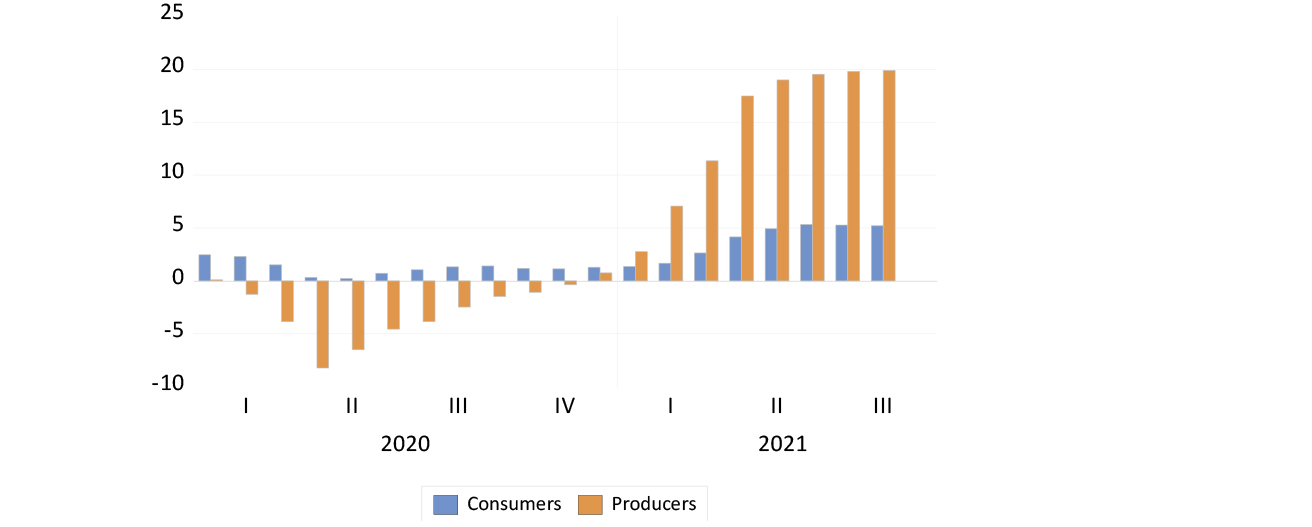
Source: Federal Reserve Bank of St Louis, Investec Wealth & Investment, 6 October 2021
US headline inflation rates (monthly percentage growth in consumer and producer prices)
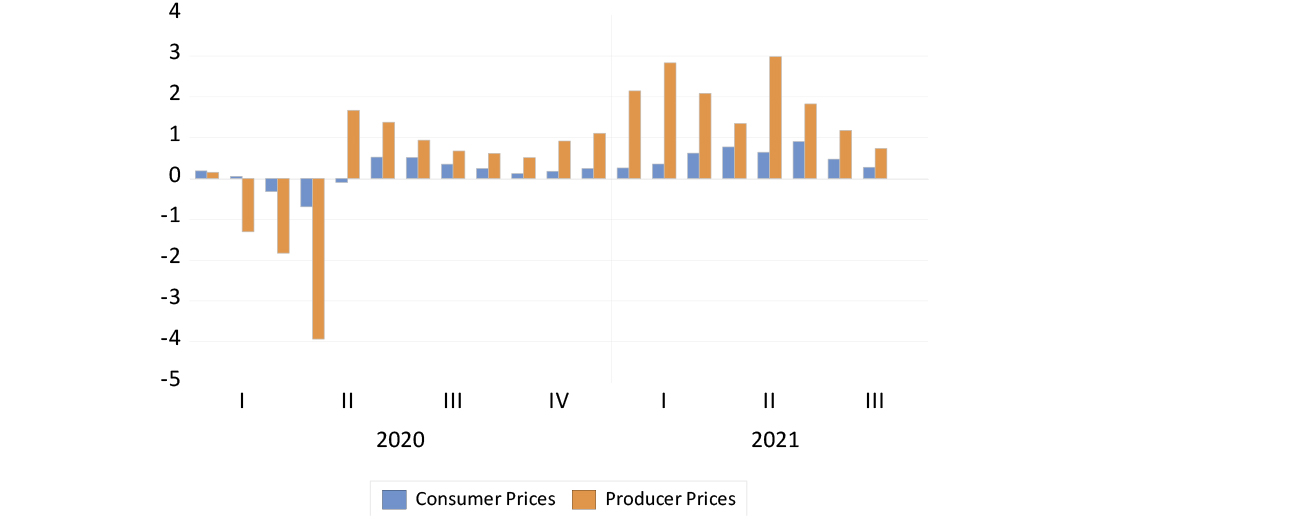
Source: Federal Reserve Bank of St Louis, Investec Wealth & Investment, 6 October 2021
The cause of higher prices is clear enough. They are a response to buoyant demands stimulated by Covid-inspired extra government spending and central bank funding of much larger fiscal deficits that have dramatically increased the supply of money (bank deposits) held by households and firms. In the US, these savings have also reduced the incentive for people to get a job – of which there is an unusual abundance, as firms struggle to match surprising strength in demand with extra output and willing workers.
This mixture of strong demand with constrained supply has caused prices to rise. The effect of higher prices is also predictable. Higher prices reduce demand while they serve to encourage extra output. They also act as a drain on disposable incomes and spending power. Higher prices, particularly when they respond to supply side shocks, can therefore lead to slower growth as these higher charges work their way through the economy.
What is critical therefore for the control of longer-term inflation trends is how the monetary and fiscal authorities react to this slower growth. Should they attempt to mitigate the impact of higher prices on growth by stimulating demand for goods, services and labour, then the temporary surge in inflation can become longer lasting. Firms and trade unions will then budget for expected and uncertain inflation.
Central bankers believe that inflation depends on inflation expected, modified by the state of the economy. Independent central banks accept responsibility for the state of demand, but they hope that inflation expectations are anchored at low rates, to make their task of containing inflation an easier one. The markets, to date, have largely believed that the observed rise in inflation is a temporary one. But the markets will be watching the reactions of the fiscal and monetary authorities closely for signs of the policy errors that can turn a temporary supply side shock into enduringly higher inflation.
South Africa – not a typical case
It is striking how the South African economic circumstances have not been typical. We too will have to deal with an energy price shock that will depress demand. But demand already remains depressed. Particularly depressed since 2016 have been the demands of firms, including the public corporations, for plant, equipment, workers and credit.
Real gross fixed capital formation by type of organisation
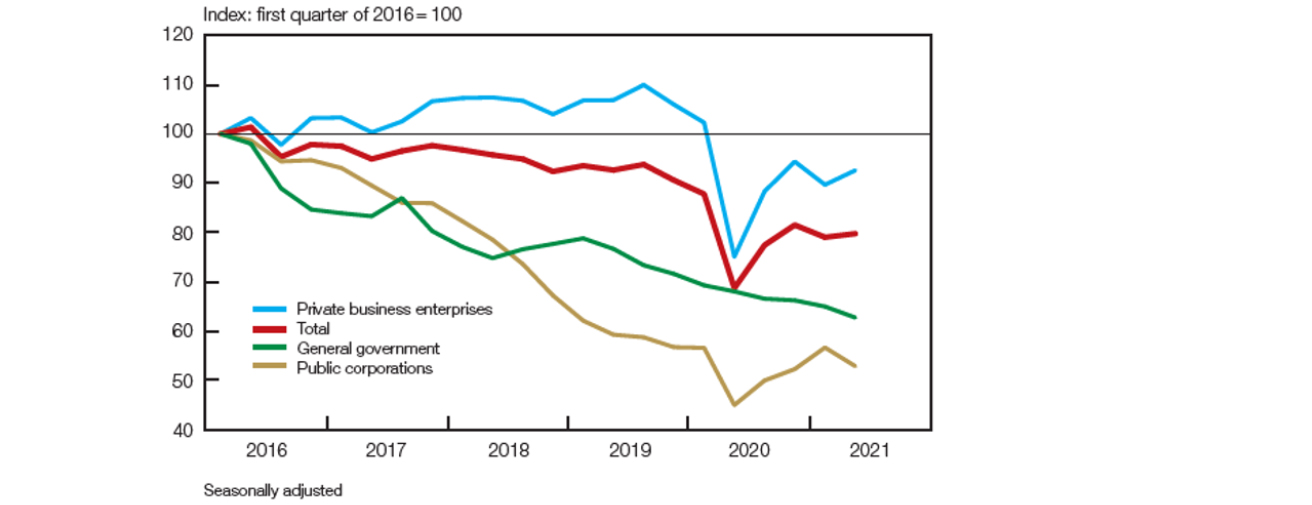
Source: Stats SA, SA Reserve Bank, 28 September 2021
Households have helped to sustain spending, but only a little. Total spending by households grew by 1% in the first quarter of this year, but only by half as much in the second quarter. Those in jobs have earned more, yet many more (over a million) have lost their jobs since the lock downs. Formal employment outside agriculture is now below 2009 levels.
Formal non-agricultural employment
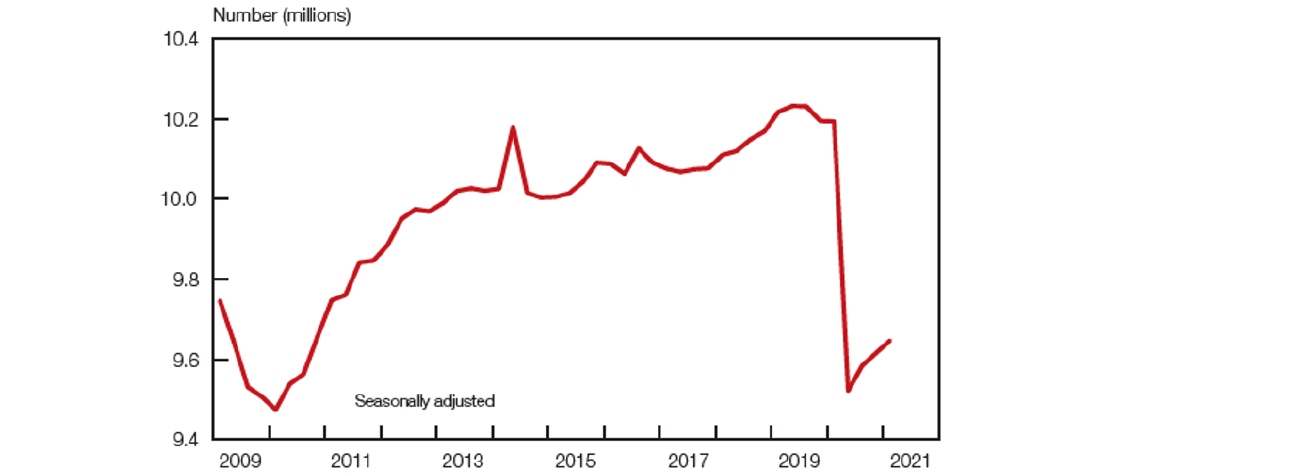
Source: Stats SA, SA Reserve Bank, 28 September 2021
The money supply has flat lined as nominal GDP has grown strongly. The closely watched government debt-to-GDP ratio has been further reduced by extraordinary growth in government revenues. Tax receipts have accelerated in response to the global inflation of metal prices that make up the bulk of South Africa’s exports; so much so that the total borrowing requirement of the government in all its forms has declined from 13.5% of GDP in the first quarter of last year to as little as 1.8% of GDP in the second quarter of this year. Fiscal austerity has been practised in Covid-ravaged South Africa. And monetary policy, judged by its effects on money and credit supply, has not been accommodating enough.
Money supply and gross domestic product
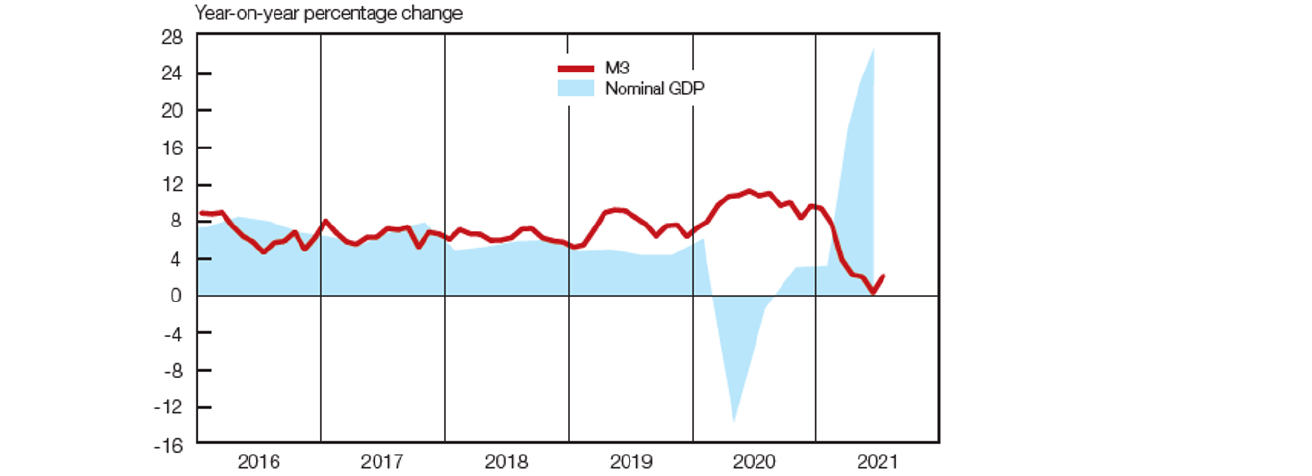
Source: Stats SA, SA Reserve Bank, 28 September 2021
The output gap – the potential supply exceeding realised spending – is likely to remain persistently wide. Inflation expectations therefore remain unaltered. The case for higher interest rates to further depress demand seems weak in the circumstances. Yet the gap between short- and long-term interest rates has widened further in recent days. This implies an expected doubling of policy determined rates over the next three years.
The slope of the SA yield curve (SA 10-year yields minus money market rates)
Source: Bloomberg, Investec Wealth & Investment, 6 October 2021
The bond market indicates that any improvement in South Africa’s fiscal circumstances is sadly expected to be temporary rather than permanent. It can prove otherwise with fiscal discipline and sympathetic monetary policy.

8 July 2021
GDP and balance of payments: less encouraging than it appears
Encouraging capital expenditure is the key to increasing economic growth.
Professor Brian Kantor / Chief economist and strategist, Investec Wealth & Investment
South Africans have become large contributors to the global savings pool, contributing R169.7bn (US$10.7bn) in investment abroad over the past three quarters, equivalent to an average 4.3% of GDP. Over the extended period of 2010 to 2019, SA raised an average R35.7bn or US$3.25bn of foreign capital each quarter, equivalent to -3.6% of GDP. We are now less dependent on foreign capital, with only one deficit, a fiscal deficit. However, this is not the good news story that it might appear at first to be.
Figure 1: SA’s net quarterly borrowing and lending (R millions)
Source: SA Reserve Bank and Investec Wealth & Investment, 30/06/2021
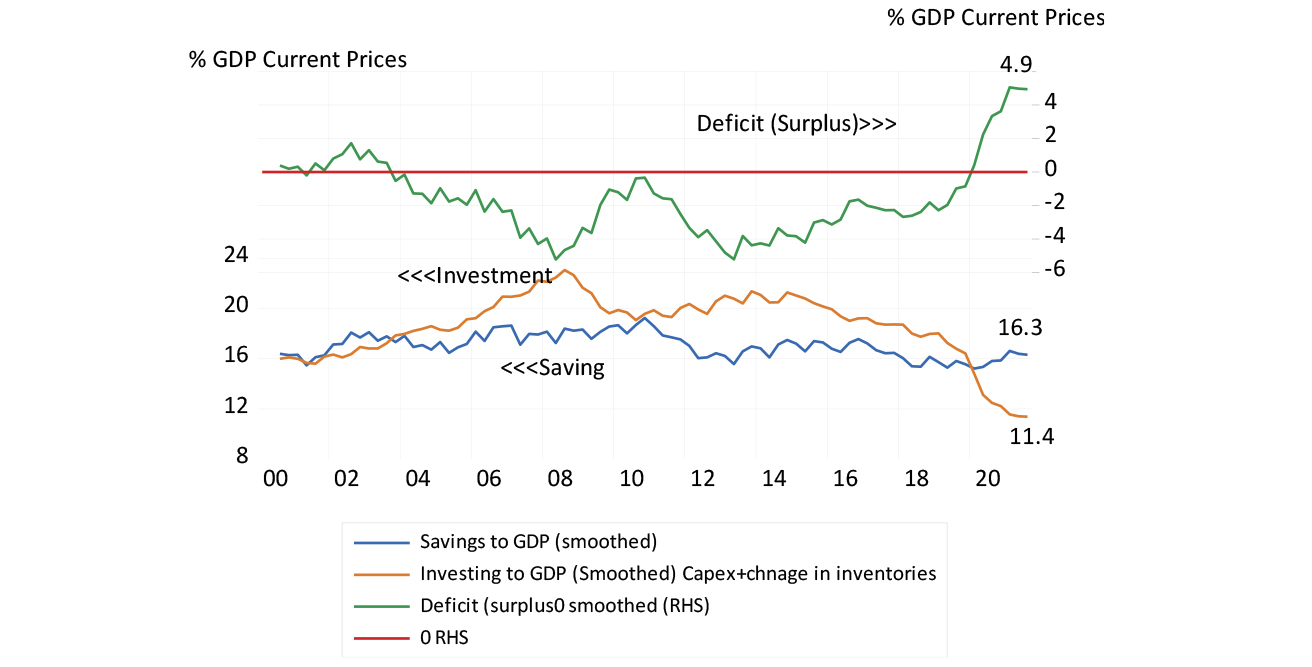
These flows abroad have come at the expense of expenditure on capital goods, which are now equivalent to only 15% of GDP. The savings rate to GDP, 17.3 % in Q1 2021, has held up much better than the investment rate. The difference between savings and capital expenditure is equal to the current account surplus on the balance of payments, which is equal to the capital outflows and now strongly positive. Since 2000, the quarterly savings rate has averaged 17% of GDP and the investment rate 18.6% of GDP, including changes in inventories and all capital expenditure. Savings are defined as the difference between gross national income and household, and government consumption expenditure.
Both the savings and investment ratios are unsatisfactorily low and not helpful for long-term growth. But it is a case of chicken and egg. If we succeeded in growing faster, by adding more vigorously to the capital stock, the government and business would have no difficulty in attracting capital from foreign and domestic sources on more attractive terms, to fund a higher rate of profitable and growth in income-inspiring investments. The constraint on growth is not a lack of savings but a lack of capital expenditure. There is no lack of global savings, only a lack of incentives to put more capital to work in SA.
Figure 2: Savings and investment to GDP ratios in SA
Source: SA Reserve Bank and Investec Wealth and Investment, 30/06/2021
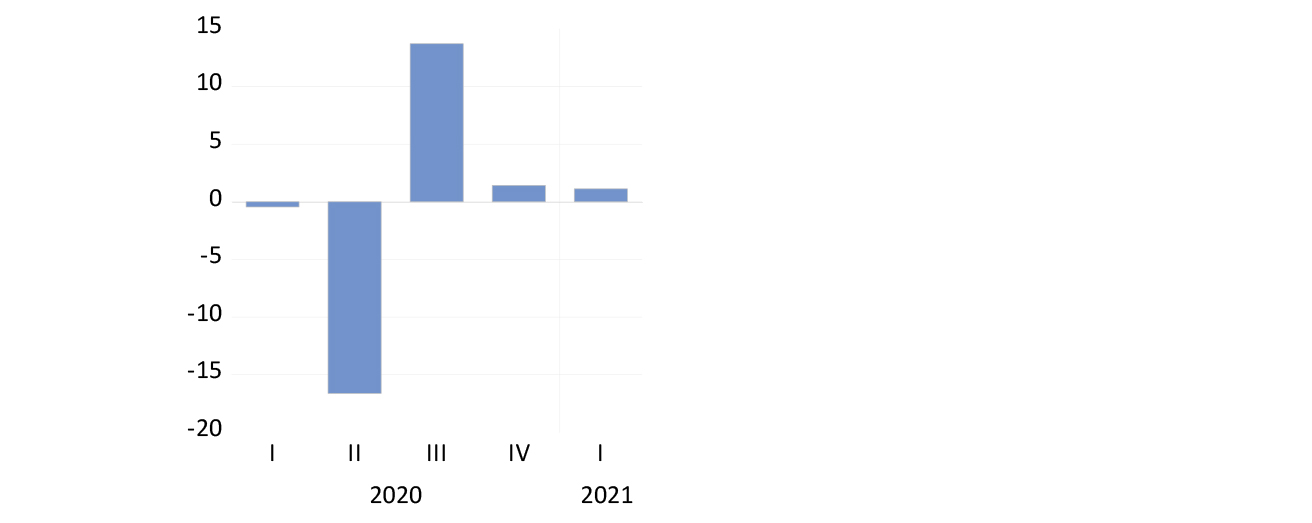
The latest economic growth news released late last month was not encouraging. The pace of the recovery of the economy has slowed down: real GDP grew by 13.7% in Q3 when recovering from the 16.6% decline registered in Q2. However, it grew by a minimal 1.43% in Q4 and has slowed further, to 1.13% in Q1 this year.
Figure 3: Growth in Real GDP (seasonally adjusted, quarter-on-quarter)
Source: SA Reserve Bank and Investec Wealth & Investment, 30/06/2021
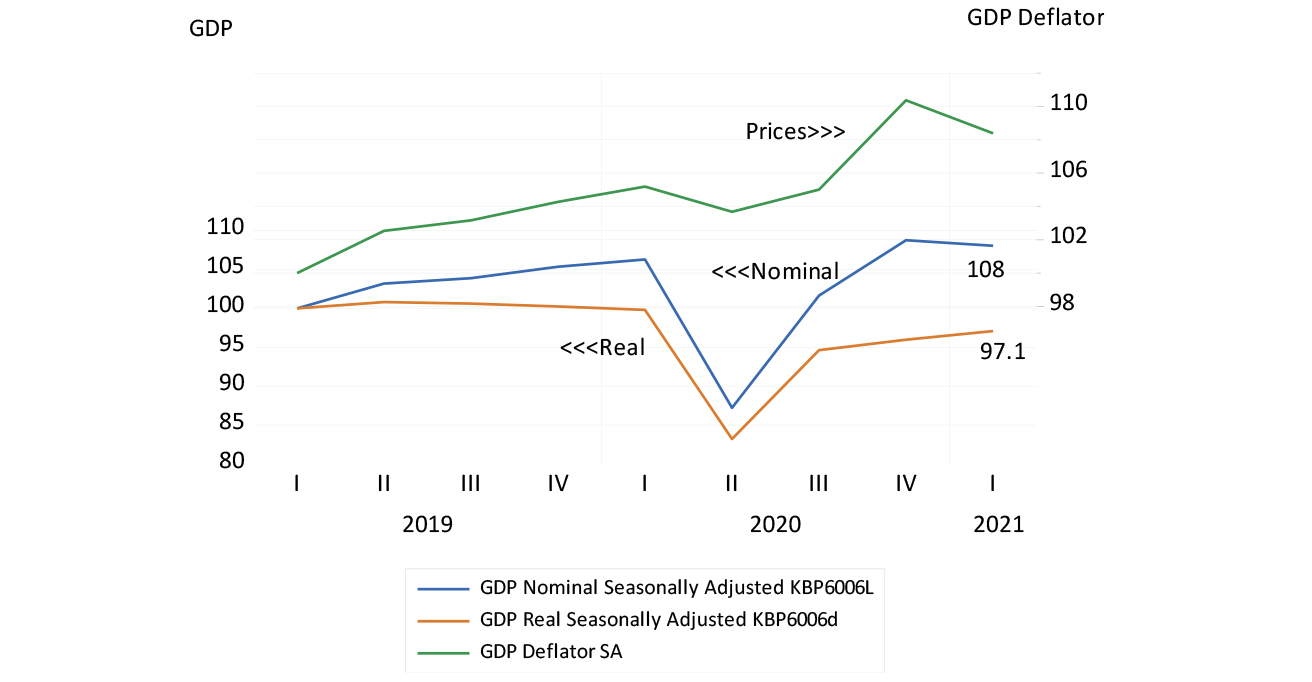
In the chart below, we compare quarterly GDP at current prices with real GDP, both seasonally adjusted and converted into an annual equivalent amount, with Q1 2019 taken to have the value of 100 as the base. Nominal GDP declined in Q1 even as real GDP grew slowly. This implies that prices as represented by the GDP deflator, calculated quarterly, fell in Q1, which is indeed the case for the prices included in the GDP number, when seasonally adjusted. Seasonal adjustments based on a long time series may not apply as normal after lockdowns.
Figure 4: GDP – nominal, real and prices (2019 = 100)
Source: SA Reserve Bank and Investec Wealth & Investment, 30/06/2021
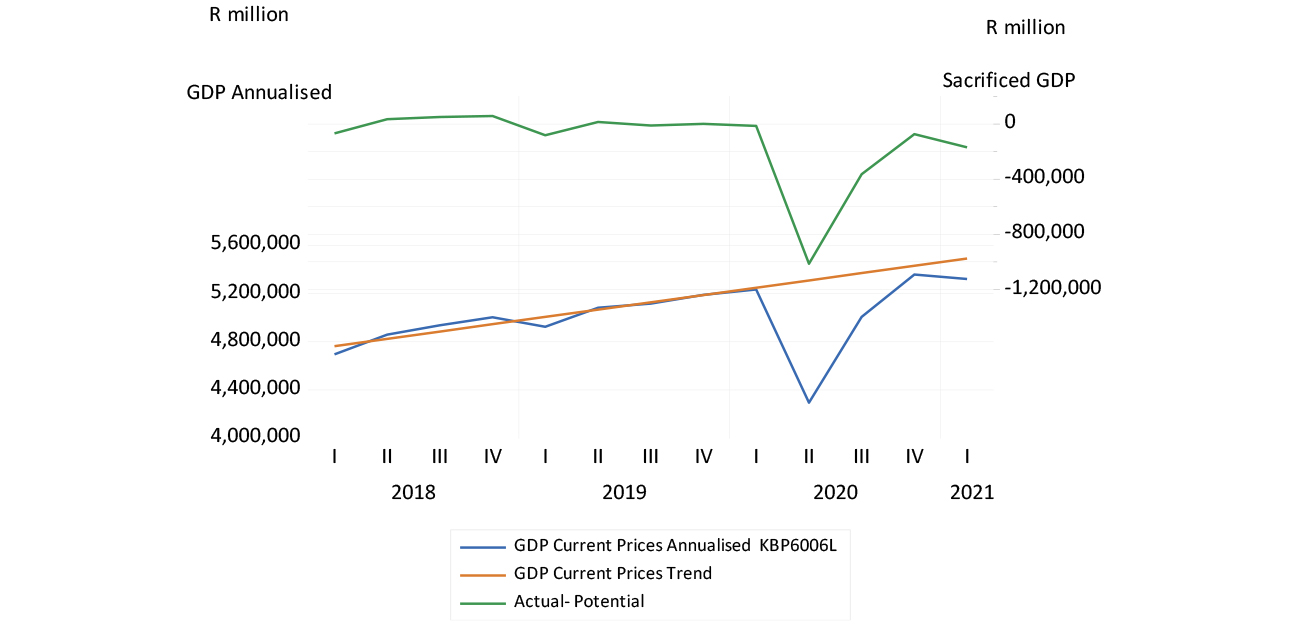
The slower growth has widened the gap between what the economy might have produced without the lockdowns, and what has been produced. And the latest lockdown will have added to the enormous sacrifices of income made so far. The losses of output and incomes – the difference between actual and pre-covid potential output – could be the equivalent of 25% or more of the potential GDP in 2021, or R1 trillion in money of the day.
Figure 5: Annualised growth in nominal GDP – potential and actual growth (annualised)
Source: SA Reserve Bank and Investec Wealth & Investment, 30/06/2021
M3 money supply (bank deposits) was up by a mere 1.26% in May 2021 on the year before and bank credit supplied to the private sector has declined by 0.42% year-on-year. This has been a strong headwind for the economy. The economy cannot realise anything but tepid growth in such monetary circumstances. Yet interest rates are currently expected to add to the strength of these head winds. Money market rates are expected to increase by over one percentage point over the next six months, and the term structure of interest rates indicates that the interest rate on a one-year loan to the government will nearly double over the next three years, from 4.64% to 8.2%.
The Reserve Bank, on the occasion of its centenary, appealed to the government to lower its debt-service costs, by doing the right things, a sentiment we fully share. Without lower long-term interest rates, other government spending is sacrificed to pay the interest bill, as the Bank warns. But more importantly, the incentive to add to the capital stock will remain as restricted as it is, given high long-term interest rates. An average SA firm contemplating adding to its plant and equipment is required to return about a demanding 9% real return on its capex. That is a return at least equal to the government bond yield of 10% plus 5% for equity risk, less inflation expected of 6%. This real cost of capital needs to come down if we are to grow faster.
The Reserve Bank would do well to reflect on what it might do now to promote the growth necessary to reduce SA risks and long-term interest rates. The answer, we argue, is that the Bank should not allow short-term rates to rise and do what they can do to increase the supply of money and credit, without which growth in spending and output cannot materialise.

24 June 2021
A monetary tale of two economies
SA’s monetary authorities could learn something from their US counterparts when it comes to dealing with the destruction of incomes caused by the pandemic.
Professor Brian Kantor / Chief economist and strategist, Investec Wealth & Investment
The steps taken in the US to counter the destruction of incomes and output caused by the lockdowns of economic activity can be regarded as a resounding success. Real US output is now ahead of pre-covid levels. By the end of 2021, GDP could well surpass the GDP that might have been expected absent the lock downs. It took a great deal of income relief in the form of cheques in the post from Uncle Sam, supplemented by generous unemployment benefits and relief for businesses.
The extra income means an increase in deposits, in other words money placed with the US banks, to be spent later or exchanged for other financial assets.
Deposits held by banks with the Federal Reserve System have increased by 85%, and deposits at the commercial banks have grown by 26% since March 2020. The source of the extra cash, the deposits at the commercial banks and the Fed, has been additional purchases of government bonds and mortgage-backed securities in the debt markets from the banks and their clients, which are being maintained at the rate of US$120bn a month.
The assets and the liabilities of the Fed have increased by 36% over that period. This is money creation on an awe-inspiring scale and it has worked, as intended, to promote demand for goods and services. Providers of goods and services are struggling to keep up with demand, while also struggling to add to payrolls, leading to upward pressure on prices. The US CPI was up by 5% in May – a rate of inflation not seen since 2008 and before then only in the 1990s.
Inflation in the US – annual percentage changes in CPI
Source: Federal Reserve Bank of St Louis and Investec Wealth & Investment, 15/06/2021
However, the outlook for inflation in the US is less obvious than usual. The Fed has been surprised by the pick-up in the inflation rate, as was indicated by the Federal Open Market Committee and Fed chief Jerome Powell’s press conference on 16 June. Powell remains confident that the increase in inflation is transitory and the Fed does not intend raising interest rates any time soon, at least not until the economy has returned to full employment, which is judged to be some way off.
(It should be noted that full employment may mean a lower number than previously estimated, given that two million potential workers have withdrawn from the labour market since the lockdowns. They may however wish to return to employment should the opportunities to do so present themselves; this is one of the uncertainties the Fed is trying to deal with as it looks to understand the post-Covid world.)
A number of Fed officials however have brought forward the time when they think the Fed will first raise its key interest rates, to the first quarter of 2023, a revision that surprised the market and moved long-term interest rates higher. The bond market nonetheless remains of the view that inflation in the US over the next 10 years will remain no higher than the 2% average rate targeted by the Fed. The Fed will be alert to the prospect that more inflation than this will arise.
A tale of two central banks
The contrast of the actions of the Fed with those of the South African Reserve Bank (SARB) is striking. The SARB balance sheet contracted by R115bn, 10.8%, between March 2020 and May 2021. Since January 2020, the sum of notes issued plus deposits of the banks with the SARB (the money base) has declined by 6%, the supply of bank deposits (M3) has grown by a paltry 4% and bank credit by 2%. These are shocking figures for an economy struggling to escape a deep recession.
The SARB may be of the view that money and credit are less important for the economy, and that changes in interest rates are the only instrument they have to influence the economy.
Monetary comparisons between SA and the US (March 2020 = 100)
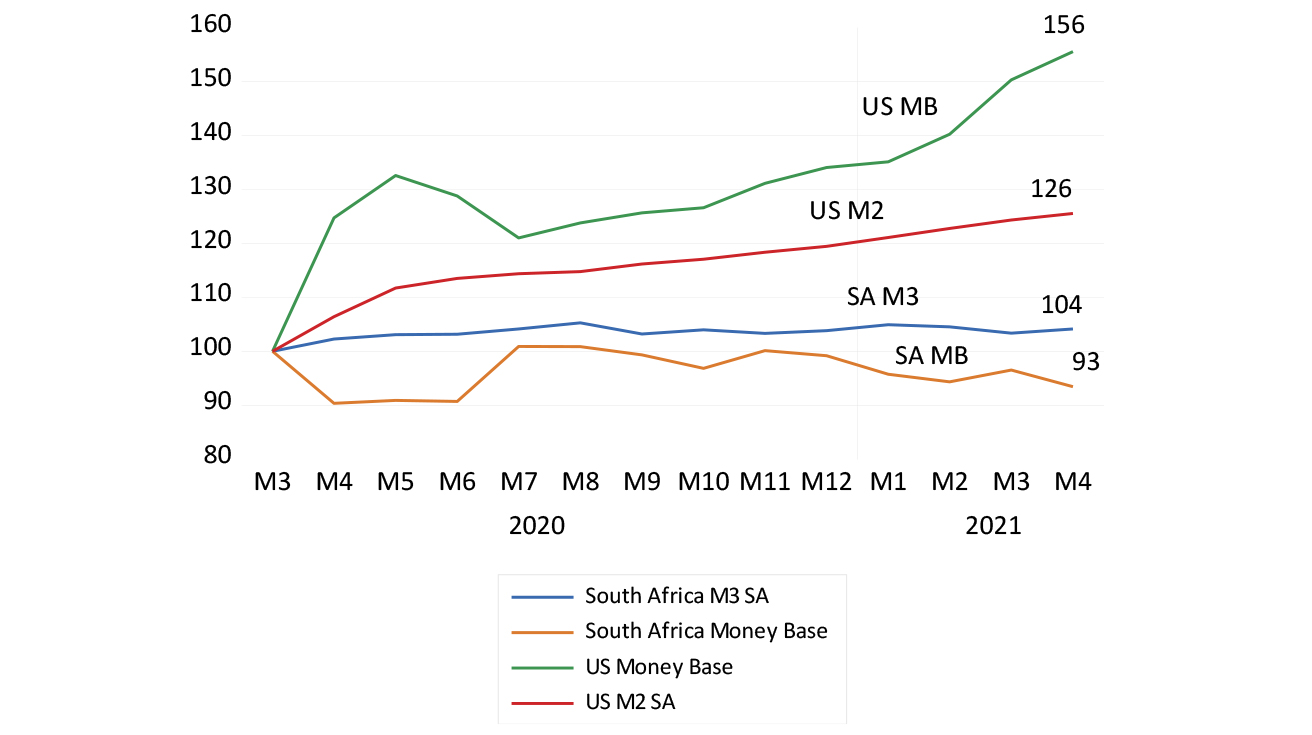
Source: SA Reserve Bank, Federal Reserve Bank of St Louis and Investec Wealth & Investment, 15/06/2021
The SARB seems to believe their lower interest rate settings have been accommodative and helpful to the economy. Higher interest rates would, of course, have been unhelpful and lower rates were certainly called for. However, the money and credit numbers indicate deeply depressing influences on the economy, influences that the SARB could and should have done much more to relieve, following the US example. There is more to monetary policy and its influence on the economy than movements in interest rates.
GDP in the US and SA (March 2000 = 100)
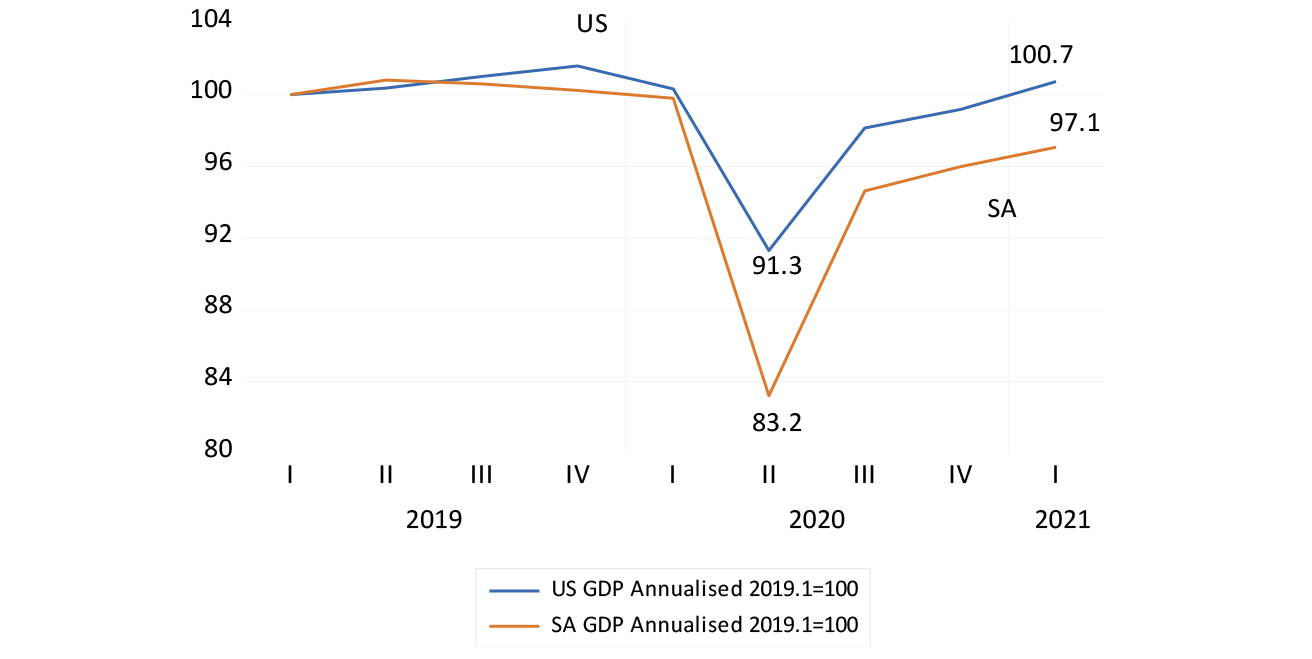
Source: SA Reserve Bank, Federal Reserve Bank of St Louis and Investec Wealth & Investment, 15/06/2021
It would be easy to despair of the prospects for the SA economy given the current, discouraging trends in the supply of money and credit. However, we can draw hope from the possibility that the US cavalry (with some Chinese assistance) will rescue us, in the form of rising prices for metals and minerals that are very much part of the inflation process currently under way in the US.
Metal prices have always led the SA business cycle, in both directions. They may well lead us out of the current morass, after which the supply of money and credit will then pick up momentum to reinforce the recovery, as they have always done in a pro-cyclical way. The responses to the lockdowns have made it clear how our monetary policy reacts to the real economy. A favourable wind from offshore may lift the money supply and bank credit, without which faster growth is not possible.

13 April 2021
Why property rights matter
Property rights underpin wealth creation and are essential for attracting investment and helping communities to escape deprivation.
Professor Brian Kantor / Chief economist and strategist, Investec Wealth & Investment
I once asked a meeting of law students if they knew why we have laws to protect our wealth and enforce the sanctity of contracts. They appeared to have little idea why, other than that it was morally wrong to steal, to perpetuate a fraud or not to be true to your word. Nobody had told them that protecting the rights to wealth was essential if wealth was to be created in the first instance.
If you saved and invested in a home, farm, mine or business enterprise, and somebody, stronger than you, could simply take it away, there would be no reason to save and invest in productive, long-lasting assets. Protection of wealth to encourage wealth creation is essential if any community is to become more productive and escape deprivation.
The power of a government to take what might be yours, gained fairly in exchange, is one of the obvious dangers to be averted in the public interest of increasing saving and capital expenditure. While there might be good cause for a compulsory purchase to advance a broad public interest, it should be facilitated by offering the market value of the asset as compensation. No compulsory expropriation without compensation is enshrined in our Constitution and legal practice, for good, income-enhancing reasons.
Having to offer full compensation to any owner is something of a deterrent to exercising any compulsory purchase order. The taxpayer, who also has political influence, will have to pay up for the assets. It’s an influence that is resented by those who have ambitions to change the world for what they believe will be the better and are frustrated by the lack of the means to do so. Just pay for what you wish to take, is the principle we should defend and honour.
South Africans are not just reluctant taxpayers. We are reluctant savers and maintain an unsatisfactory rate of capital accumulation. We still have to rely on foreign savings on a significant scale. We are dependent on capital that can be freely invested anywhere and is easily frightened off by threats to its being taken away by expropriation, or by changes in regulations affecting its market value.
The mere hint of expropriation of land and real estate, without compensation, makes foreign capital more expensive. Foreign investors command high expected returns to compensate for the risk of our taking it away or interfering with it. Hence our low rate of capital formation. An on-average risky JSE-listed company, to justify any addition to its plant and equipment, would have to offer a return of over 15% a year, or about at least a real 9% after expected inflation of about 6%. These are returns that few companies can confidently budget for.
Hence businesses are investing less, and saving less, by paying out more of their earnings in dividends. The ratio of JSE earnings to dividends has halved since 2010. They are retaining less because they are investing less in capex, for understandable reasons.
Figure 1: Ratio of JSE All Share Index earnings per share to dividends per share
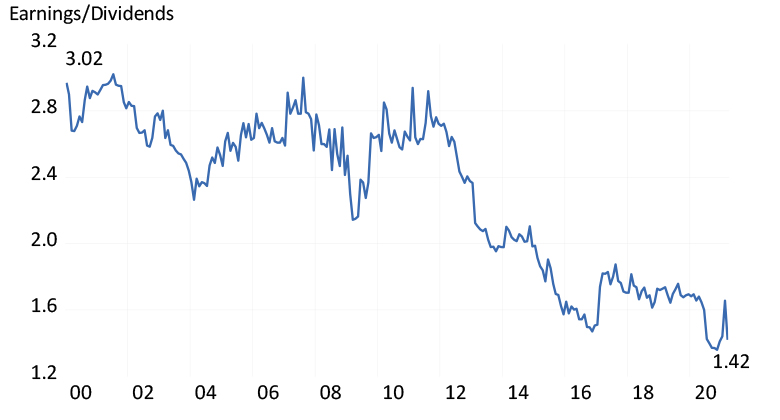
Source: Iress and Investec Wealth & Investment, 12/04/2021
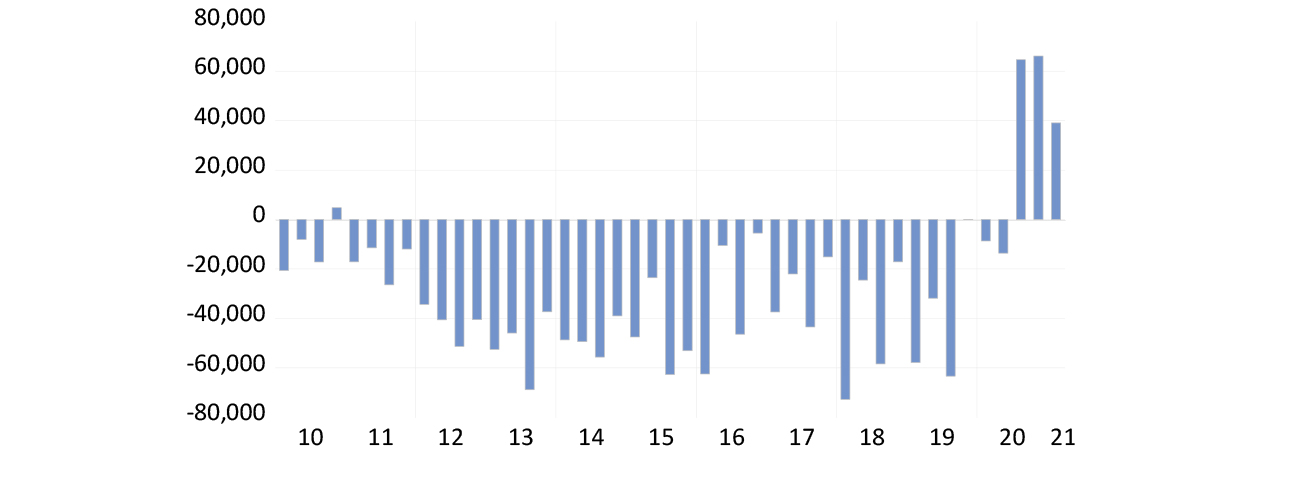
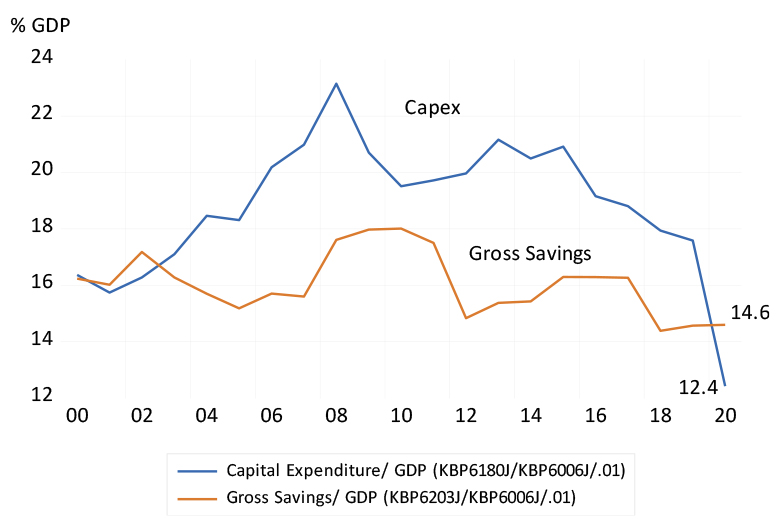
It has taken Covid-19 to bring the low rate at which South Africa saves above the dismal rate at which we are currently adding to plant and equipment, adding capital at the rate only of 12% of GDP in 2020. Accordingly, we have become a net lender to the world.
Reducing the risks of investing in SA will encourage more capital expenditure and savings in the form of earnings retained by business. We could then attract the necessary foreign capital at a lower cost than we are paying now. Reducing risks means sensibly reducing the threat of taking, not adding to it.
Figure 2: South African annual net foreign borrowing (-) or lending (+), 2000-2020 (R billion)
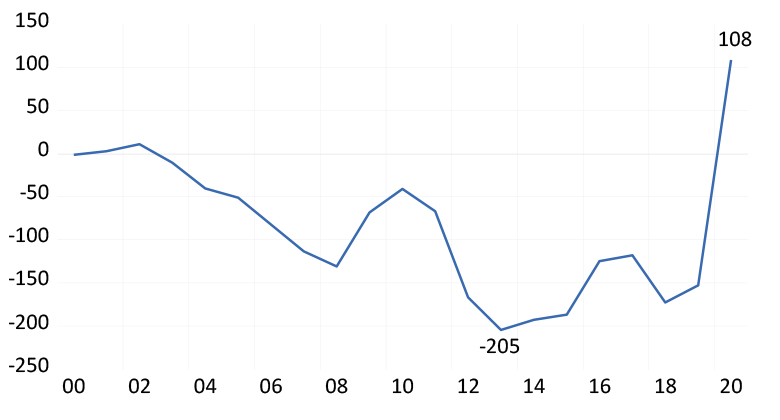
Source: SA Reserve Bank and Investec Wealth & Investment, 12/04/2021
Figure 3: South African ratio of annual capital expenditure and gross savings to GDP, 2000-2020
Source: SA Reserve Bank and Investec Wealth & Investment, 12/04/2021

29 March 2021
Inflation expectations will determine the success of the US stimulus package
Thanks largely to low interest rates, the US’s stimulus package is fiscally manageable. Fiscal restraint will be required however, to ensure it remains so.
Professor Brian Kantor / Chief economist and strategist, Investec Wealth & Investment
The US not only has old-fashioned cheques (checks), but checks in the post (mail) nogal. No fewer than 90 million cheques worth $1,400 each have been mailed so far to Americans earning less than $400,000, with more to come. The dollars will find their way out of the Federal Reserve Bank (Fed) into individual banking accounts, or cashed in, which will add to both bank deposits and the cash reserves of the banks with the Fed. Deposits with US banks are up by 26% since January 2020 and the cash reserves of US banks are up by 92%. Both represent huge firepower for additional spending on goods and services, and bank lending over the next year.
US growth in cash reserves of the banking system and growth in bank deposits
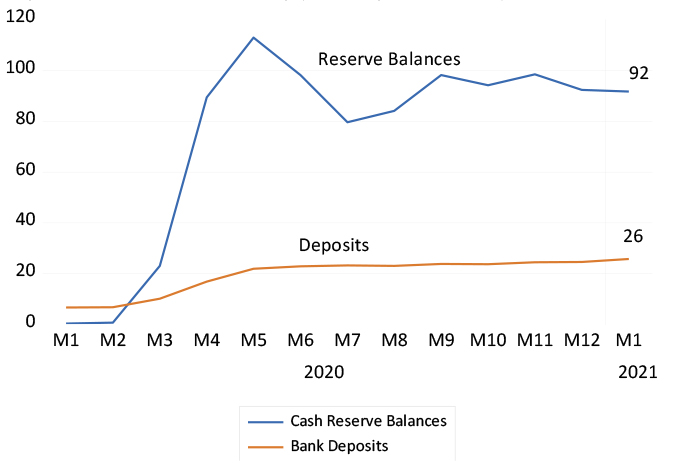
Source: Federal Reserve Bank of St Louis and Investec Wealth & Investment
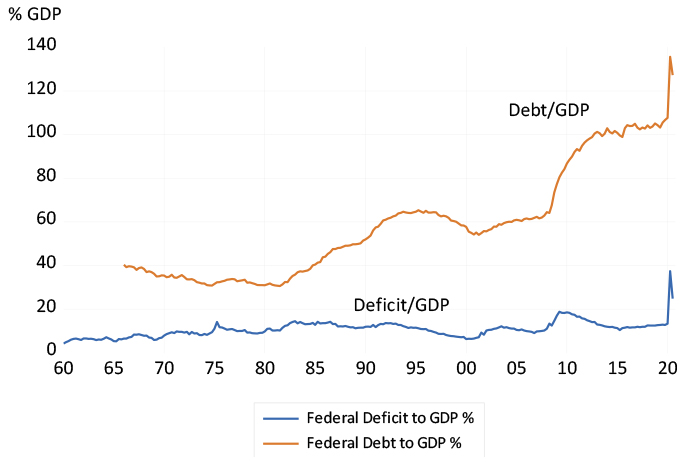
The debt-to-GDP ratio will rise to over 130% and the fiscal deficit will soon approach 30% of current GDP. But interest rates remain exceptionally low – the average interest paid on all US debt is only 2% a year and interest payments account for 9% of all federal spending. In 1990, interest payments accounted for 23% of the federal budget at an average interest rate on the debt of about 10%. In short, these are now comfortable fiscal conditions. These ratios improved appreciably in the 1990s, thanks to lower deficits. The borrowing requirements of governments can and indeed have to be restrained by some mixture of spending less and taxing more – both hard to do. Another $3 trillion of US government spending on so-called infrastructure is coming down the pike. There will be no fiscal crisis for the US on the horizon, if US borrowing costs remain low. But can they?
Average interest paid on US debt and Interest paid as a percentage of all Federal government spending
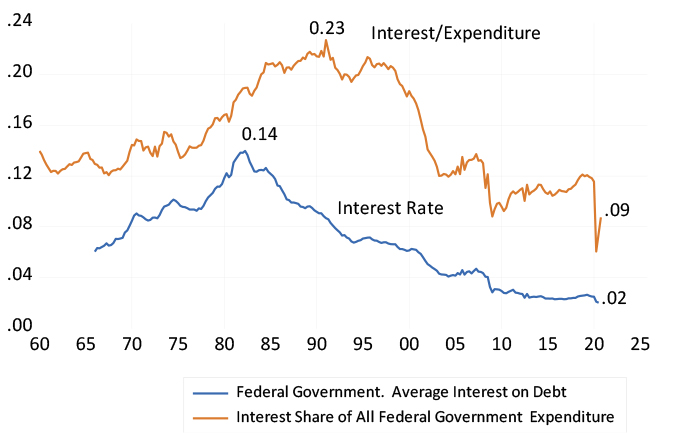
Source: Federal Reserve Bank of St Louis and Investec Wealth & Investment
It will depend on how much inflation is expected over the next 10 years. The higher the expectation of inflation, the higher the cost of raising government debt will be. Interest rates rise with higher inflation expectations in an almost lockstep way. The expected annual inflation rate over the next 10 years in the bond market is of the order of an unthreatening 2.2%. The higher the cost of borrowing, the more likely governments may resort to printing more money to fund their spending, which in turn will reinforce spending and increase the rate of inflation (and raise expectations of inflation).
All will depend on the scale of US borrowing expected over the next 10 years. It will have to slow down to something like normal to prevent the US Budget from being overwhelmed by higher interest rates. Janet Yellen, the Treasury Secretary, told Congress that taxes will have to rise to pay for the extra $3 trillion. Will they, or will the unpopular prospect of higher taxes restrain spending ambition? It will take more than taxing the rich to pay the piper.
US ratio of Federal government debt and fiscal deficits to GDP
Source: Federal Reserve Bank of St Louis and Investec Wealth & Investment
US Federal government deficits
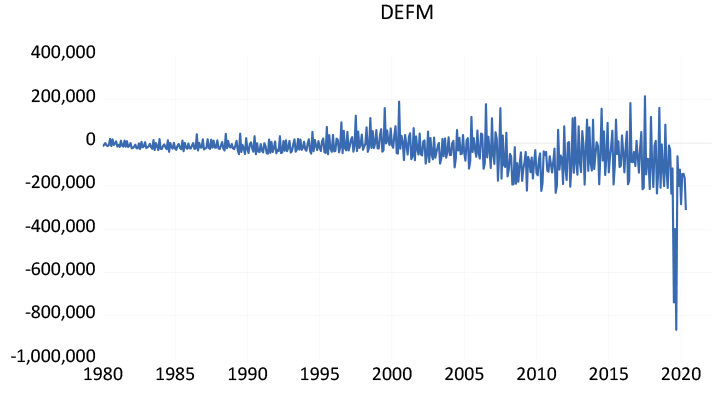
Source: Federal Reserve Bank of St Louis and Investec Wealth & Investment
Fed Chairman Jerome Powell is relaxed about inflation for now and he remains determined to help the US economy get back to full employment. He is waiting to see what will happen and he believes he has the tools to dial inflation back should it rise temporarily – as is widely expected.
So what are these tools? Mainly, it is the power to control short-term interest rates by adding or taking away dollars from the system. He does not however control how much the government spends, how much it taxes and how much it will have to borrow. The higher he sets short-term interest rates, of course, the less popular he will become. His political independence should not be taken as a permanent given.
Powell is confident that inflation is well anchored around the current 2% annual rate, the Fed target for inflation. Actual inflation however depends on expected inflation and on the difference between actual GDP and potential GDP – the output gap. Powell believes the Fed has this gap under control. But without active co-operation from fiscal policy to restrain government spending over the long run, this inflation anchor could easily slip away. As with the Fed, we will wait and watch.

11 March 2021
National Treasury’s tax epiphany
There is more to tax than what appears on the surface – ask National Treasury and South African homeowners.
Professor Brian Kantor / Chief economist and strategist, Investec Wealth & Investment
National Treasury has had an epiphany. It has acknowledged that higher taxes can lead to slower growth and that lower taxes can lead to faster growth. Hence the decision to forgo R40bn of planned income tax increases and to propose a reduction in the corporate tax rate to 27%. All in the interests of faster growth. Hallelujah.
The Budget Review recognises that taxes have complicated feedback effects. It recognises that the burden of higher corporate taxes ends up being passed on to consumers of goods and services, in the form of higher prices and lower incomes for those who provide labour and other services to the corporation. The supply of capital to the SA enterprise and hence the supply of goods, services and the demand for labour and land, is determined by the required after-tax returns of investors. Higher taxes will reduce expected returns and so the supply of capital, goods, services and the demand for labour. The supply of capital for SA is sourced globally and the required returns are determined in the global market, as the Review recognises.
The Review could have added that personal income tax rates have supply side effects. It is the after-tax benefits provided to taxpayers by governments that establish the standard of living, which in turn determines the willingness to supply labour to an economy. The more internationally mobile the providers of labour services are, the more of a global market South African firms have to compete in for the supply of indispensable skills. Raising income tax rates at the margin drives the emigration of human capital and leads to higher prices to cover higher after-tax costs of inputs. Lower taxes could help do the opposite, that is increase supply of capital and skills. Faster growth becomes possible with a lower tax burden.
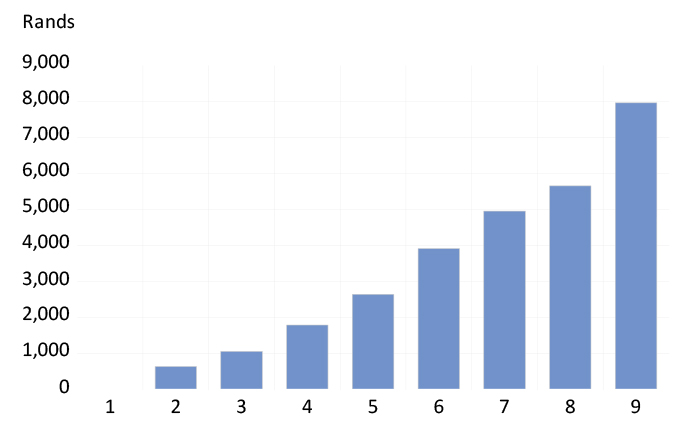
The share of income of those who will report taxable income of more than R1.5m in 2021-02 (a mere 113,192 taxpayers) are in the highest of nine tax brackets. They report 12% of all income and will pay over 26% of all personal income tax. Only when annual incomes are above R500,000 does the share of income taxes paid exceed the share of incomes earned. The numbers of high earners and taxpayers in SA have been stagnating. We need more of them to help grow the economy and provide for the relief of poverty.
It is the mix of taxes and the benefits supplied by governments that determines the standard of living and that drives the migration of labour and capital. The burden of income taxes in South Africa is highly progressive, as are the benefits of government spending. Higher income earners in South African pay much of the personal income tax and draw very little on government benefits provided.
Figure 1: Population by the nine income tax brackets (millions)
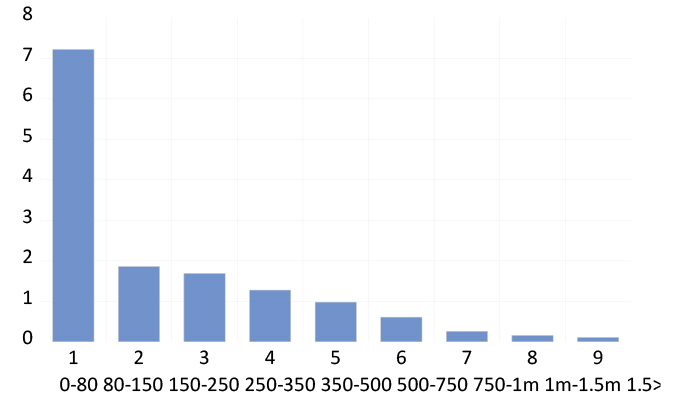
Source: Budget Review 2021-2020, Chapter 4 Table 4.5, Investec Wealth & Investment, 24/02/2021
Figure 2: Share of income and income tax paid of the nine income tax brackets (percent)
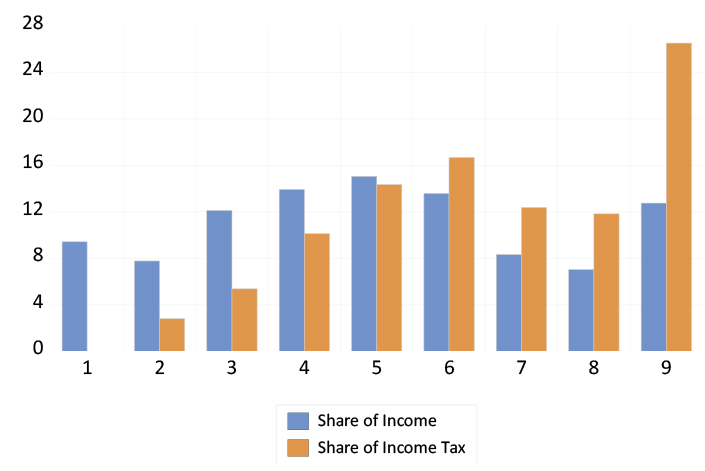
Source: Budget Review 2021-2020, Chapter 4 Table 4.5, Investec Wealth & Investment, 24/02/2021
Figure 3: Average income tax saved (rand per annum) per member of each tax bracket (total income tax saving = R51bn)
Source: Budget Review 2021-2020, Chapter 4 Table 4.5, Investec Wealth & Investment, 24/02/2021
For evidence of the relationship between taxes paid and benefits provided by government, one need only compare residential property prices in Cape Town with those in the other cities and towns. They can watch the business television channels, to be aware that magnificent homes in Johannesburg or Durban can be had for the price of a small two-bedroomed apartment in Cape Town. This is because of the more favourable mix of higher property taxes (not necessarily higher wealth tax rates) that are paid in return for comparatively good services provided by the local government.
Homeowners should be aware that higher taxes can more than pay for themselves when there is good government. And higher taxes will destroy their wealth when the service is inadequate for the taxes paid.

11 February 2021
What higher global inflation could mean for South Africa
Higher commodity prices could bring about higher global inflation. That would not necessarily be bad news for South Africa.
Professor Brian Kantor / Chief economist and strategist, Investec Wealth & Investment
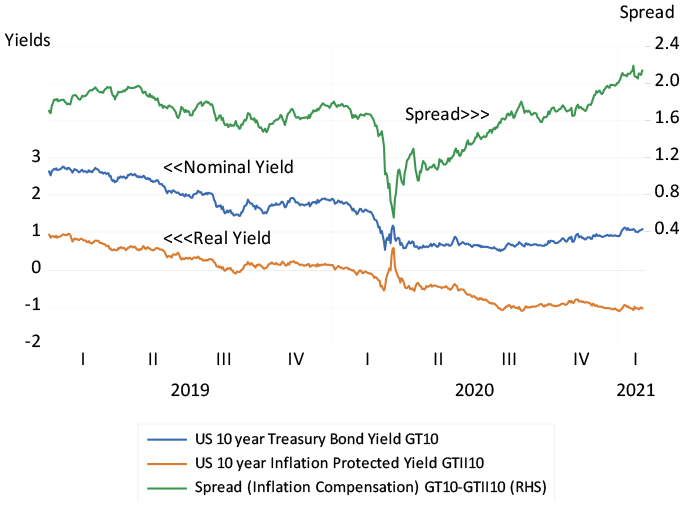
There is a hint of inflation in the frigid northern air. It’s being reflected in the long-end of the bond markets, the part of the yield curve that is vulnerable to signals of high inflation and the higher interest rates and lower bond values that follow. The compensation offered for bearing the risk that inflation may surprise on the upside is reflected in the spread between nominal and inflation-linked bond yields. These spreads have been widening in the US, and in low inflation countries like Germany and Japan.
This spread for 10-year bonds in the US was as little as 0.80% at the height of the Covid-19 crisis, was 1.63% at the end of September, and at the time of writing is at 2.14%. It has averaged 1.97% since 2010. The spread has widened because investors have forced the real yield lower, to -1.03%, further than they have pushed the nominal yield higher now, to 1.15%. This is still well below the post 2010 daily average of 2.25% (see figure below).
US 10-year nominal and inflation-protected bond yields
Source: Bloomberg and Investec Wealth & Investment, 11 February 2021
Investors are paying up to insure themselves against higher inflation by buying inflation linkers and forcing real yields ever more negative. Clearly, the nominal yields continue to be repressed by Fed Bond buying (currently at a $120 billion monthly rate). One might think it’s easier to fight the Fed with inflation linkers, than via higher long bond yields, to which the currently low mortgage rates and a buoyant housing market are linked.
The Fed is insistent that it is not even thinking yet of tapering its bond purchases. The Treasury, now led by Janet Yellen, previously in charge of the Fed, insists that a new stimulus package of US$1.9 trillion is still needed for a US recovery.
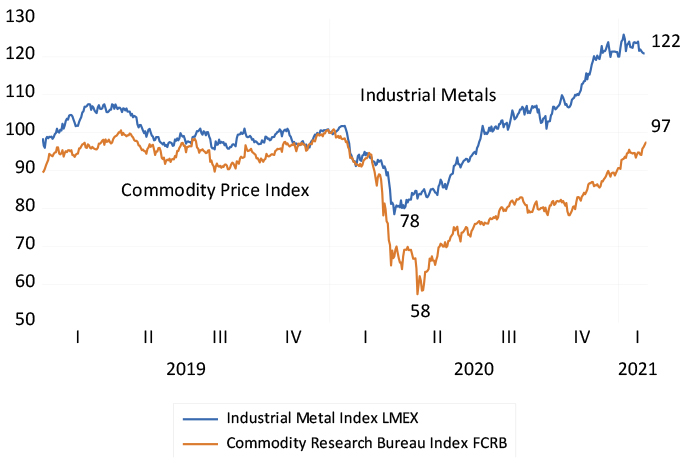
Metal and commodity prices, grains and oil are all rising sharply off depressed levels. Industrial metals are 45% up on the lows of last year, while a broader commodity price index that includes oil is up 51% off its lows of 2020.
Industrial metals and commodity prices (January 2020=100)
Source: Bloomberg and Investec Wealth & Investment, 11 February 2021
These higher input prices will not automatically lead to higher prices at the factory gate or at the supermarket. Manufacturers and retailers might prefer to pass on higher input costs. But they know better than to ignore the state of demand for their goods and services. They can only charge what their markets will bear, which will depend on demand that in turn will reflect policy settings.
Higher inflation rates cannot be sustained without consistent support from the demand side of the economy. Yet supply side-driven price shocks that depress spending on other goods and services can become inflationary, if accommodated by consistently easier monetary and fiscal policy. In the 1970s, it was not the oil price shocks that were inflationary. They were a severe tax on consumers and producers in the oil importing economies, which in turn depressed demand for all other goods and services. It was the easy monetary policy designed to counter these depressing effects that led to continuous increases in most prices. That was until Fed chief Paul Volker decided otherwise and was able to shut down demand with high interest rates and a contraction in money supply growth that reversed the inflation trends for some 40 years.
The financial markets will be alert to the prospects that demand for goods and services will prove excessive and inflationary in the years to come – and that they may not be dialed back quickly enough to hold back inflation.
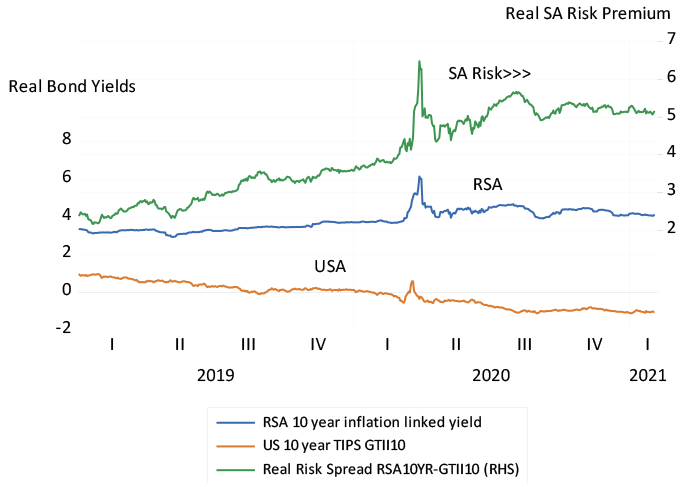
There is consolation for South Africa should global inflation accelerate. It will be accompanied by higher metal prices and perhaps bring a stronger rand to dampen our own inflation. It may also help reduce the large South Africa risk premium that so weakens the incentive to undertake capital expenditure as well as the value of South African business. Our inflation-linked 10-year bonds now yield a real 4.13%, a near record 5.15 percentage points more than US inflation linkers of the same duration. Any reduction in South African risk would thus be welcome.
The real South African risk premium
Source: Bloomberg and Investec Wealth & Investment, 11 February 2021

25 January 2021
Vaccines and vacuity – the true costs of not securing vaccine supplies
The failure to secure a large supply of vaccines to help South Africa to reach herd immunity quickly, reveals a vacuity in thinking about the cost to the economy.
Professor Brian Kantor / Chief economist and strategist, Investec Wealth & Investment
The fiasco over the supply of vaccines reveals fully the vacuity of South Africa’s approach to Covid-19. The deposit of R283m to secure a supply of vaccines was not budgeted for because we didn’t have the money for it – even though money for much else was found in the adjusted Budget.
In this context, I observe that the Treasury deposits at the Reserve Bank amounted to R160bn in October, boosted by loans from the IMF and other agencies with anti-pandemic action front of their minds. Has anyone in the Treasury or government attempted to calculate how much additional income will be lost for want of the vaccine – and how much tax revenue the Treasury will not be able to collect?
It will be many times more than the R20bn to be spent on the vaccine. Bear in mind too, that R7bn of this is to be funded by members of medical schemes, which in effect makes it a tax increase or expropriation by any other name, unhelpful given the state of the economy.
Yet a supply of additional money could have been made available by the Reserve Bank, in the same way that money is being created on a large scale by central banks all over the world to fund the extra spending that the lockdowns have made imperative. And the Bank could still do so, to help the Treasury fund the vaccine and the money cost of rolling it out. The idea of raising taxes to fund the extra spending when the economy is under such pressure makes little sense. A higher tax rate or taxing specific incomes will slow the economy even further and might lead to lower tax revenues of all kinds.
Moreover, there is little prospect of more inflation to come. Should inflation emerge at some point, a reversion to normal funding arrangements would be called for. The danger then is that central banks like our Reserve Bank might not act soon enough and inflation picks up. But it is a danger that pales into insignificance when compared with the present danger posed by the pandemic.
Governments around the world know enough economics to know that spending more to help employ workers (and machines) who would otherwise be idle was a costless exercise – costless in the true opportunity cost sense. But South Africa seemingly cannot bring itself to think through the problem this way. The upshot is that South Africa lacks the essential self-confidence to do what would be right now.
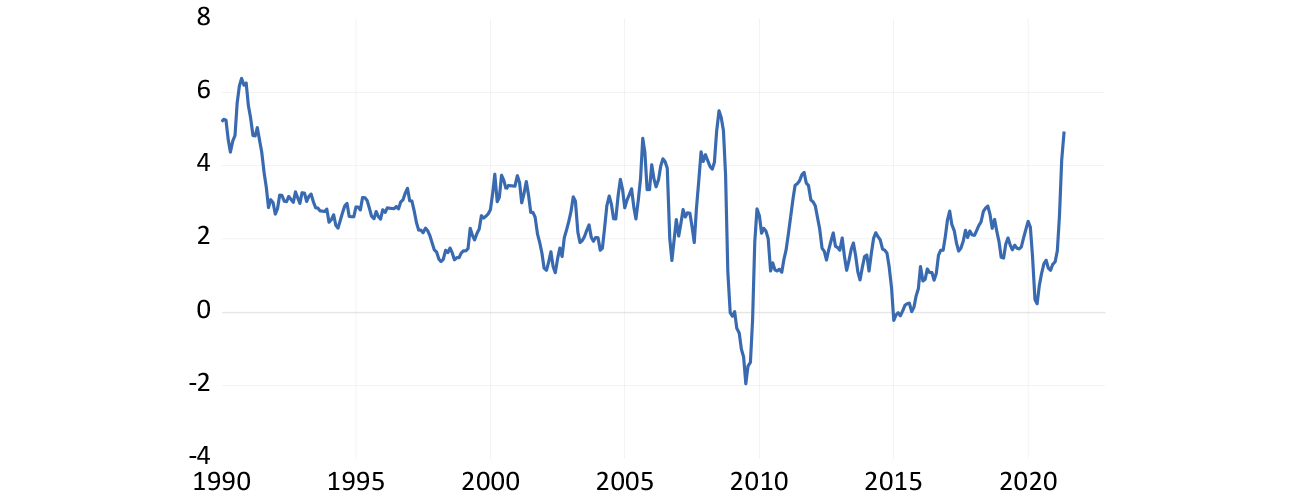
The monetary and financial market statistics tell us how unready the economy is to sustain any recovery of output and employment. The supply of extra Reserve Bank money in the form of notes and deposits by banks with the Reserve Bank, what is described as the money base or M0, rose by 8% in 2020. There was a flurry of extra such money in March and July 2020, since reversed. In the US, the money base is up by 43% (See figure 1).
Figure 1: Annual growth in central bank money, SA and US
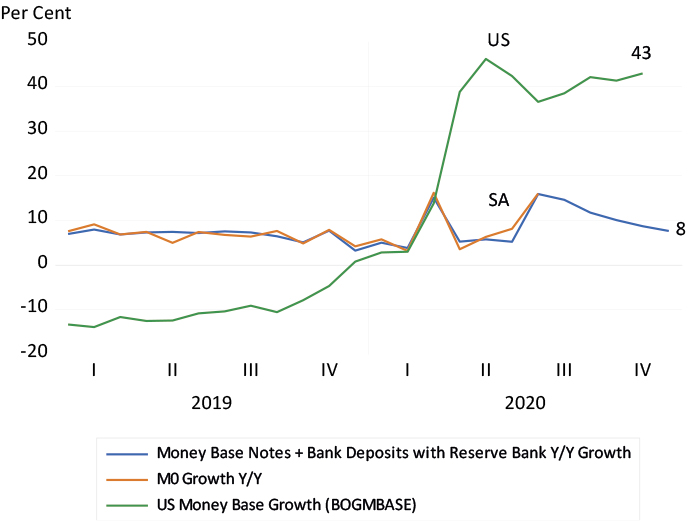
Source: SA Reserve Bank, Federal Reserve Bank of St. Louis and Investec Wealth & Investment
The SA banking system is hunkering down, not gearing up. Bank deposits have been growing at about an 8% rate, while lending to the private sector is up a mere 3%. The banks are building balance sheet strength, raising deposits and are cautious about lending more. They are relying less on repurchase agreements made with the Reserve Bank and other lenders, reserving more against potential bad debts while not paying dividends and hence adding to their reserves of equity capital. All of these act to depress growth.
Figure 2: SA bank deposits and lending (R million)
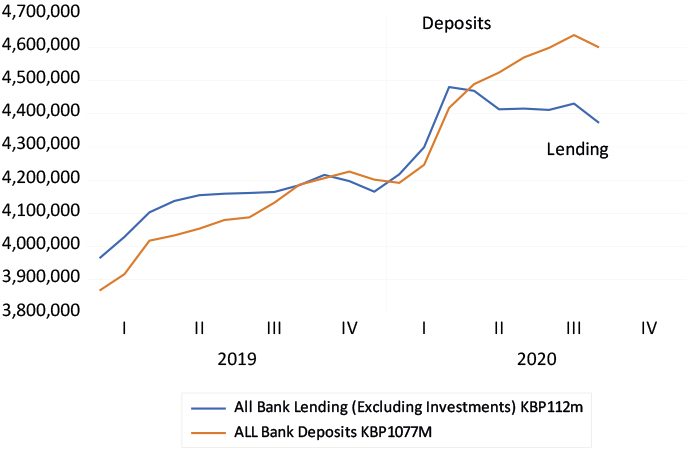
Source: SA Reserve Bank and Investec Wealth & Investment
Figure 3: SA banks – adding to equity capital
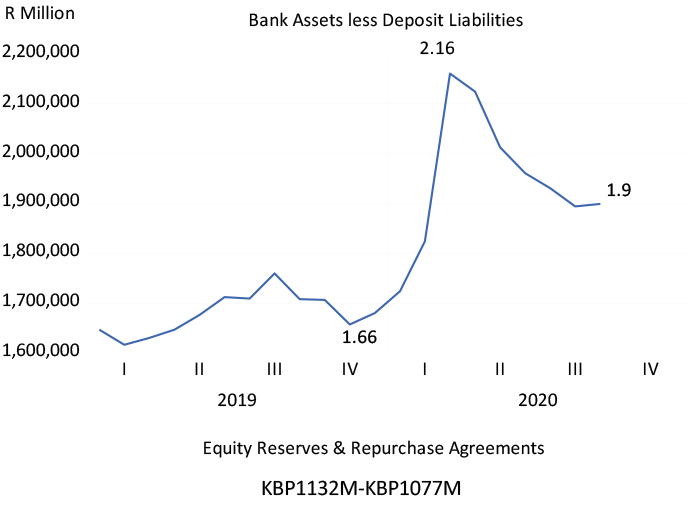
Source: SA Reserve Bank and Investec Wealth & Investment
The financial metrics continue to paint a grim picture of the prospects for the SA economy. Long-term interest rates remain above 9%, even as inflation is expected to average 5% over the next 10 years. This makes capital expensive for potential investors who are therefore less likely to add to their plant and equipment. The difference between borrowing long and short remains wide, implying sharp increases in short-term interest rates to come and expensive funding for the government (that is taxpayers) at the long end. The risk of South Africa defaulting on its US dollar debt demands that we pay an extra 2.3% more a year than the US government for dollars over five years.
Figure 4: Key financial metrics in 2020-21
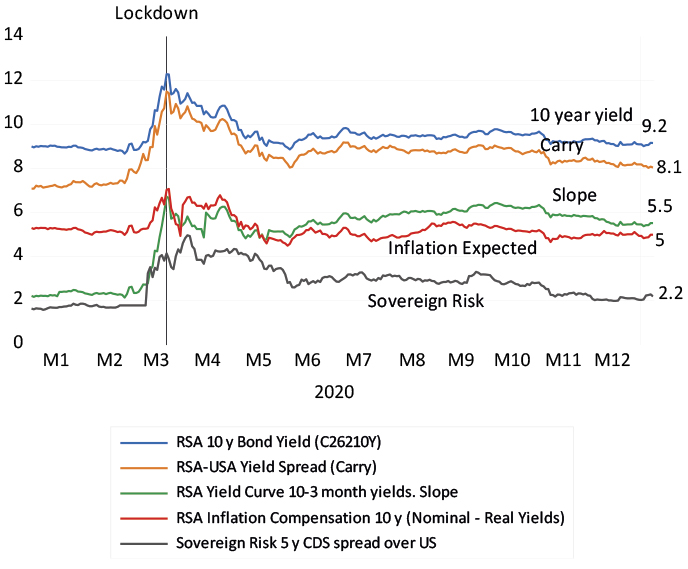
Source: Bloomberg and Invested Wealth & Investment
Poorly judged parsimony and monetary conservatism have brought SA great harm in the fight against Covid-19. They have made the prospects for a recovery in GDP and government revenue appear bleak. It is not too late to change course. We should be funding the extra unavoidable spending on the vaccine and its roll out by drawing on the cash reserves of the government or by raising an overdraft form the Reserve Bank.

17 November 2020
The vaccine and the SA economy – a shot in the arm
The good news on the vaccine front has also been good news for SA markets. To take full advantage, we can help ourselves by making the right policy choices.
Professor Brian Kantor / Chief economist and strategist, Investec Wealth & Investment
The prospect of an effective vaccine for Covid-19 is good news for investors in SA. The rand has recovered all of the ground it had lost to other emerging market currencies through much of 2020 and is now only about 10% weaker against the US dollar this year. In March, when the uncertainty surrounding Covid-19 was most pronounced, the rand had lost 30% of its US dollar value of January 2020 (see below). The rand has gained about 4% on both the emerging market basket and the US dollar this month.
The rand vs emerging market basket, vs the US dollar and the ratio of the rand to emerging market currencies (higher values indicate dollar strength)
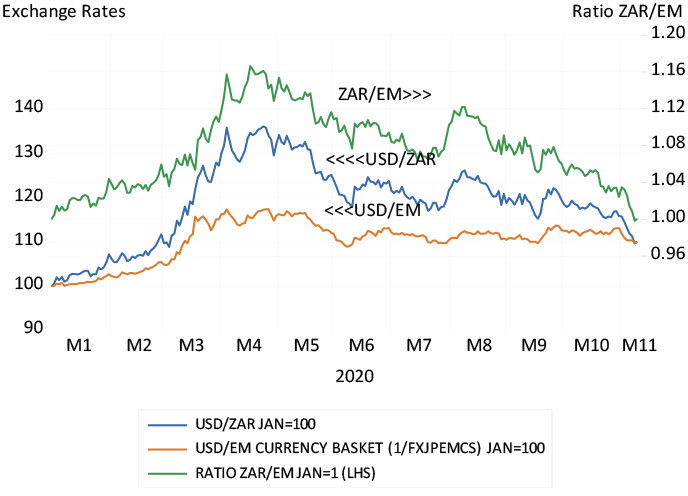
Source: Bloomberg and Investec Wealth & Investment
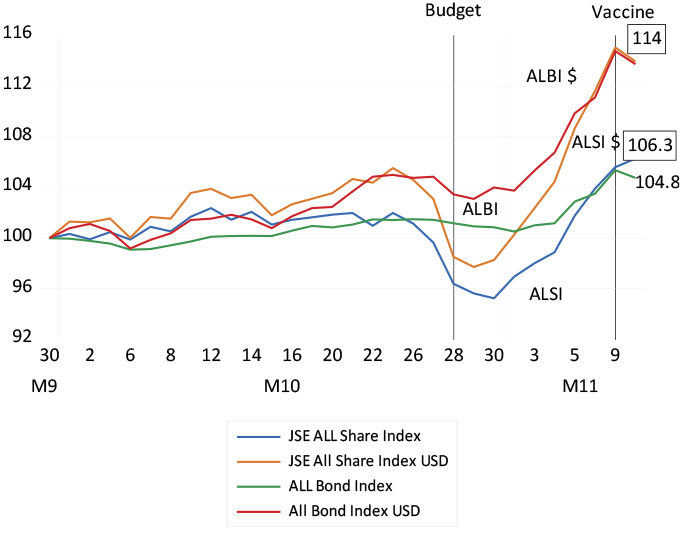
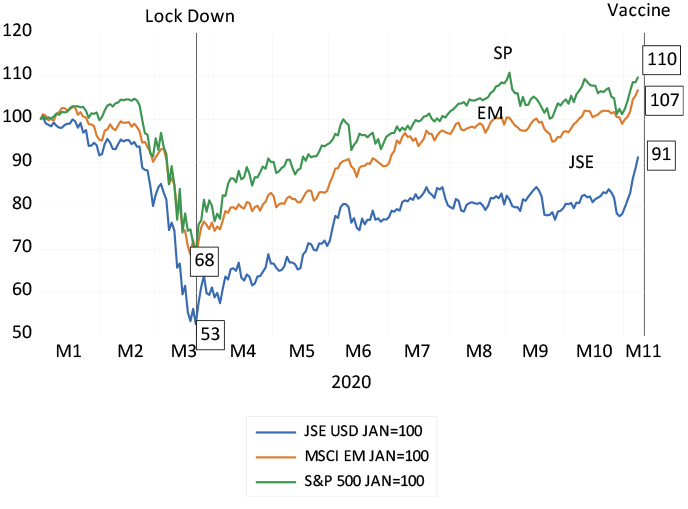
The JSE equity and bond markets consistently also responded well to the good global news, led by the companies that are dependent on the SA economy. The JSE All Share Index since October has gained 14% in USD and the JSE All Bond Index has appreciated by a similar 14% in US dollars. The emerging market index was up by 9.1% over the same period, while the US benchmark the S&P 500 gained 5.4%. The JSE has been a distinct outperformer recently (see below).
The JSE equity and bond indexes
Source: Bloomberg and Investec Wealth & Investment
The JSE, S&P 500 and MSCI EM Indexes (In US dollars)
Source: Bloomberg and Investec Wealth & Investment
These developments should not have come as a complete surprise. Favourable reactions in the SA financial markets to a reduction in global uncertainties, usually accompanied by a weaker US dollar, are predictable. What South Africans lose in the currency and financial markets when the world economy appears less certain, we regain when risk tolerance improves. SA unfortunately is amongst the riskiest of destinations for capital among investors, who always demand higher returns as compensation for the risks they estimate. As taxpayers, we pay out more interest and our companies have to offer higher prospective returns than almost anywhere else where capital flows freely, as it does to and from Johannesburg.
Recent developments in the markets do provide some relief for our beleaguered economy. The yield on long-dated government bonds has declined by more than a half a percent this month. With an unchanged outlook for profits, such a reduction in the discount rate applied to expected income could add 10% to the present value of a SA business or roughly 10% its price-to-earnings ratio (market reactions confirm this). A further reduction in these high required returns – now equivalent to about 9% a year after expected inflation – is much needed to encourage SA businesses to invest more. It’s essential if our economy is to grow faster.
Yet if the economy were expected to grow sustainably faster, the discount rate would come down much further and businesses would be willing to invest more in SA. Foreign investors would willingly supply us with their savings to do so. The SA government would therefore be confidently expected to raise enough revenue to avoid the danger of a debt trap and a much weaker rand – expectations that are fully reflected in our high bond yields.
We can hope for the stars to align, but should not expect them to do so. We can help ourselves by making the right policy choices. Opportunity presents itself in a number of ways. The terms at which we engage in foreign trade have improved consistently in recent years, by 20% since 2015 (think metal prices over oil prices). These relative price trends are even more favourable than they were in the 1970s when the gold price took off. These developments should spur output and investment by business, government policy permitting.
Another, related large opportunity is presented by the discovery of a major energy resource off our southern coast. Bringing the gas ashore can accelerate infrastructure and export led growth, funded by foreign capital, not domestic taxpayers, and led by business not government. It demands the kind of urgency that has brought us a vaccine.
SA’s terms of foreign trade – export prices/import prices (2010=100)
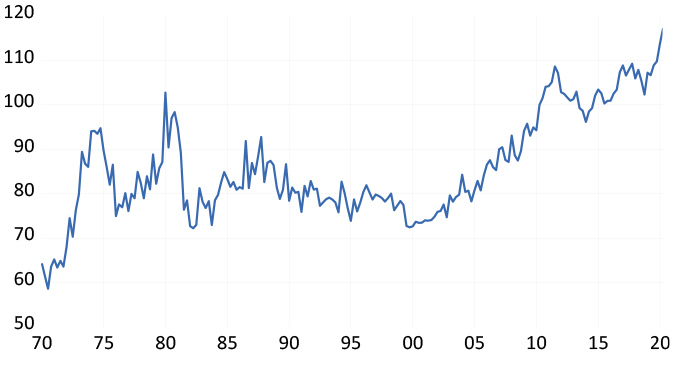
Source: SA Reserve Bank Investec Wealth & Investment

22 September 2020
PSG and Capitec – Shareholders’ (un)bundle of joy
By unbundling Capitec, PSG has done the right thing for shareholders – but shareholders remain sceptical about its prospects.
Professor Brian Kantor / Chief economist and strategist, Investec Wealth & Investment
PSG shareholders should be pleased. The decision to unbundle PSG’s stake in Capitec has delivered approximately R7.85bn extra to them. This estimated value add for PSG shareholders is calculated by eliminating the discount previously applied to the value of the Capitec shares held indirectly by PSG.
Without the unbundling, the discount applied to the assets of PSG would have been maintained to reduce the value of their Capitec shares. The market value of the 28.1% of all Capitec shares unbundled to PSG shareholders, worth R960 a Capitec share, would have been worth R31.4bn on 16 September. These Capitec shares might have been worth 25% less, or nearly R8bn, to PSG shareholders, had it been kept on the books.
The PSG holding in Capitec had accounted for a very important 70% of the net asset value (NAV) or the sum of parts of PSG. Before the unbundling cautionary was issued in April 2020, the difference between the NAV and market value of PSG, the discount to NAV, had risen to well over 30%. The difference in NAV and market value of PSG was then approximately R20bn in absolute terms. The discount to NAV then narrowed to about 18% when the decision to proceed with the unbundling was confirmed.
Now with the unbundling complete, PSG again trades at a much wider discount of 40% or so to its much-reduced NAV.
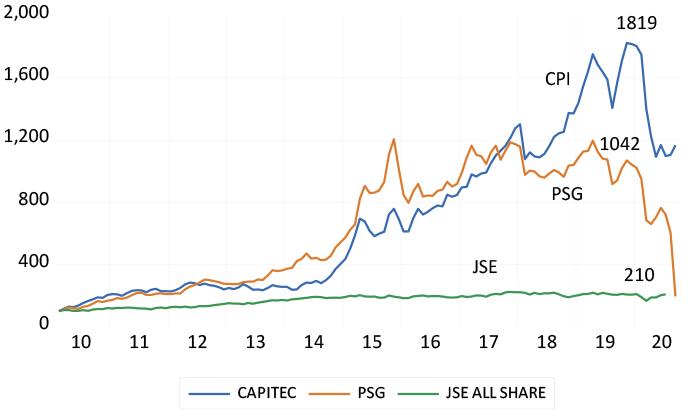
Capitec and PSG delivered well above market returns after 2010. By the end of 2019, the Capitec share price was up over 18 times compared to its 2010 value. By comparison, the PSG share price was then 10 times its 2010 value, and the JSE 2.1 times. The Capitec share price strongly outpaced that of PSG only after 2017.
The Capitec and PSG share prices, compared to the JSE All Share Index (2010 = 100)
Source: Iress and Investec Wealth & Investment
The better the established assets of a holding company perform, as in the case of a Capitec held by PSG or a Tencent held by Naspers, the more valuable will be the holding company. Its NAV and market value will rise together but the gap between them may remain wide. Investors will do more than count the value of the listed and unlisted assets reported by the holding company. They will estimate the future cost of running the head office, including the cost of share options and other benefits provided to managers of the holding company. They will deduct any negative estimate of the present value of head office from its market value. They may attach a lower value to unlisted assets than that reported by the company and included in its NAV.
Investors will also attempt to value the potential pipeline of investments the holding company is expected to undertake. These investments may well be expected to earn less than their cost of capital, in other words, deliver lower returns than shareholders could expect from the wider market. These investments would therefore be expected to diminish the value of the company rather than add to it. They are thus expected to be worth less than the cash allocated to them.
To illustrate this point, assume a company is expected to invest R100 of its cash in a new venture (it may even borrow the cash to be invested or sell shares in its holdings to do so). But the prospects for the investments or acquisitions are not regarded as promising at all. Assume further that the investment programme is expected to realise a rate of return only half of that expected from the market place for similarly risky companies. In that case, an investment that costs R100 can only be worth half as much to its shareholders. Hence half of the cash allocated to the investment programme or R50 would have to be deducted from its current market value.
All that value that is expected to be lost in holding company activity will then be offset by a lower share price and market value for the holding company – low enough to provide competitive returns with the market. This leads to a market value for the company that is less than its NAV. This value loss, the difference between what the holding company is worth to its shareholders and what it would be worth if the company would be unwound, calls for action from the holding company of the sort taken by PSG. It calls for more disciplined allocations of shareholder capital and a much less ambitious investment programme. The company should rather shrink, through share buy backs and dividends, and unbundling its listed assets, rather than attempt to grow. It calls for unbundling and a lean head office and incentives for managers linked directly to adding value for shareholders by narrowing the absolute difference between NAV and market value. Management incentives, for that matter, should not be related to the performance of the shares in successful companies owned by the holding company, to which little or no management contribution is made.
On that score, a final point directed towards Naspers and its management: the gap between your NAV and market value runs into not billions, but trillions of rands. This gap represents an extremely negative judgment by investors. It reflects the likelihood of value-destroying capital allocations that are expected to continue on a gargantuan scale. It also reflects the cost of what is expected to remain an indulgent and expensive head office.

03 September 2020
The case for funding with equity, not debt
Two recent cases of JSE-listed companies reveal the advantages of equity funding over debt funding.
Professor Brian Kantor / Chief economist and strategist, Investec Wealth & Investment
While issuing debt can be more dangerous than issuing equity, it receives more encouragement from shareholders and the regulators. Debt has more upside potential: if a borrower can return more than the costs of funding the debt (return on equity improves) and there is less to be shared with fellow shareholders.
But this upside comes with the extra risk that shareholders will bear should the transactions funded with debt turn out poorly. Any increase in the risk of default will reduce the value of the equity in the firm – perhaps significantly so.
The accounting model of the firm regards equity finance as incurring no charge against earnings. You might think it would help the argument for raising permanent equity capital rather than temporary debt capital. But this is clearly not the case, with the rules and regulations and laws that govern the capital structure of companies. It is also represented in the attitude of shareholders to the issuing of additional equity. They have come to grant ever less discretion to company boards to issue equity. Less so with risky debt.
(Note: I am grateful to Paul Theodosiou for the following explanation of the different treatment of debt and equity capital raising. Paul was until recently non-executive chairman of JSE-listed REIT, Self Storage (SSS), and previously MD of the now de-listed Accucap of which I was the non-executive chairman).
Typically at the AGM, a company will seek two approvals in respect of shares - a general approval to issue shares for cash (which these days is very limited - 5% of shares in issue is the norm) and an approval to place unissued shares under the control of directors (to be utilised for specific transactions that will require shareholder approval). These need 75% approval. So shareholders keep a fairly tight rein on the issue of shares.
Taking on or issuing debt, on the other hand, leaves management with far more discretion. Debt instruments can be listed on the JSE without shareholder approval, and bank debt can be taken on at management’s discretion. The checks and balances are more broad and general when it comes to debt. Firstly, the memorandum of incorporation will normally have a limit of some kind (for REITs, the loan to value ratio limits the amount of debt relative to the value of the assets). If the company is nominally within its self-imposed limits, shareholders have no say. Secondly, the JSE rules provide for transactions to be categorised, and above a certain size relative to market cap, shareholders must be given the right to approve by way of a circular issued and a meeting called. The circular will spell out how much debt and equity will be used to finance the transaction, and here the shareholders will have discretion to vote for or against the deal. If they don’t approve of the company taking on debt, they can vote at this stage. Thirdly, shareholders can reward or punish management for the way they manage the company’s capital structure - but this is a weak control that involves engaging with management in the first instance to try and persuade, and disinvesting if there isn’t a satisfactory response.)
It is better practice however to separate the investment and financing decisions to be made by a firm.
Perhaps the implicit value of the debt shield – taxes saved by expensing interest payments – without regard to the increase in default risk, confuses the issues for investors and regulators. It is better practice however to separate the investment and financing decisions to be made by a firm. The first step is to establish that an investment can be expected to beat its cost of capital, whatever the source of capital, including internally generated cash that could be given back to shareholders for want of profitable opportunities. When this condition is satisfied, the best (risk adjusted) method of funding the investment can be given attention.
The apparent aversion to issuing equity capital to fund potentially profitable investments seems therefore illogical. Or maybe it represents risk-loving rather than risk-averse behaviour. Debt provides potentially more upside for established shareholders and especially managers, who may benefit most from incentives linked to the upside.
Raising additional equity capital from external sources to supplement internal sources of equity capital is what the true growth companies are able to do. And true growth companies do not pay cash dividends, they reinvest them, earning economic value added (EVA) for their shareholders. A smaller share of a larger cake is clearly worth more to all shareholders.
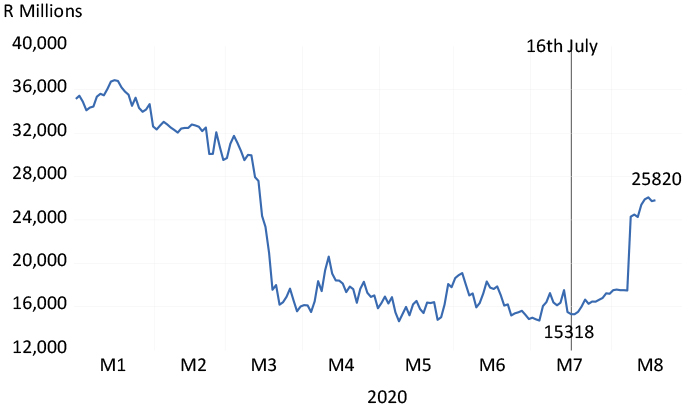
There are two recent JSE cases worthy of notice. Foschini shareholders approved the subscription of an extra R3.95bn of capital on 16 July to add about 20% to the number of shares in issue. By 19 August, the company was worth R25.8bn, or R10.5bn more than its market value on 16 July, or R6.5bn more than the extra capital raised. The higher share price therefore has already more than compensated for the additional shares in issue.
The Foschini Group – market value to 19 August 2020
Source: Bloomberg, Investec Wealth & Investment
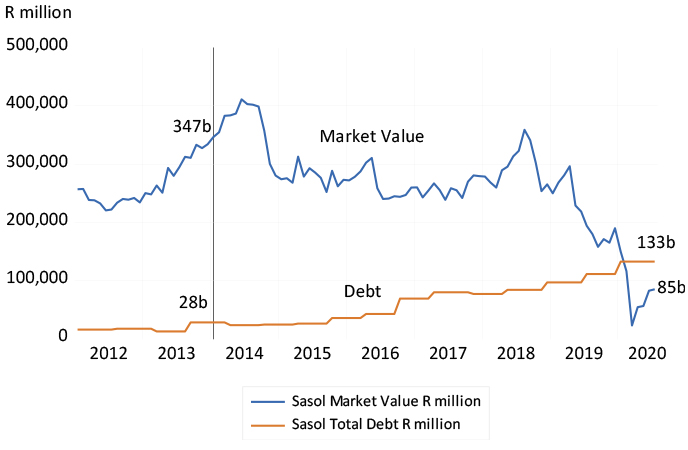
The other example is Sasol, now with a market value of about R87bn, heavily depressed by about R110bn of outstanding debt. The extra debt was mostly incurred funding the Lake Charles refinery that ran far over its planned cost and called for extra debt. Sasol was worth over R400bn in early 2014, with debts then of a mere R28bn. The recent market value, now less than the value of its debts, is clearly being supported by the prospect of asset sales and a potential capital raise.
The company would surely be much stronger had the original investment in Lake Charles been covered more fully by additional equity capital, capital they might have been able to raise with much less dilution. It might also have prevented the new management team from having to sell off what might yet prove to be valuable family silver – assets capable of earning a return above their cost of capital. In this case, a large rights issue could still be justified to bring down the debt to a manageable level and, as with the Foschini increase, the value of its shares by more (proportionately) than the number of extra shares issued.
Sasol – market value and total debt, 2012 to July 2020
Source: Bloomberg, Investec Wealth & Investment

19 August 2020
How to build the confidence needed to borrow and lend
An economic recovery programme for South Africa demands the kind of business and political leadership that now appears to be lacking.
Professor Brian Kantor / Chief economist and strategist, Investec Wealth & Investment
These are truly unprecedented economic times. Never before have large sectors of our own and most other economies been told to stop working. Large numbers of potential participants in the economy are being forced to stay at home. The impact on the supply of goods and services, the demand for them and the incomes normally earned producing and distributing them, has been devastating. Perhaps up to 20% of potential output, or GDP in a normal year, will have been sacrificed globally to the cause. We will know how much has been sacrificed only when we look back and are able to do the calculations.
In South Africa’s case this one fifth of GDP would amount to about R1 trillion of income permanently lost. These are extraordinary declines in output and income. Ordinary recessions, when GDP declines by 2% or 3% in a quarter or a year, are much less severe than this.
Compensation however can be paid to the households and business owners who, through no fault of their own, have lost income and wealth. It is being provided on different scales of generosity across the globe. The richer countries are noticeably more generous than their poorer cousins. South Africa, alas, is among the more parsimonious, at least to date in practice.
There is however no way to recover what has been lost in production. All that can be hoped for is a speedy recovery of the economy when businesses and their employees are allowed to get back to normal. But getting back to producing as much as before the lockdowns means not only more output and jobs becoming available. Any recovery in output will have to be accompanied by more demand for the goods and services that the surviving business enterprises can supply. Without additional spending during the recovery process, there will not be additional supplies of goods, services, jobs and incomes.
In the US, every household received a cheque in the post of over $1000 and temporary unemployment benefits of $600 per week were more than many would have earned. The average US household will come out of the crisis with more cash than they had before.
Providing unemployment benefits and other benefits paid in cash to the victims of the lockdowns will help to stimulate spending. In the US, every household received a cheque in the post of over $1000 and temporary unemployment benefits of $600 per week were more than many would have earned. The average US household will come out of the crisis with more cash than they had before. And more may be on the way. Spending the cash will help the pace of recovery.
The US and many other countries will be doing what it takes to get back to normal. They will also be learning along the way just how much spending by governments it will take before they can take their feet off the accelerators. They are not being constrained by the monetary cost of such spending programmes. The cheapest way for a government to fund spending is by printing money and redeeming the money issued with more money.
The central banks of developed economies are supplying large extra amounts of cash to their economies in a process of money creation also known as quantitative easing or bond purchasing programmes. The supply of central bank cash in the largest economies has grown 30% this year. Central banks have been buying financial securities, mostly issued by their governments in exchange for their cash that is so willingly accepted in exchange. By so doing, they have helped force down the interest rates their governments pay lenders to very low levels – sometimes even below zero for all government debt, short and long dated. This is an outcome that has made issuing government debt even for 10 years or more even cheaper than issuing money.
These governments have also arranged on an even larger scale (relative to GDP) loan guarantee schemes for their banks to encourage bank lending that will enable businesses that have bled cash during the lockdowns to recapitalise, on favourable terms. Central banks, secured by funds committed by their governments, are covering up to 95% of any losses the banks might suffer if the loans are not repaid. The take-up of such loans by businesses in the US has been very brisk.
South Africa, as mentioned, has not adopted any do-what-it-takes approach to our crisis of perhaps larger relative dimensions. I have argued that we should practise the same logic as the developed economies and rely in the same way on our central bank to create money to hold down the interest cost of funding higher government spending and the accompanying debt. This would be a similarly temporary exercise in economic relief – one well-explained and understood as such – for only as long as it takes.
Leadership should want large and small businesses to believe in their prospects after the lockdown and to act accordingly.
South Africa has moreover introduced a potentially significant loan guarantee scheme for our banks, with a potential value of up to R200bn. Sadly, little use of the credit lines has so far been made: only R14bn appears as taken up. Every effort should be made to encourage businesses to demand more credit and for the banks to lend more, since they are exposed potentially to only 6% of the loans they make. Working capital, which is necessary to restart SA businesses, is therefore available. The confidence to re-tool seems to be lacking, as is the determination of the banks to find customers willing to invest in the future, from which they will benefit permanently, should they succeed.
The recovery programme demands a business and political leadership that now appears to be lacking. Leadership should want large and small businesses to believe in their prospects after the lockdown and to act accordingly. Economic recovery – getting back to normal as quickly as possible – demands no less.

11 August 2020
War and peace – Making sense of the biggest spending splurge in peacetime
Only the arrival of inflation is likely to put an end to the biggest round of government spending seen in in times of peace.
Professor Brian Kantor / Chief economist and strategist, Investec Wealth & Investment
The extent of the surge in government spending and borrowing and money creation currently under way, especially in the richer nations, has no precedent in peacetime. Perhaps that’s because we are not really at peace. We are at war with a virus and, as in most wars, this is accompanied by warlike amounts of impenetrable fog, multiple chaotic situations and much wealth destruction.
Yet there is no sign of any taxpayer revolt to the spending propensities of governments. The current spat between Republicans and Democrats over additional spending is by no means asymptomatic. As I write these words, Congress and the President have already approved extra spending of US$3.2 trillion. The Democrats have now proposed an extra US$3.4 trillion of relief divided up their way. The Republican offer is of an extra US$1.1 trillion spent very differently. For a US$20 trillion economy, either set of spending proposals is formidable.
The global outlook for government debt is truly astonishing. The US fiscal deficit is predicted to approach 25% of GDP shortly, much larger than it has ever been, but for World War 2. In the UK, the debt/GDP ratio was below 60% in 2015 and forecast by the Office for Responsible Budget to fall marginally by 2050. The latest forecast is for a debt/GDP ratio, currently at 100%, to double by 2030. Managing government debt with the aid of central banks and their power to create money, usually the cheapest non-interest bearing form of government debt, is characteristic of all funding arrangements in and after wartime. But if this is war, then it is one without more inflation, either now or expected in the future. 90% of all developed market debt now yields less than 1% a year, of which 10% offers negative returns. It is therefore an inexpensive war for taxpayers to fund.
Further purchases of securities, mostly issued by their governments, combined with support for extra private bank lending, can be expected to take the balance sheets for four of the largest economies (US, Japan, the European Union and the UK) to about US$27 trillion by 2021, the equivalent of 67% of GDP.
The recent growth in the size of developed market central banks is equally and consistently awesome. Or is it awful? It could not have happened without them. And there is every prospect of further growth in their assets to come. The balance sheets of four of the largest economies (US, Japan, the European Union and the UK) have increased by the equivalent of US$5.7 trillion (16% of GDP) since February, in other words, by about 30% in five months. Further purchases of securities, mostly issued by their governments, combined with support for extra private bank lending, can be expected to take their balance sheets to about US$27 trillion by 2021, the equivalent of 67% of GDP.
They have similarly increased their liabilities, in the form of extra deposits held by private sector banks at the central bank. These and other central banks have been exchanging their cash for government and other debt on a scale that has made them completely dominant in the market for government debt. They dominate over all maturities that are the benchmarks for all other yields, including earnings and dividend yields in the share market.
The US Fed will soon own 25% of US debt. The number was 10% in 2009. The Bank of Japan has grown its share of government debt from 5% in 2012 to over 40%. The European Central Bank held no European government debt in 2015. It now holds 25% of such debt. The Bank of England now holds 27% of UK government debt. Thus it would be incorrect to describe the low rates of interest on debt as market determined. The flat slope of the yield curve is under central bank control and they are likely to want to keep it that way, because there is no inflation or higher interest rates in sight. Economic revival is their priority.
When will the splurge of (always popular) spending end, while it can still be financed so cheaply? Only when and if inflation rears its ugly head again. And politicians and central banks may then do what their electorates have demanded in the past from post-war regimes: bring inflation down by raising interest rates and reducing money and credit growth (especially by governments) to better balance supply and demand in the economy. Inflation therefore will have to rise, surprisingly and sustainably so, before interest rates do, as the Fed has clearly indicated this week. Asset price inflation in such circumstances should not come as a surprise.

16 July 2020
Why it makes sense for government to borrow at the short end
Growing government debt can be better funded short rather than long, and by rolling over short-term debt for as long as possible, provided the level of long-term rates remains where it is.
Professor Brian Kantor / Chief economist and strategist, Investec Wealth & Investment
The SA bond market reacted sharply to the spread of Covid-19 and the likely prospect of a damaging economic lockdown. Long-term interest rates had been pushed higher earlier in 2020 in response to SA’s deteriorating fiscal trends, even before the lockdown. Long rates then reversed as the crisis in financial markets passed by, with the aid of central banks in the developed world. However, the gap between long and short yields in SA had already widened sharply and has remained wide since, despite the bond market recovery, as the Reserve Bank cut its repo rate.
Figure 1: SA long and short rates 2015 to 2020
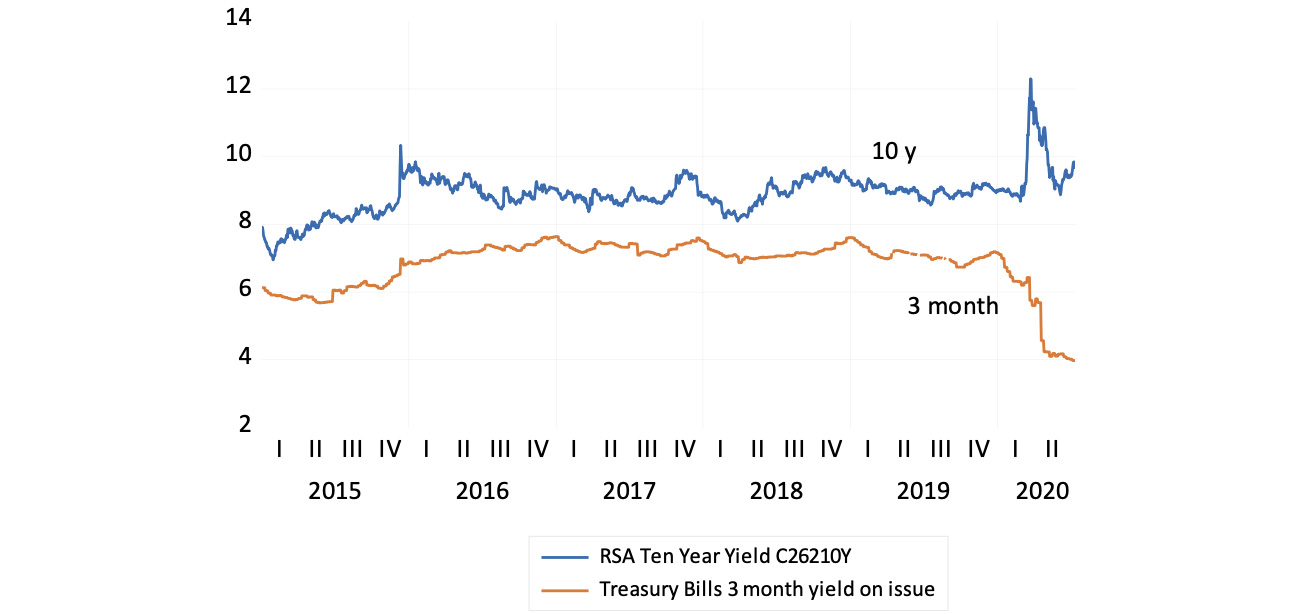
Source: Bloomberg, Iress, Investec Wealth & Investment
Government 10-year bond yields were at 9.67% on 10 July, while the yield on a three-month Treasury Bill was 3.96%, a positive spread of 5.67%. This means that the slope of the yield curve is far steeper than at any time over the past 15 years. Another way of putting this is that the SA taxpayer has to pay an extra 5.67% to borrow long rather than short.
Figure 2: The slope of the yield curve; 10-year minus three-month yields
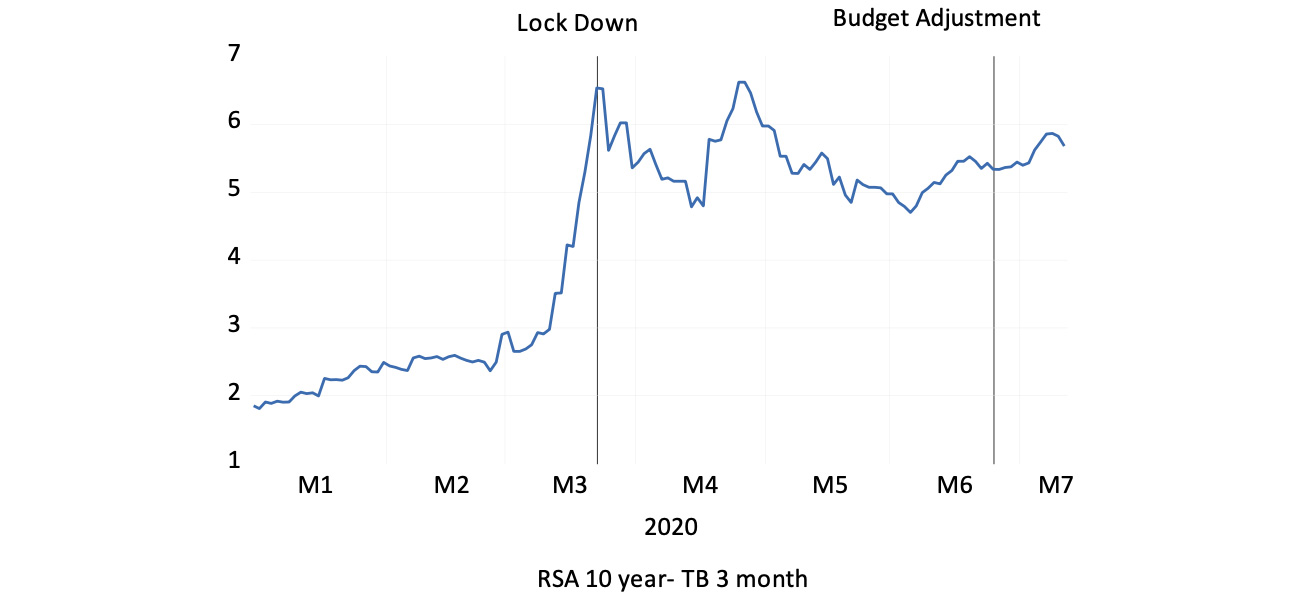
Source: Bloomberg, Iress, Investec Wealth & Investment
On the face of it, this is an expensive exercise for the government to borrow for a longer term rather than to roll over short-term debt. Given the strains on tax revenues, the rapidly widening fiscal deficit and the government borrowing requirement, is it a choice the Treasury is likely to exercise? Or is it going to finance a much greater proportion of its growing debt at the cheaper short end of the term structure of interest rates? We think the answer will be (and should be) the latter.
The expectations theory of interest rates
The answer above is less obvious than it first appears. The expectations theory of interest rates posits that the long-term rate is the average of the expected short-term rates over the period of any loan. Hence, in principle there would be no good reason to prefer long over short-term lending or borrowing. Borrowing long or short and having to roll over shorter term debts should turn out about the same for borrowers or lenders with choices.
However, if interest rates at the short end were to rise faster than expected, borrowing long (and lending short) would turn out to be the better option.
The chances of fast or slow increases in short rates over the relevant period must be about the same, if the market behaves consistently with the consensus of expectations. Choosing to borrow short or long or lending long or short, given the freedom to choose, then represents speculation, the belief that the borrower or lender can beat the market.
This notion of equilibrium in the capital market surely makes sense. Lenders and borrowers with the option to lend or borrow for shorter or longer periods would presumably expect to pay out the same or earn the same, one way or the other. If you could lend or borrow for three months at a time or for six months at an agreed rate today, the expected interest over two consecutive three-month periods must presumably be the same as the interest rate fixed for six months. If the current three-month rate is below the six-month rate, then it follows that the three-month rate in three months’ time will rise to make the expected returns on the interest paid or received.
If this were not the case, there would be every incentive to borrow or lend for longer or shorter periods. It is the attempts to minimise or maximise interest paid or received that eliminates any such obvious market beating opportunities.
Thus, according to the theory, if the three-month rate is below the six-month rate, then the three- month rate should rise above the current fixed six-month rate in order to average out at the higher rate. A positively sloped yield curve (long rates above short) implies that short rates should rise above the current longer-term rate over the duration of the contract. Similarly, if the 10-year government bond yield is above the five-year yield, the five-year bond yields will be expected to rise over the 10-year period to provide the same expected, compounding, average return.
Positive slopes
The SA government bond yield curve has had a consistently positive slope since 2005, with the exception of the boom period of 2006-2008 when short rates rose sharply, when the rapid growth in the economy was expected to slow down and bring lower short rates with it. This is what transpired with the Global Financial Crisis and the recession in SA that followed. In the figure below, we show how the slope of the yield curve was at its most positive in 2020. It would therefore have been helpful to borrow short rather than long.
Figure 3: Long and short-term interest rates and the slope of the yield curve
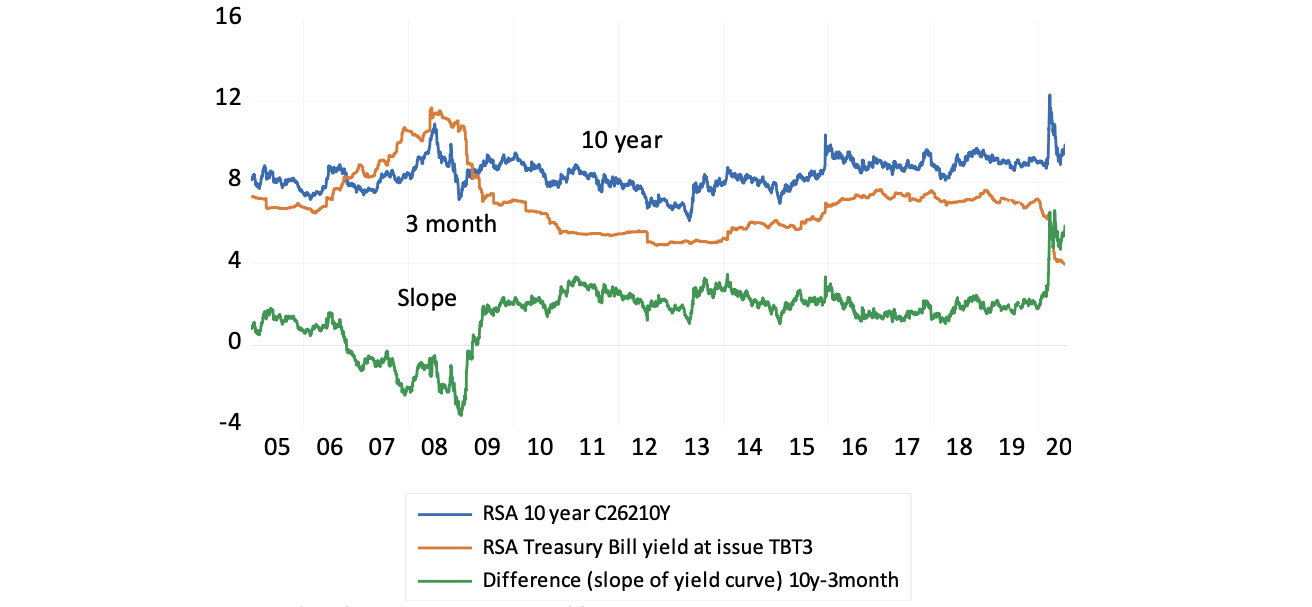
Source: Bloomberg, Iress, Investec Wealth & Investment
The SA government would be well advised to borrow short rather than long and avoid what has become a very steep yield curve as short rates have come down and long rates have remained elevated. In other words, it should monetise more of its own debt in the short run, until we can we get our fiscal deficit reduced. A reduced supply of long dated SA government bonds – assuming inflationary expectations remain the same – would mean lower long bond yields.
A mixture of lower short and long rates is called for to help the SA economy recover from Covid-19. Fiscal deficits that can be funded without money creation on an inflationary scale is the long-term path out of the debt trap. This is a path that will lead to permanently lower long-term interest rates and risk spreads and lower costs of capital for SA business.
Figure 4: 12-month forward rates implicit in the current slope of the yield curve
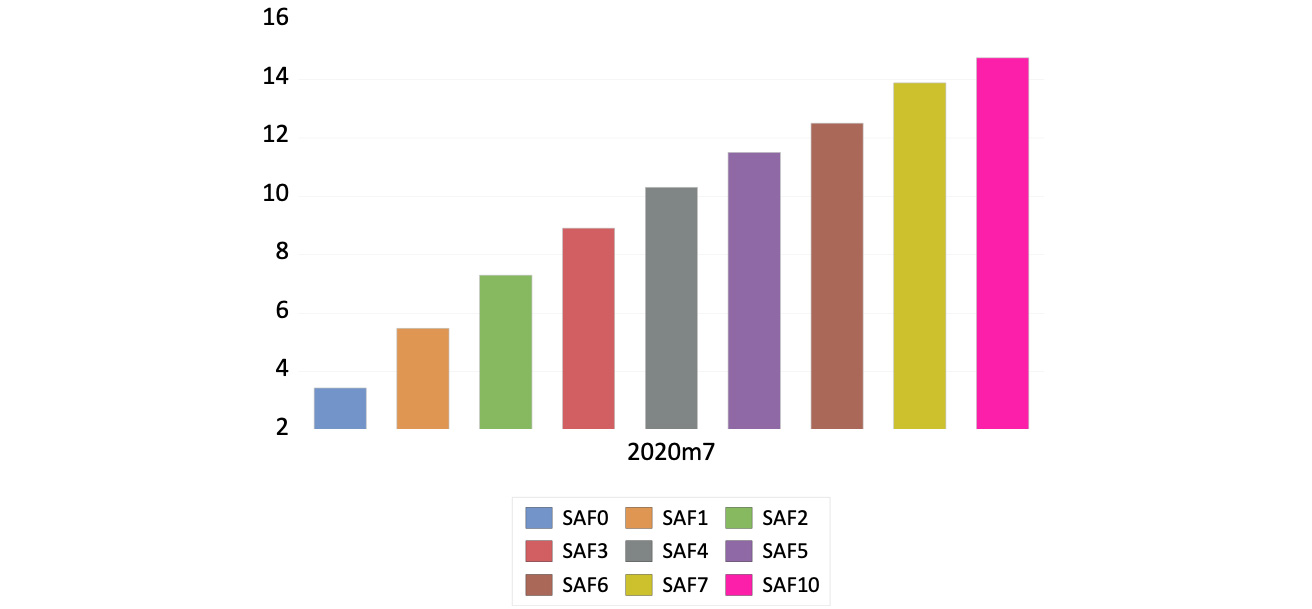
Source: Thompson-Reuters, Investec Wealth & Investment
It is difficult to reconcile such expectations with the likely reactions of the Reserve Bank over the next few years. The outlook for GDP growth is poor and the expectations for inflation over the next few years subdued. The compensation for taking on inflation risk in the SA bond market is currently only an extra 3.9% over five years (the extra yield available from a nominal five-year bond over its inflation-protected alternative).
Figure 5: Nominal and real five-year bond yields and their spread
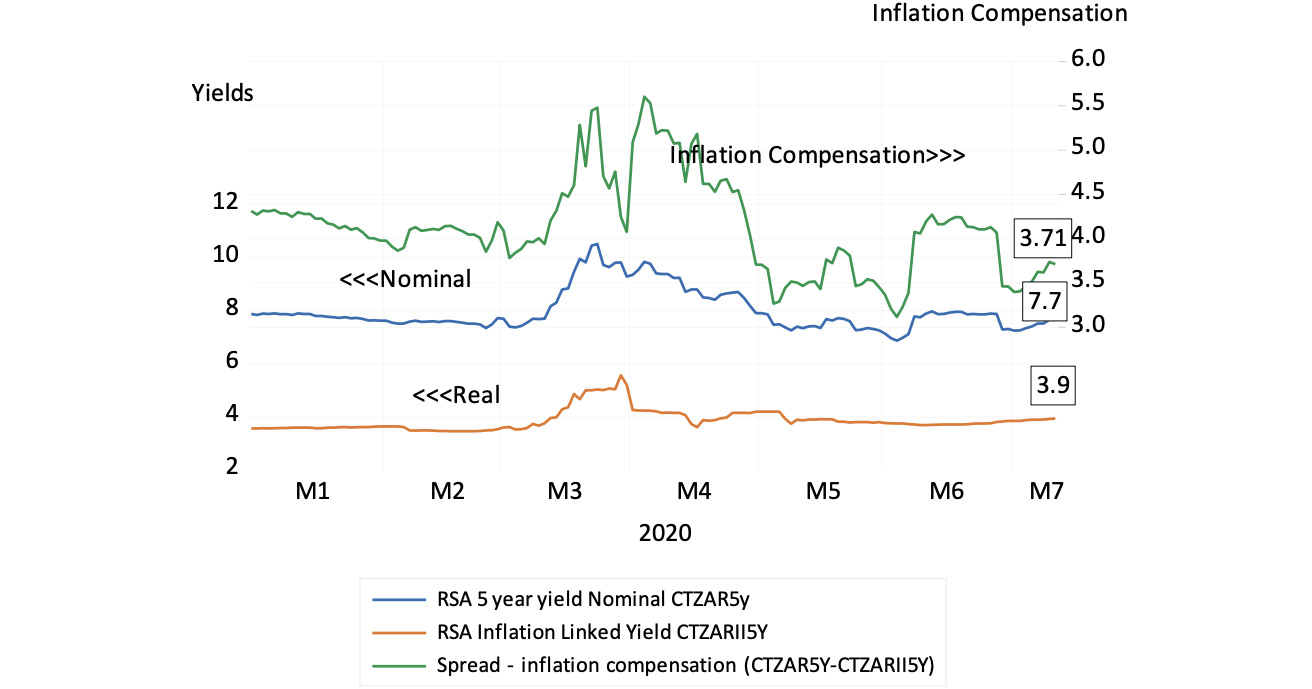
Source: Bloomberg, Investec Wealth & Investment
If we subtract the estimate of average inflation expected over the next five years from the one-year interest rate expected in five years’ time, we get an after-inflation expected return of about 6%. This measure of expected inflation is now close to actual inflation, as are the inflation expectations surveyed, reported and forecast by the Reserve Bank. They will all have declined further since the beginning of the year given the global downward pressures on inflation and the likely reluctance of SA households and firms to spend more over the next few years.
It is difficult to imagine the SA economy will be strong enough, or the Reserve Bank aggressive enough, over the next few years, to tolerate real interest rates of the order implied by the current yield curve and the spread between nominal and real yields now available in the bond market. Many borrowers, especially the SA government, are likely to take the risk that short-term interest rates will not rise as rapidly as implied by the current slope of the yield curve. After all, short-term rates are directly controlled by the Reserve Bank itself.
Growing government debt can be better funded short rather than long, and by rolling over short-term debt for as long as possible, provided the level of long-term rates remains where it is. Drawing further on the government deposits at the Reserve Bank is a further low interest cost option. The Reserve Bank can also provide the banks with enough extra cash, on favourable enough terms, to enable them to support the growing market in short-term debt. Any reduced supply of longer-term paper will help take pressure off longer-term yields.
To elect to borrow long in the current circumstances seems the expensive option. The current state of the bond market is arguably an aberration in a world of global bond markets that have been monetised to an extraordinary degree. In the longer run, the task for government is to prove it can manage its debt in a sensible way. This means convincing potential lenders that it can bring government spending in line with its ability to raise tax revenues. This will help to bring down the long-term cost of raising debt.
What is called for from the government and Reserve Bank is to manage the unavoidably larger national debt and short-term interest rates in a sensible way. If we call it good debt management rather than money creation then let’s describe it that way.

08 July 2020
Making sense of the rand and local bond markets before and after the June Budget
SA government bond yields have come back from the Covid-19 crisis peaks of late March. But they have not reacted favourably to the June Budget adjustments and fiscal deficit. We examine why.
Professor Brian Kantor / Chief economist and strategist, Investec Wealth & Investment
The rand has recovered from its peak weakness of March 2020 when it was off 35% against the US dollar and 17% against the emerging market basket. At the start of July, it was only 8% weaker year-to-date against other emerging market currencies and 20% down vs the US dollar. Relative rand strength in recent months is not easily explained – though with the current account having turned positive in Q1 the lesser dependence on foreign capital may well add to rand strength.
The rand against the US dollar and emerging market currencies (1 January 2020 = 100)
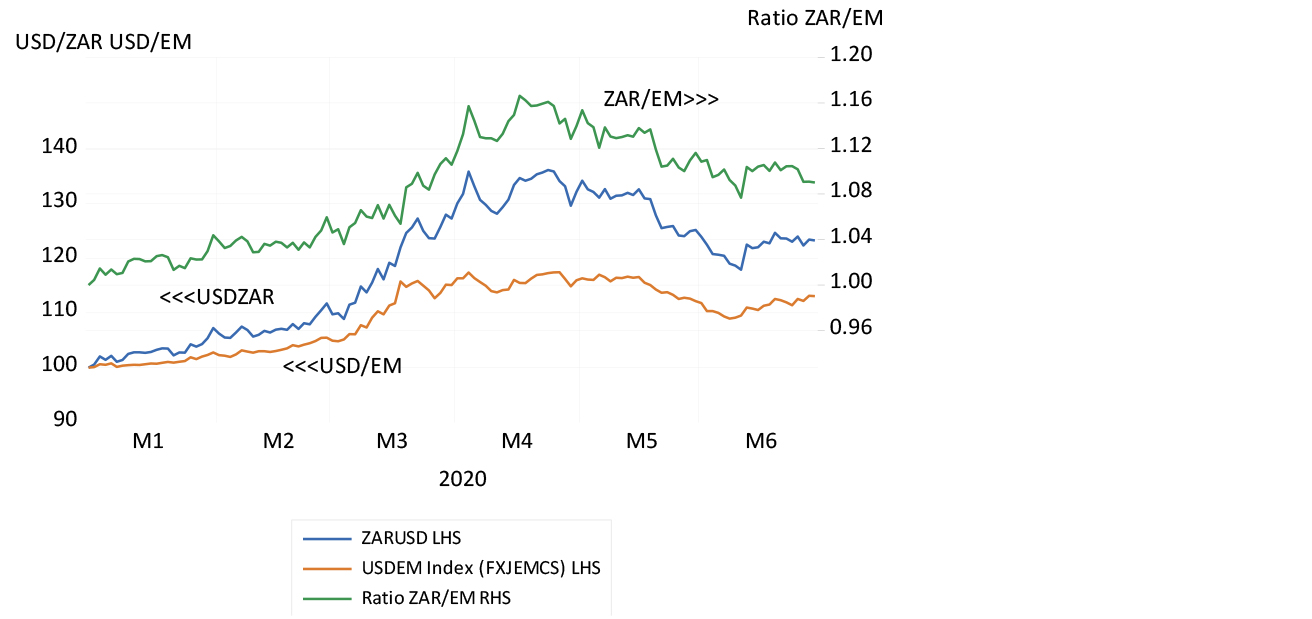
Source: Bloomberg, Investec Wealth & Investment
Sovereign risk spreads, measured as the spread between rates the SA government is charged when borrowing US dollars, compared with Treasury yields, peaked on 23 March. They have since receded but rose marginally after the Budget adjustments of 24 June.
Sovereign risk spread: SA dollar bond minus US five-year Treasuries vs the five-year CDS spread
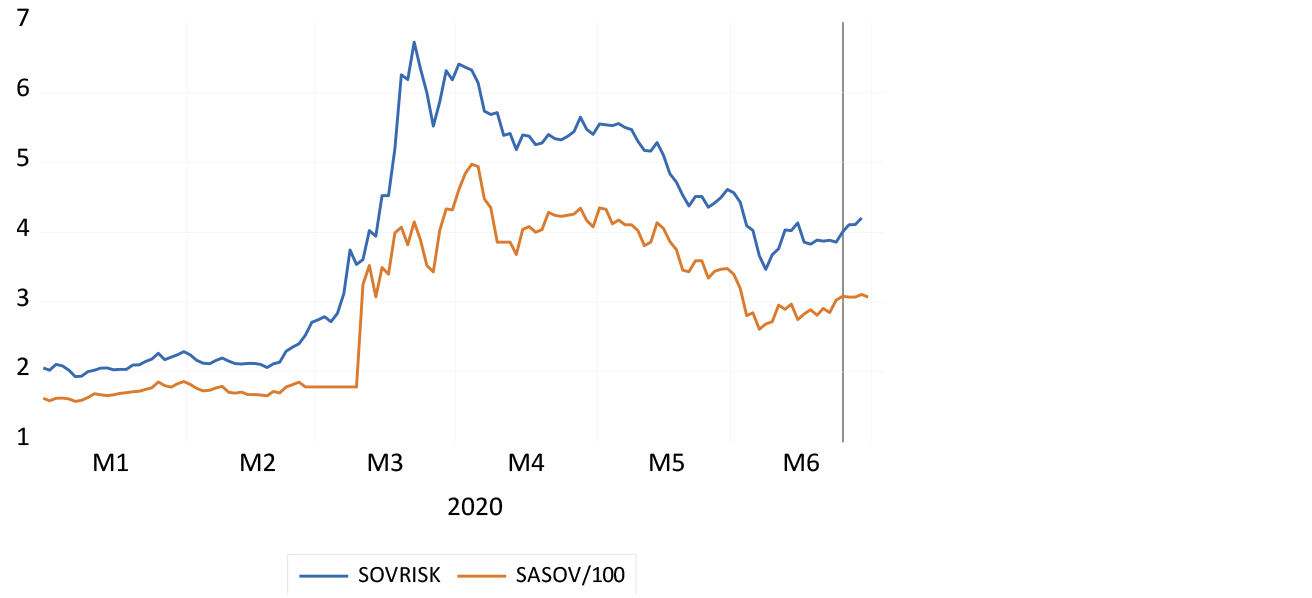
Source: Bloomberg, Investec Wealth & Investment
SA government rand-denominated bond yields have receded from the Covid-19 crisis peaks of late March 2020. But they have not reacted favourably to the Budget adjustments and fiscal deficit of over 14% of GDP. The reactions to the Budget adjustments may be described as modest in the circumstances of a rapidly expanding fiscal deficit (almost entirely because of a collapse in tax revenues).
The wider carry indicates that the market is pricing in 9% depreciation a year against the US dollar over the next 10 years. As we show further below, this carry (the cost of hedging the US dollar in the forward market) has widened relative to inflation compensation in the SA government bond market. This has receded recently, as real bond yields have risen relative to nominal bond yields. These remain inhibiting, both for the government funding larger deficits and business, having to hurdle high costs of capital.
We show that the carry, the cost of buying dollars for forward delivery, so implying rand weakness and presumably more inflation, has widened relative to inflation expectations in the bond market (measured as the difference between nominal bond yields and the yields on the inflation protected equivalent bonds issued by the SA government). Perhaps this difference implies deflation rather than any inflation expectation in global trade – as reflected by very low, even negative, developed market bond yields. Therefore a weaker (expected) rand does not mean as high an inflation rate as might previously have been portended by expected rand weakness.
As we also show, SA government bond yields remain significantly higher than those offered by the weakest 25% of local currency borrowers around the world. Is this spread wide enough to attract foreign capital?
The 10- and five-year carry, and inflation compensation in the bond market
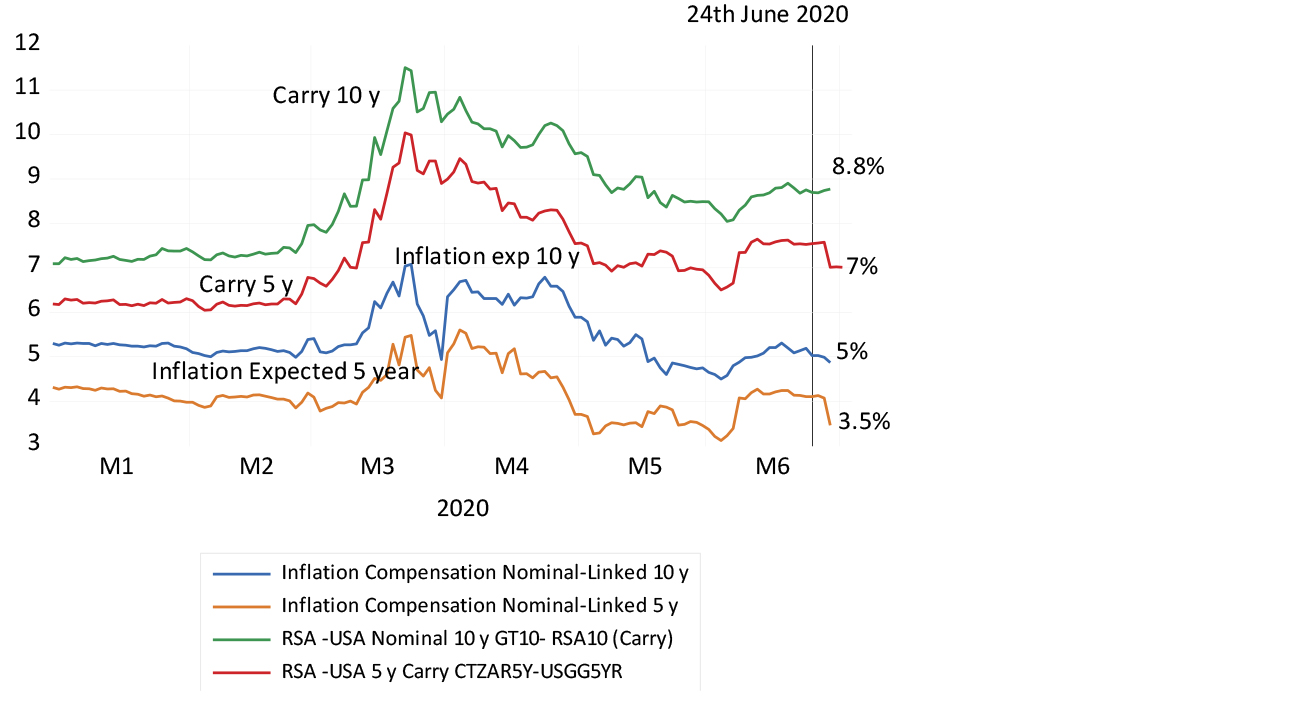
Source: Bloomberg, Investec Wealth & Investment
The carry and inflation compensation over the last five years
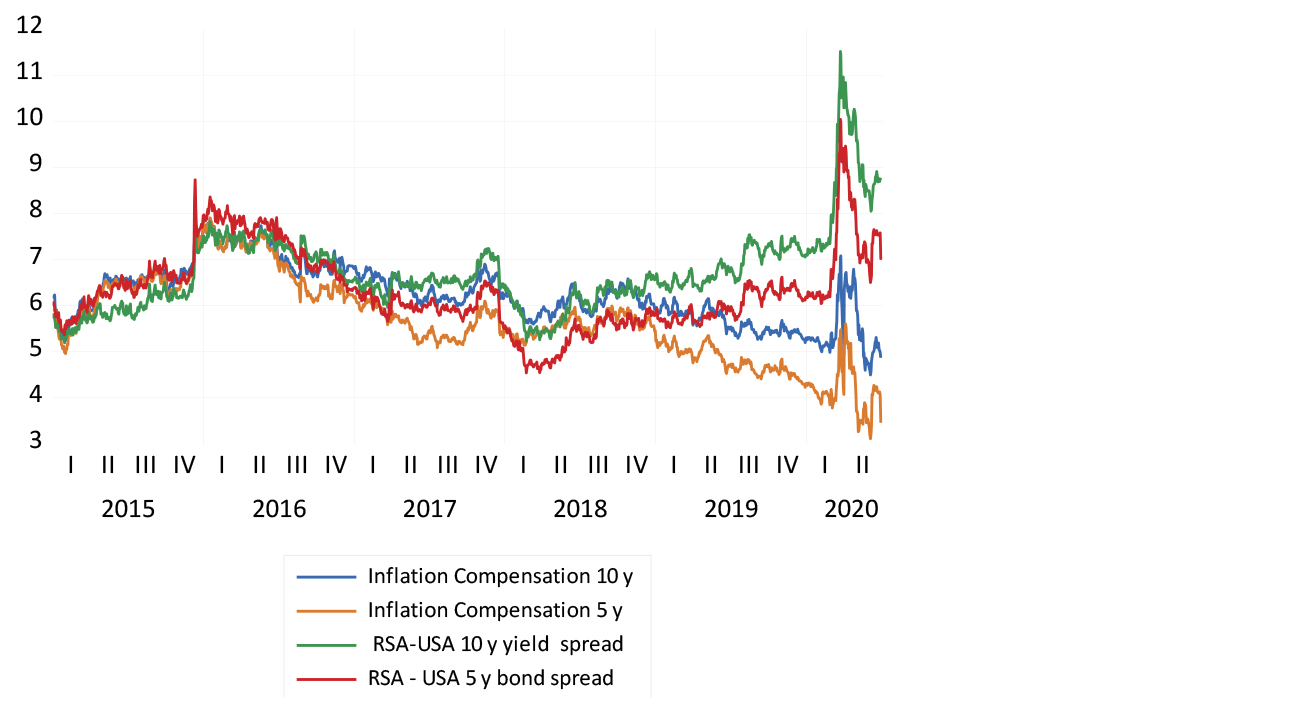
Source: Bloomberg, Investec Wealth & Investment
South Africa vs other sovereign borrowers
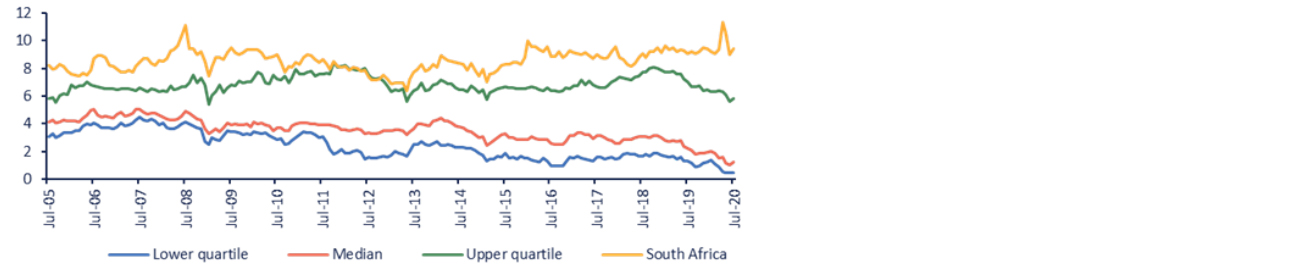
Source: Refinitv, Investec Wealth & Investment
Nominal and real 10-year yields on SA government bonds
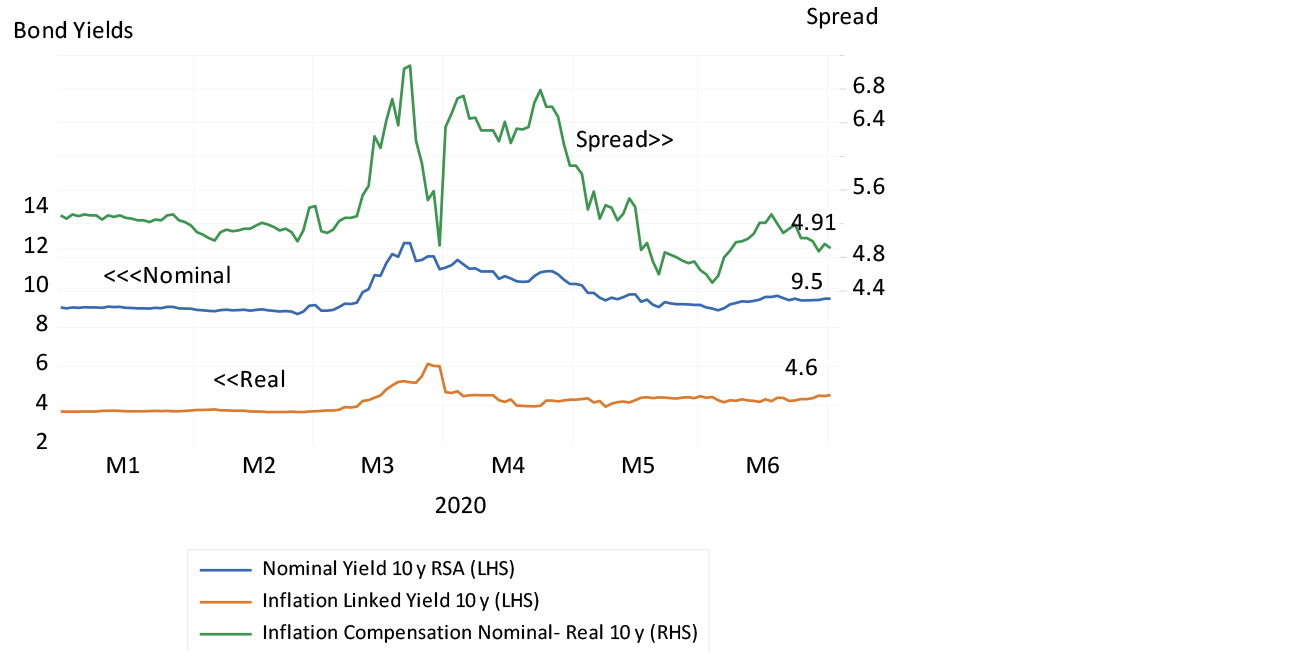
Source: Bloomberg, Investec Wealth & Investment
The SA government would be well advised to borrow short rather than long and avoid what has become a very steep yield curve as short rates have come down and long rates have remained elevated. In other words, it should monetise more of its own debt in the short run, until we can we get our fiscal deficit reduced. A reduced supply of long dated SA government bonds – assuming inflationary expectations remain the same – would mean lower long bond yields.
A mixture of lower short and long rates is called for to help the SA economy recover from Covid-19. Fiscal deficits that can be funded without money creation on an inflationary scale is the long-term path out of the debt trap. This is a path that will lead to permanently lower long-term interest rates and risk spreads and lower costs of capital for SA business.
SA government 10-year yields minus three-month cash yields (three-month JIBAR)
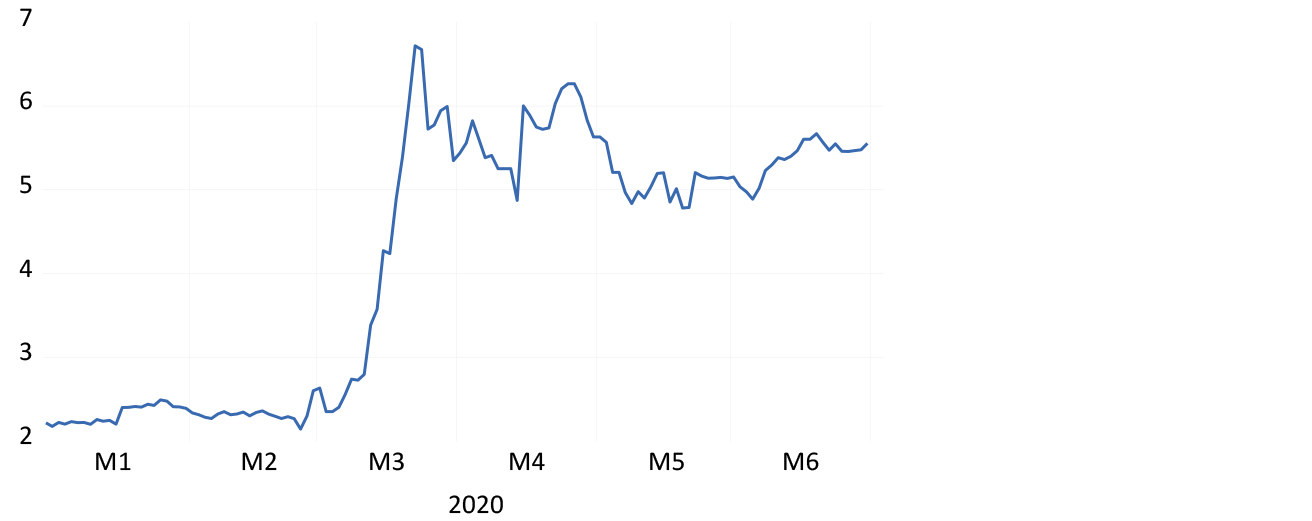
Source: Bloomberg, Investec Wealth & Investment

01 July 2020
The fundamentals of capital raising in a Covid-19 world
Governments and central banks have set a number of records in their actions to mitigate Covid-19. This has made it possible for companies to raise capital on favourable terms. JSE-listed firms have also joined the party.
Professor Brian Kantor / Chief economist and strategist, Investec Wealth & Investment
The past quarter has been record breaking. Records have been set in extra spending by governments, measured as a share of (normal) GDP. For the developed world, this additional emergency spending by governments has ranged between an extra 5% to 15% of GDP.
Another record has been set in money created by central banks, of the order of an extra US$5 trillion. Included in their current bout of quantitative easing (QE) have been substantial purchases of corporate debt.
Since the end of March, US-listed firms have raised a quarterly record beating US$148 billion of extra capital.
The monetisation of debt has meant very low interest rates with which to fund rapidly growing fiscal deficits and rising debt to GDP ratios. Records are therefore also being set in the amount of cash raised by businesses. Since the end of March, US-listed firms have raised a quarterly record beating US$148 billion of extra capital. Monetary policy has made capital raising on a vast scale possible on increasingly favourable terms; and without which, a strong recovery from the lockdowns would have been impossible.
Loan guarantee schemes, provided to commercial banks by central banks, backed up by their countries’ treasuries, have been an important component of the financial relief promised. These loan guarantees – should they be fully required to offset defaults – are available on a large scale. Even in normally fiscally conservative Germany, extra government spending on relief is of the order of 15% of GDP, while the loan guarantee provision is of the order of 30% of GDP. For the US, the stimulus plan is equivalent to 7% of GDP, with the guarantee adding another 8% of GDP to the package.
It makes every economic sense that ordinarily sound and profitable businesses – in SA as elsewhere – should not be forced out of the economy because they are unable to service or roll over their debts for reasons entirely beyond their control. They should be able to start up again by recapitalising their operations.
The SA economy has not benefitted from fiscal and monetary relief on anything like the scale offered elsewhere. The additional borrowing requirement of the SA government has surged to over 14% of GDP, more than double the deficit planned in February, as we learned from the Minister of Finance last month. This was largely because largely because tax revenues have declined so sharply, by over R300bn, with further declines expected. Extra government spending on its adjusted Budget is estimated at R36bn.
A flurry of capital raisings
Despite a relative lack of encouragement of the kind offered in the US and elsewhere to the market for corporate debt, the capital market in SA has been active. We have seen something of a flurry of capital raisings by JSE-listed companies. The issue of relevance to shareholders (and the banks underwriting the issues) is whether the extra capital intended to be raised can pay for itself. In other words, will the extra capital raised earn a return that will cover the (opportunity) cost of the capital raised? We can quantify this as equivalent to the high long-term government bond yield of 8% plus an equity risk premium of 4% or more for the least risky of businesses – 12% or more returns for the least risky of enterprises.
If the answer is a positive one, then a rights issue, or indeed any secondary issue or debt to raise capital, should go ahead. The hope must be that the market immediately shares this justifiable optimism and re-prices the company’s shares accordingly. That is, the market prices the businesses that are raising additional capital to be more likely to survive than go extinct.
The loan guarantee scheme offered by the Reserve Bank in SA is perhaps the best hope for business and economic rescue.
The same positive answer is required of any business (large or small) that needs to raise capital to resume business post-Covid-19. Will the essential extra capital raised cover its risk-adjusted costs? We must hope that the SA financial markets, especially the banks, can help meet these additional calls for extra capital. The loan guarantee scheme offered by the Reserve Bank in SA is perhaps the best hope for business and economic rescue.
The government has the task of ensuring that the capital market is up to this vital task of funding both government and business on sensible terms. Without it, the prospects for a post-Covid-19 recovery in SA, absent fiscal stimulation, remain especially bleak. The burden of economic relief has passed to monetary policy.
What this means for capital raisings on the JSE
As noted above, we have seen something of a flurry of intentions to raise additional capital by JSE listed companies. Retailers The Foschini Group and Pepkor have announced their intention in the form of rights issues to their shareholders. Mister Price, another retailer, has also indicated an intention to raise more equity capital.
Foschini announced plans on 18 June to raise R3.95bn from its shareholders, equivalent to 22% of its market value at the time of approximately R17.5bn. This market value has shrunk by more than half on fears of exposure to Covid-19, accompanied by concerns about a seemingly debt-laden balance sheet. The market has however reacted somewhat favourably to the announcement. The share price has held up since the announcement and regained a little lost ground when compared to the Truworths share price, a rival retailer (see below the figures that chart the market value of Foschini over recent years and where we compare the Foschini share price to that of clothing retail rival Truworths).
Foschini market value 2016 to 22 June 2020
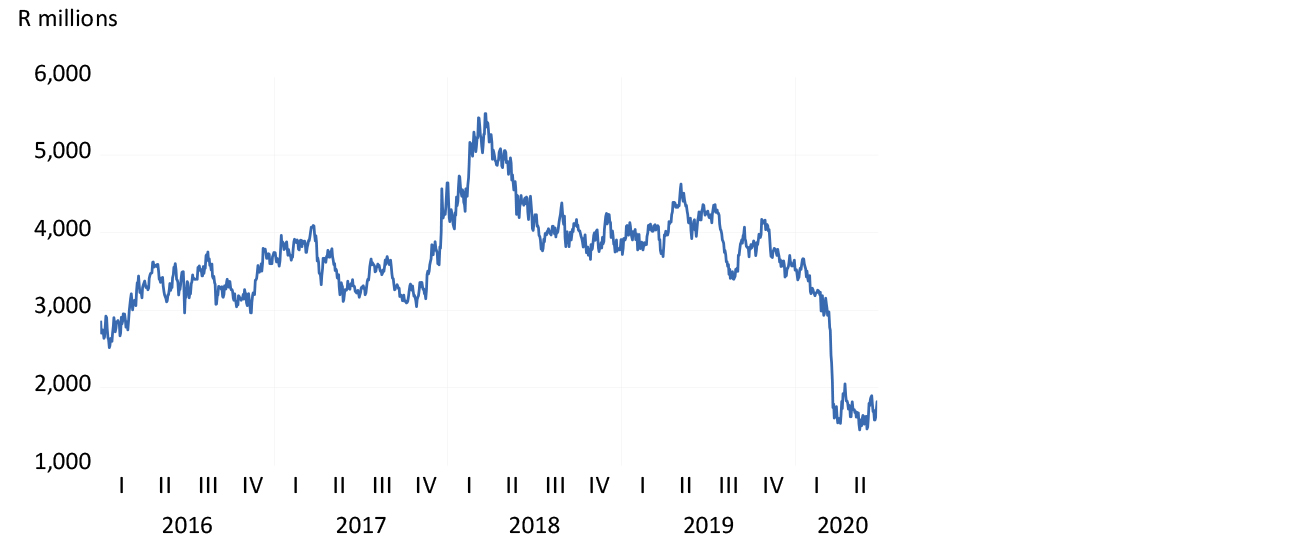
Source: Iress and Investec Wealth & Investment
Foschini share price (TFG) and ratio to Truworths (TRU) share price, to 24 June
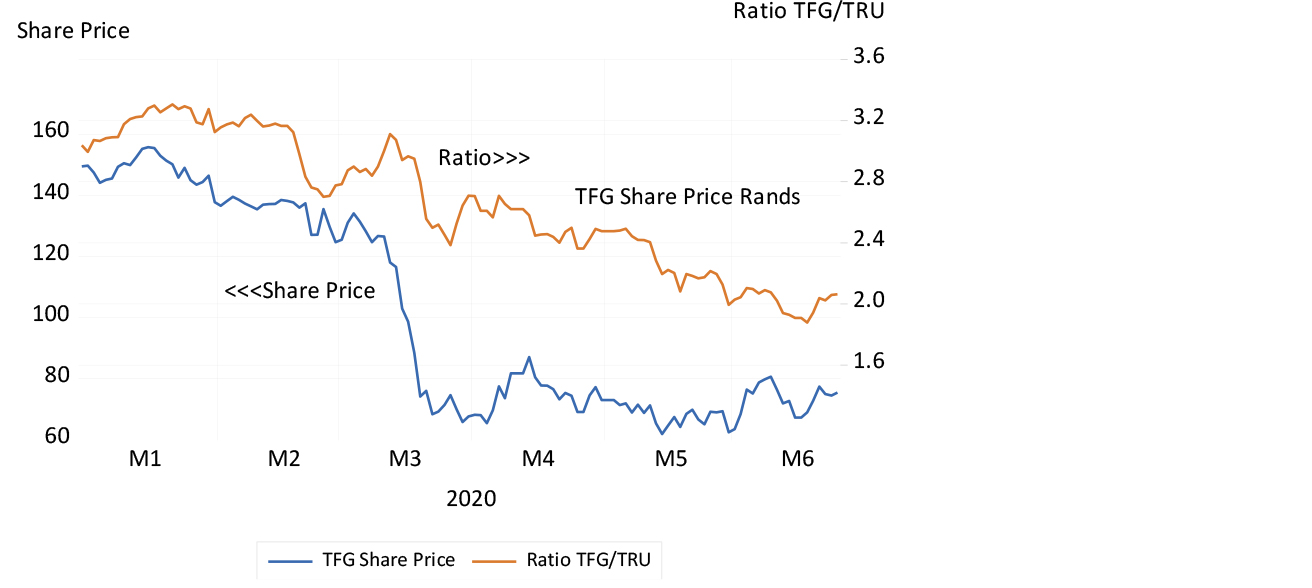
Source: Iress and Investec Wealth & Investment
The terms of the Foschini rights issue (to be underwritten by a consortium of banks) will only be announced should the proposal gain shareholder approval on 16 July. It should be understood that as a rights issue, this extra capital cannot reduce the share of the established shareholders in the company, should they follow their rights. They may however prefer to sell such rights to subscribe. This benefit in selling the rights to subscribe can be regarded as compensation for giving up a share of the company’s profits and dividends and market value in the future.
The value of their rights will depend on the difference between the subscription price and the ruling market price. The larger this discount, the more shares will have to be issued to raise the required R3.95bn – but only from its own shareholders. Hence there need be no dilution for shareholders.
The market value of Foschini must have increased by at least R3.95bn for the shareholders to break even on their additional investment. They will be hoping for more upside over time. And some of the upside may even have been registered already, in anticipation of the rights issue going through, even before the announcement of the rights issue itself, because of the better times it portends for the company.
The larger the difference between the ruling market price and the price at which the additional shares will be offered (the larger the discount), the more likely the rights will have value and be taken up. This outcome is only of importance to the underwriters. The more enthusiastic the response, the fewer shares the underwriters will have to take up. Presumably in this case, the intention of the underwriters is not to hold shares in Foschini.
A rights issue is equivalent to an additional investment by a sole shareholder in a company. The nominal value attached to the additional shares will be of no consequence other than to determine the number of extra shares issued, as identified in the books, all with the same owner. In practice the additional capital invested in a non-listed business is likely to be identified as loan rather than share capital, to enable the owner to rank equally with other creditors in the event of a business failure.
The issue of relevance to shareholders is this: will the extra R3.95bn of capital raised pay for itself over time? In other words, will it earn a return over time on the R3.95bn of additional capital that more than covers the cost of the capital raised?
To add value for shareholders such future returns would need to average around 12-13% a year. That is, going back to the comments above about returns, it presumes that the required returns from a retailer in SA would have to be at least equal to the returns offered by a long dated government bond (currently about 9%) plus a risk premium of 4%. They could hope to realise similar returns from any other JSE company taking similar risks with their capital.
If the answer is a positive one, that is to say expected returns would promise economic profits or economic value added (EVA), the rights issue or indeed any secondary issue (regardless of any dilution that might take place) should be approved.
There is a further consideration that established shareholders will bear in mind when approached for additional capital. The value of their shares will have declined in response to the damage caused to earnings and cash flow by the disruption of their ordinary activities caused by the lock down. Hence the need for additional capital. Companies that entered the lock down with relatively debt-laden balance sheets will be recognised as more vulnerable to financial stress. However the prospect of a rights issue that would mitigate this danger would always be reflected, favourably, in the current value of the shares.
Any failure of shareholders to approve a share issue of this kind would surely raise the likelihood of default and immediately reduce the value of the shareholding. Not throwing good money after bad may be the right decision. But if it comes as a surprise to the market place, such a refusal will provide a very negative signal.
A successful secondary issue, underwritten by bankers, that does not demand participation by possibly jaundiced established shareholders, is perhaps an even stronger signal of favourable longer-term prospects for any company. The avoidance of dilution should not be a primary consideration in any capital raise. If the additional capital is expected to realise an economic profit, established shareholders will benefit, in line with newly attracted shareholders. They can expect to have a smaller share of a larger cake and be better off for it.
The more obvious way to avoid dilution of established shareholders is to raise extra debt rather than equity capital. But the market for debt issues may not be as open as the equity market, as appears to be the case in SA, if not in the US. But debt, as we have seen, makes any borrower riskier and when business-as-usual is disrupted, debt becomes particularly burdensome. Debt is not always cheaper than equity.
The same positive answer is required of any business, large or small, that needs to raise debt or equity capital to resume business post-Covid-19. Will it earn economic profits in the true opportunity cost sense? Will the investment beat its cost of capital, that is return more than is required to justify the investment? We must hope that the SA financial markets, including most importantly the banks, can meet these additional, fully justifiable calls for extra capital. The government and the Reserve Bank has the task of ensuring that the capital market is up to this vital task.

18 June 2020
The Reserve Bank needs to follow the developed market playbook
The Reserve Bank should follow the lead of its developed market peers (and some emerging market peers) in its response to the Covid-19 crisis.
Professor Brian Kantor / Chief economist and strategist, Investec Wealth & Investment
It seems that investors in emerging markets hold their governments and central banks to a much higher fiscal and monetary standard than is expected of their increasingly indebted developed market peers.
What is deemed to be right for the increasingly indebted developed world hoping to recover from the coronavirus – that is massive doses of extra government spending and money creation in support of government debt – is treated with suspicion when proposed or attempted by increasingly indebted emerging market economies, including SA.
We have argued that economies such as our own, which have suffered even more damage from the lockdowns, thanks to more widespread poverty and in the absence of capital reserves accumulated by households and businesses, need all the unconventional help they can get.
Not all emerging market central banks have taken the chastity vow. In Indonesia, as the Financial Times (FT) reported on 15 June: “Finance Minister, Sri Mulyani Indrawati, says quantitative easing and other policies are restoring confidence. Indonesia is at the forefront of emerging markets in implementing monetary policy that was once seen as the preserve of developed economies.”
The minister said that “Indonesia will use unprecedented quantitative easing and other emergency monetary and fiscal policies for as long as it takes to recover from the coronavirus pandemic, according to the country’s finance minister. With the private sector in retreat after weeks of lockdown, massive state spending was needed to shore up the economy”, adding that Indonesia would not rely on central bank financing in the long run: “That is not good policy practice.”
Brazil, according to the FT in another report (8 June) has granted its central bank extraordinary powers for the next 12 months, even though the Bank seems somewhat reluctant to employ them. Central bank President Roberto Campos Neto said he would not employ such measures until traditional tools had been exhausted:
“We still think we have monetary space on the traditional policy. If you start using unconventional policy before you exhaust the conventional policy, you create noise that makes the central bank lose credibility.”
However, according to the FT, the central bank has slashed Brazil’s benchmark Selic interest rate to a historic low of 3% and is expected to cut by a further 75 basis points this month. Campos Neto said there was now greater clarity on the extent of the damage likely to be wrought by the coronavirus pandemic and that “uncertainty regarding the extreme cases has diminished”. The Bank in March launched a US$300bn financial liquidity package — equivalent to 16.7% of the country’s GDP — to mitigate the efforts of the broad economic shutdown caused by the coronavirus pandemic. “I don’t think any other country has done anything close to that,” Campos Neto said.
The case for extraordinary policies is clear enough. When economies are allowed to normalise, hopefully extra demand will match extra potential supplies that then become available. Extra spending to accompany extra output can be assisted by extra government spending – on income relief and relief for lenders and borrowers. Money creation by central banks can make it cheaper to issue more government debt and to encourage banks to lend more freely. In the absence of stimulus, the willingness of firms to increase output and to offer employment on normal terms would be more compromised. They are unlikely to hold optimistic forecasts of revenues and profits upon which to budget. The case for stimulus is thus every bit as strong in the less developed world, including SA.
There is as yet no indication that the SA Reserve Bank sees the crisis as calling for anything like such a vigorous a response. It remains largely in conventional inflation-targeting mode. The supply of central bank money, notes in circulation together with the cash deposits of the banks with the Reserve Bank, defined as the money base or M0, sometimes more evocatively described as high powered money, did not increase at all since the end of last year to May 2020.
Money base to May 2020
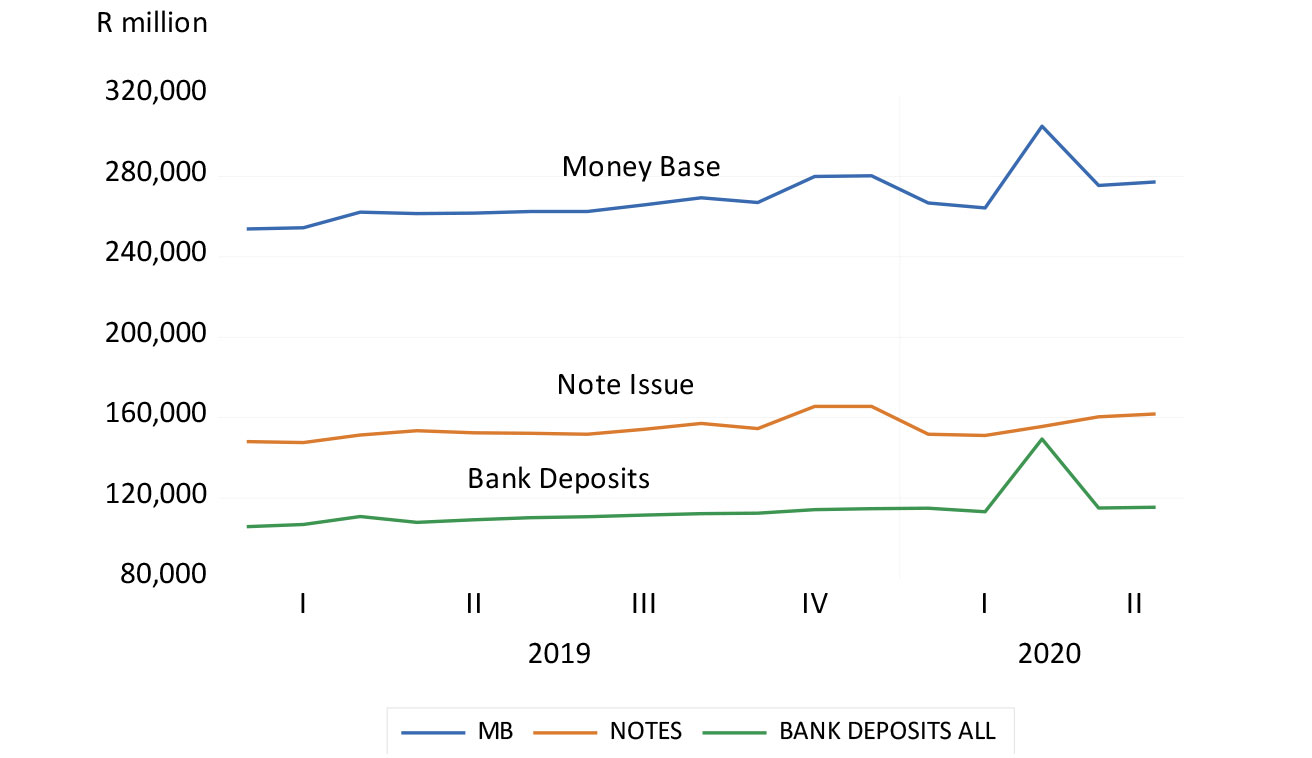
Source: SA Reserve Bank Balance Sheets and Data Bank, and Investec Wealth & Investment
This unchanged level of the money base through the crisis occurred despite the purchase by the Reserve Bank of a modest extra R22bn of RSA bonds in the secondary market (modest by comparison with the other assets held by the Bank that are dominated by its foreign exchange reserves). In May 2020, as a result of drawing on its large deposits with the Bank to make payments abroad, the foreign assets of the Bank declined. Despite the limited QE designed to smooth volatility in the debt markets rather than to stimulate, and despite a significant increase in Reserve Bank loans to banks, net-net the money base has not increased during this time of grave crisis. We show the trends in the assets of the Reserve Bank and its liability to the government in the chart below.
Government deposits are not part of the money base held by the public and the banks. An increase in government deposits reduces the money base and a decline will do the opposite, provided the drawdown is used to fund spending or debt repayments in SA. If, as appears to have been the case in May 2020, the payments by the government (drawing down its deposits) went to foreign creditors and so foreign banks, the SA banks will thus not have seen an increase in their cash reserves and deposits with the Reserve Bank. In May, the loans to private banks declined sharply – also reducing the money base. Thus, despite the purchase of an additional R10bn of government stock by the Reserve Bank, the money base in May was practically unchanged and no larger than it was in December.
In the charts below, we show the Reserve Bank balance sheet over the period since December and the monthly changes in some of the key items that move the money base – the notes in circulation plus the deposits of the banks with the Reserve Bank.
The money base in SA and its sources (December 2019 to May 2020)
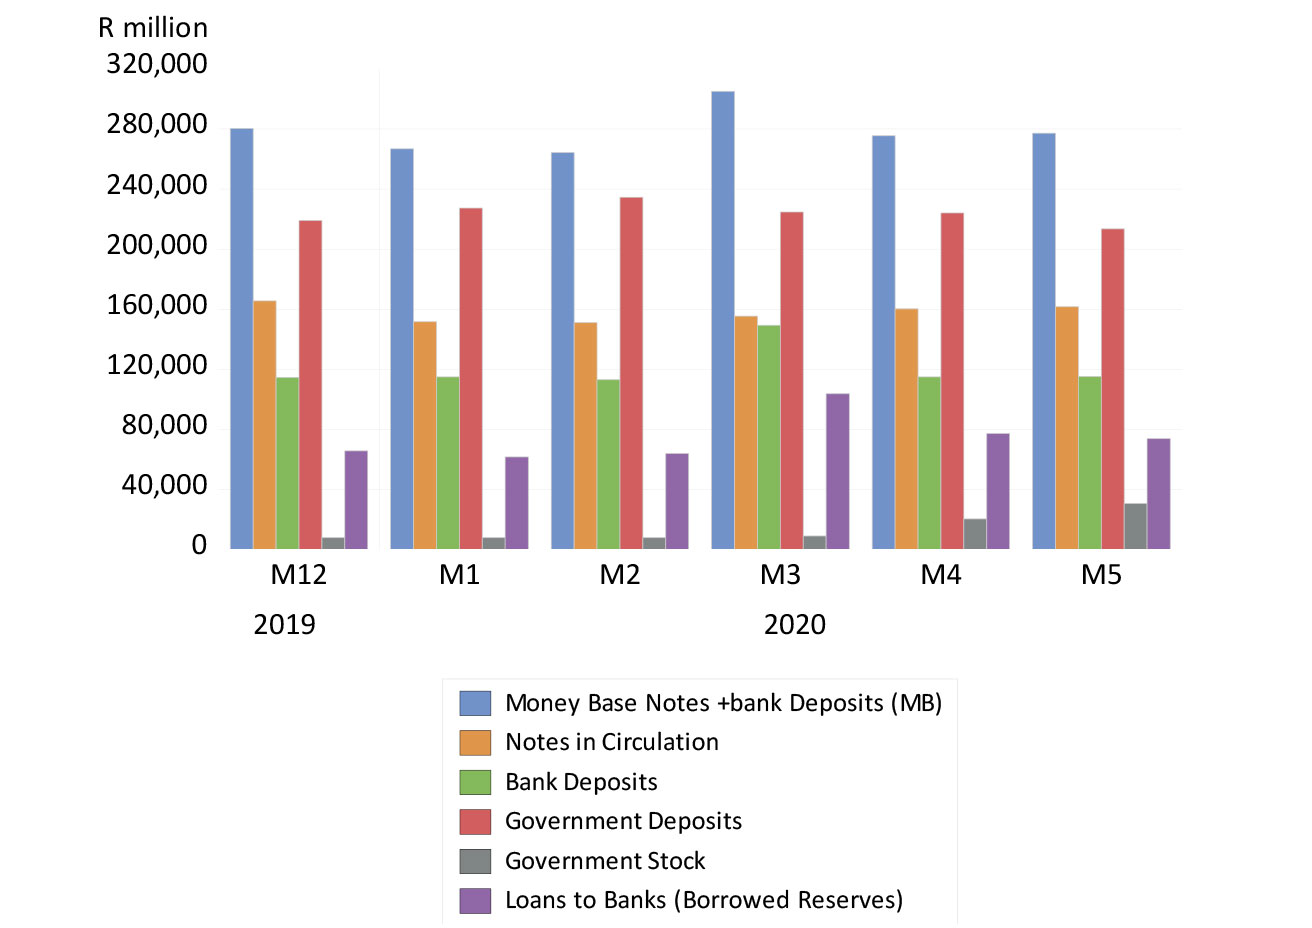
Source: SA Reserve Bank Balance Sheets and Data Bank, and Investec Wealth & Investment
Reserve Bank balance sheet – monthly movements affecting the money base (December 2019 to May 2020)
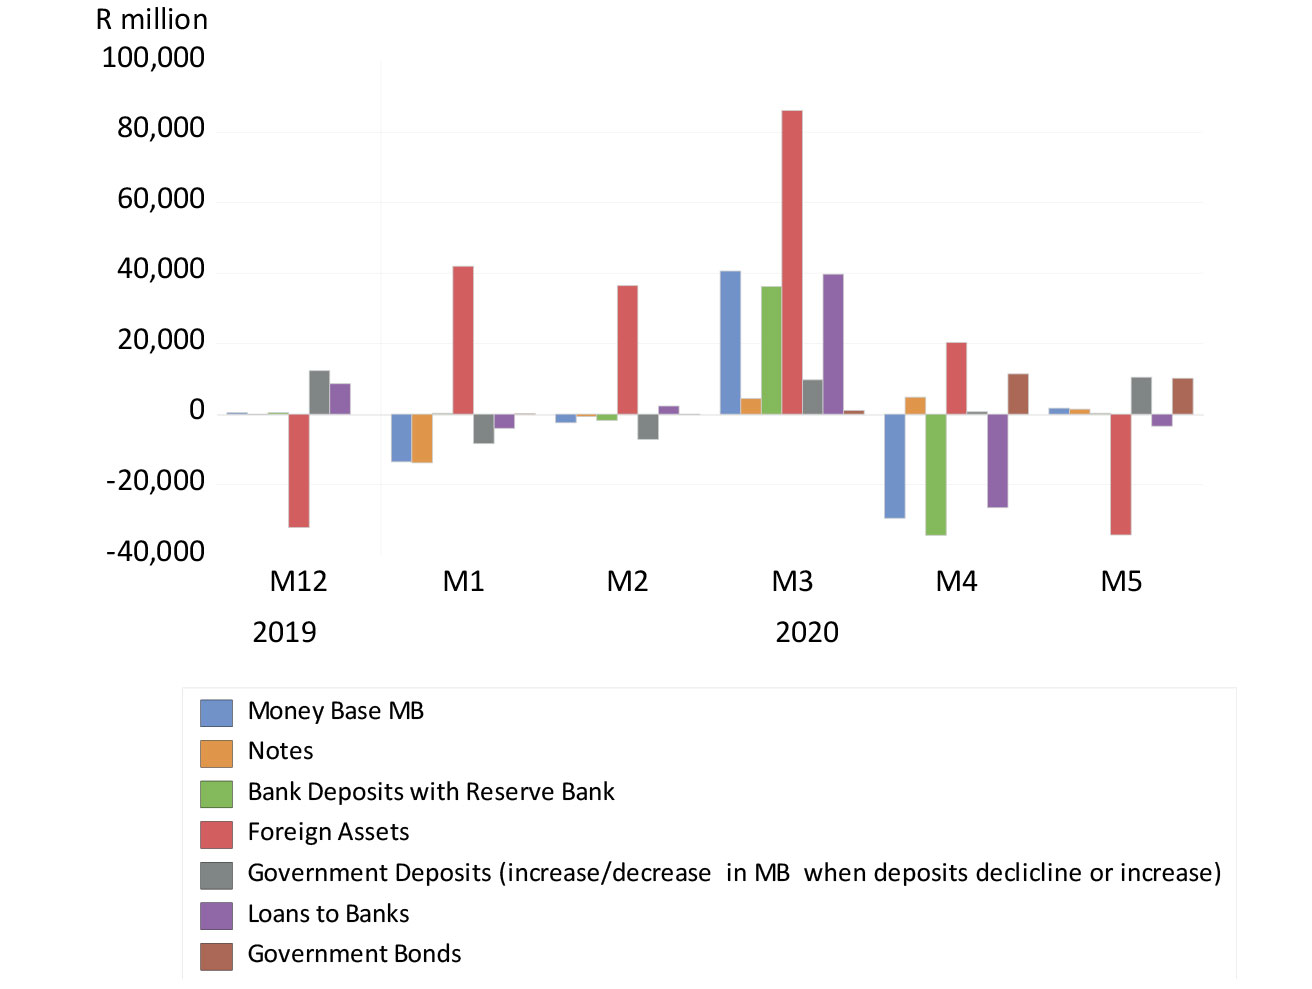
Source: SA Reserve Bank Balance Sheets and Data Bank, and Investec Wealth & Investment
SA desperately needs the same extraordinary interventions to counter the impact of the lockdown now underway in the developed world, and as we have indicated, also in some developing economies. Given the responses of the SA Treasury and Reserve Bank to date, it is not surprising that the consensus forecasts of market analysts are for a below average reduction in SA GDP in 2020 of 6%, but thereafter for a well below increase in GDP in 2021, a pedestrian 2%.
What is called for is firstly a properly vigorous response to the crisis. It also calls for a credible commitment to a return to fiscal and monetary normality when the crisis is over, and when the economy is operating at something like its potential. That long-term growth potential surely has to be above 2% annual growth. To realise permanently faster growth, needs more than effective crisis management. It calls for reforms of the economy.

3 June 2020
How not to waste a crisis – growth and exchange rates in a post-Covid-19 world
The current crisis provides an opportunity to stimulate the most helpful possible source of growth for SA: exports and import replacement.
Professor Brian Kantor / Chief economist and strategist, Investec Wealth & Investment
After the lockdowns, the patterns of household spending are widely expected to change permanently. How it will change is of importance to almost all businesses that supply households, directly or indirectly. The demand to fly to some holiday destination affects hotels, B&Bs, restaurants, airports, travel agents, airlines, car rental companies, taxi companies and so on, as well as the people they employ or contract with.
Household spending accounts for 60% of spending in SA, and 70% in the US and other developed economies. Absent of government control (very active in the lockdowns), the decisions of households to spend, save or borrow always moves the economy in one direction or another. The market place, post-Covid-19, will make the same call on its suppliers to adapt to changing tastes and to innovate successfully. They will look to lead household spending to their portals, real or virtual, depending on what will work best.
There is every reason for governments and central banks to ameliorate the current economic damage and offer compensation for the loss of incomes from work, including for the owners of businesses. Governments have every reason to encourage the demand for all goods and services when they allow firms after the lockdown to do what comes so naturally to them, that is to compete for custom and for the resources, labour and capital and premises to help them do so. There is no more reason for governments to get involved trying to pick post-Covid-19 business winners or losers than they would have at any other time.
They will also need to leave future taxpayers with as little a burden of interest to pay on the additional government debt incurred. Printing money rather than issuing expensive debt (when debt is as expensive as it is for the SA taxpayer) makes sense. The inflation in SA that might ordinarily come with money creation is a long way off – at least until supply and demand can recover to something like their potential.
They say no crisis should be wasted. The crisis provides an opportunity to stimulate what would be the most helpful source of growth for SA: exports and import replacement. The weaker rand has made SA potentially more competitive than it was only a few months ago. Adjusted for differences between SA and US consumer price inflation, the rand at R17.50 to the US dollar is about 50% undervalued against the dollar and about 18% more competitive with the US exporter or importer than it was at year-end. A purchasing power equivalent dollar would now cost R8.70.
There is a case for retaining this competitive advantage. It is easy to inhibit exchange rate strength, should it materialise. The Reserve Bank can buy US dollars with the rands it has an unlimited supply of. The Swiss National Bank does this all the time to hold back the Swiss franc. Furthermore, buying dollars with rands would add to the supply of rands – it would be another form of money creation. Every extra rand can encourage more spending and lending, which is urgently needed for the recovery. The Reserve Bank should never attempt to prevent exchange rate weakness.
The USD/ZAR exchange rate and its purchasing power equivalent to 27 May 2020
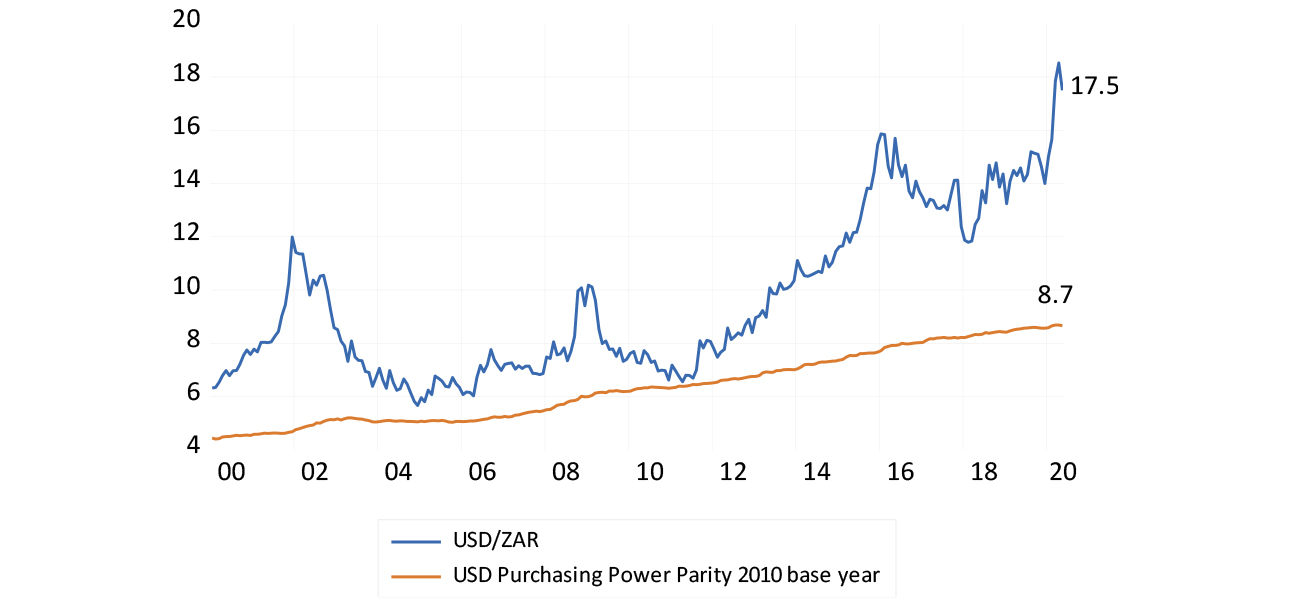
Source: Bloomberg, Investec Wealth & Investment
Note: the purchasing power parity (PPP) rand is calculated as the USD/ZAR in December 2010 (USD/ZAR=6.31) multiplied by SA CPI/US CPI). 2010=100
In the figure below, we chart the relationship between the purchasing power value of the rand and its market value. This relationship represents the real exchange value of the rand, with lower values indicating real rand weakness, or equivalently greater competitiveness for SA producers. We compare the real exchange rate using the consumer price indexes for SA and the US and the real rand exchange rate, as calculated by the Reserve Bank. This real exchange rate is adjusted for the prices of manufactured goods of our 20 largest trading partners (weighted by their importance in our trade), using the prices of manufactured goods as the basis of comparison (this ratio has not been updated since the year-end. It will likely see a similar decline in real exchange value).
Given the stronger dollar, the depreciation of the real rand is less severe than the real dollar exchange rate. But it will indicate a similarly enhanced pricing or profit opportunity to advance exports and reduce imports.
The real rand against the US dollar and our trading partners (2010=100)
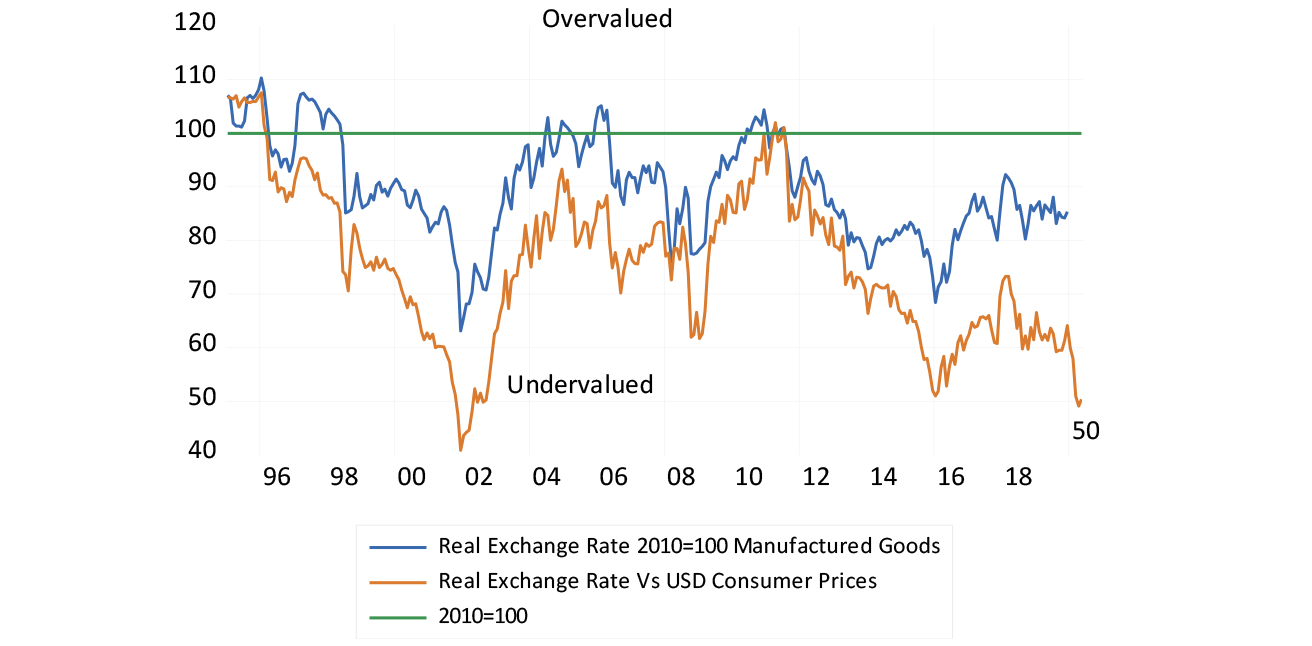
Source: Bloomberg, SA Reserve Bank and Investec Wealth & Investment
The value of the real rand is dominated by changes in the market value of the rand that fluctuates so widely and unpredictably, as we show below, where we compare quarterly movements in the market trade-weighted value of the rand and its inflation-adjusted value. It is a case of the market exchange rate leading and the direction of inflation following, rather than inflation leading changes in the market value of the rand. The so-called pass-through impact of a weaker or stronger rand on prices in SA depends also on the direction of import prices in US dollars. Especially important will be the dollar price of oil that makes up a large percentage of SA imports, up to 40% at times.
With oil prices as low as they are now, the pass-through effect on SA prices and inflation is likely to be subdued. Exporters from SA, especially of metals and minerals, are largely price takers, in US dollars. The weaker rand translates automatically into higher rand prices. How much the weaker rand drives up the costs of our exporters depends on the direction of SA inflation. This is likely to remain subdued for now, given the weakness of demand for goods, services and labour.
The USD/ZAR and the EUR/ZAR exchange rate is almost twice as variable on average as the USD/EUR exchange rate. This year is no exception.
This volatility of the rand exchange rate is a burden that SA exporters, importers and those who compete with exports and imports in SA, have to bear. It adds to their costs of hedging exchange rate risk and the uncertainty about the actual direction of the rand demands a higher expected return on their investments.
Quarterly percentage movements in the nominal and real trade-weighted rand – lower numbers indicate rand weakness
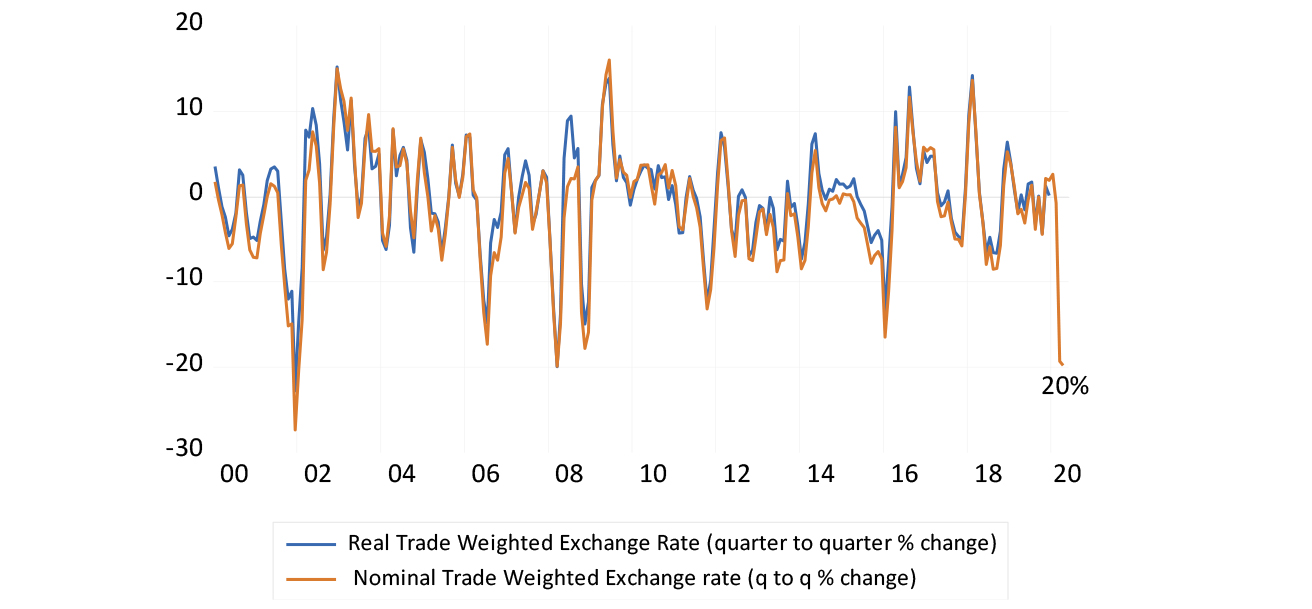
Source: Bloomberg, SA Reserve Bank and Investec Wealth & Investment
Volatility of the USD/ZAR, the USD/ZAR and the EUR/USD
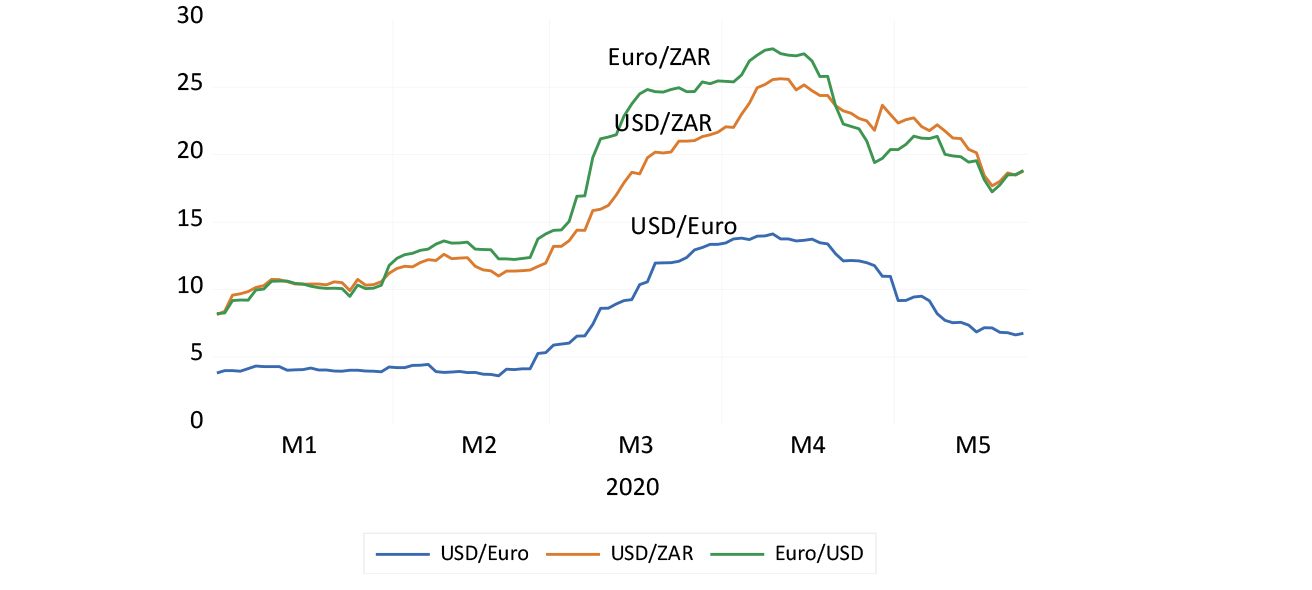
Source: Bloomberg and Investec Wealth & Investment
There should be two objectives for exchange rate policy during and after the crisis. The first, should the opportunity present itself, is to inhibit rand strength in order to encourage domestic production and consumption. Inflation will likely be looking after itself and interest rates do not need a stronger rand to decline further. The weak domestic economy is more than reason alone for lower interest rates. The second, and a much more difficult longer-term exercise, is to seek ways to inhibit the exchange rate volatility that is such a burden on foreign trade.

20 May 2020
How not to waste a crisis – growth and exchange rates in a post-Covid-19 world
Funding extra government spending via loans from the central bank, can be a helpful form of government finance when spending is growing rapidly to meet an emergency.
Professor Brian Kantor / Chief economist and strategist, Investec Wealth & Investment
Today is a time of epidemiologists, central bankers and yes, of schemers too. We will discover in due course whose reputations will have survived the economic crisis better intact.1
Central banks have an essential duty to create extra money for a growing economy. They do so on a consistent basis in normal times. Their extra money comes in two forms: as notes and coins and in the deposits private banks keep with their central banks.
The SA Reserve Bank has not failed in its duty to supply more cash to the economy over the past 20 years. For much of the period it might have supplied too much cash. More recently, it can be criticised for supplying too little for the health of the economy as we shall demonstrate.
The sum of the notes and the deposits issued by the SA Reserve Bank (the money base) grew by 7.9 times between 2000 and April 2020, from R35bn to R275bn at an average compound rate of 8.7% a year over 20 years.
Figure 1: SA Reserve Bank – Monthly supplies of notes and bank deposits 2000 to 2020
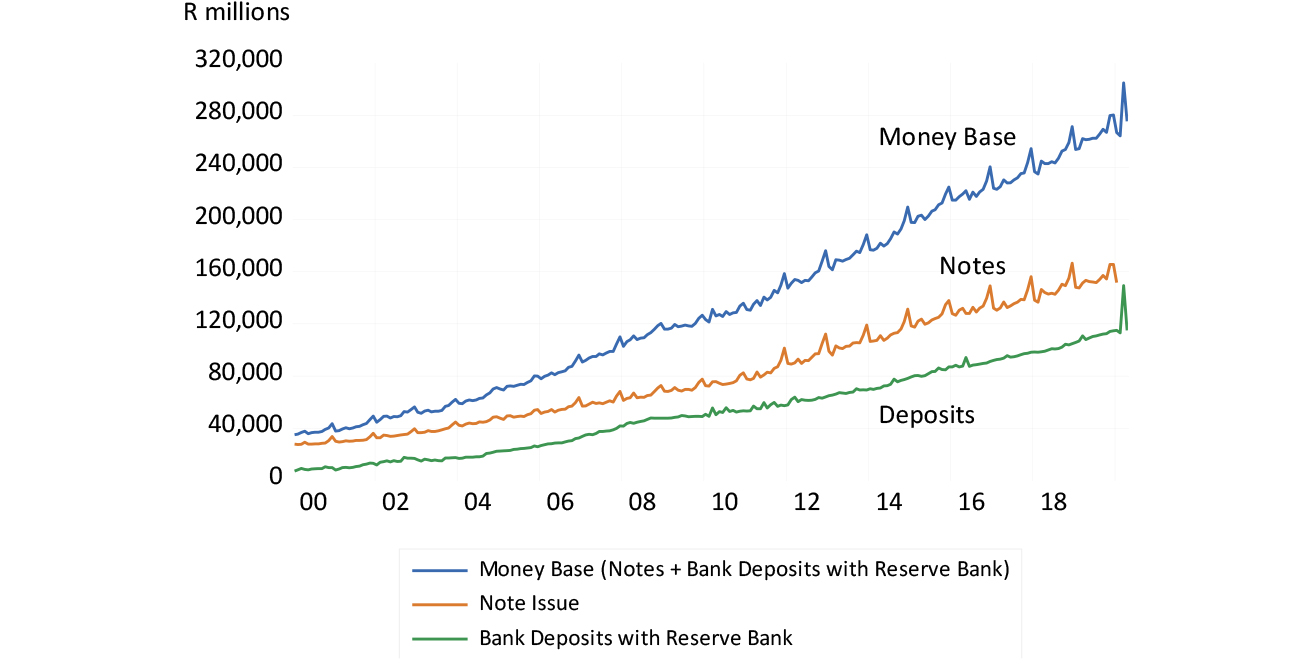
Source: SA Reserve Bank and Investec Wealth & Investment
1 With apologies to Edmund Burke, responding to the excesses of the French Revolution: “Today is a time of sophists, economists and schemers.” - Reflections on the French Revolution
The ratio of the broadly defined money supply (M3), which includes bank deposits, to the money base (the money multiplier), reached a peak of nearly 17 before the financial crisis of 2008 and has now stabilised at about 14 times.
Figure 2: Calculating the money multiplier – the ratio of broad money (M3) to central bank money (money base) 2000 to 2019
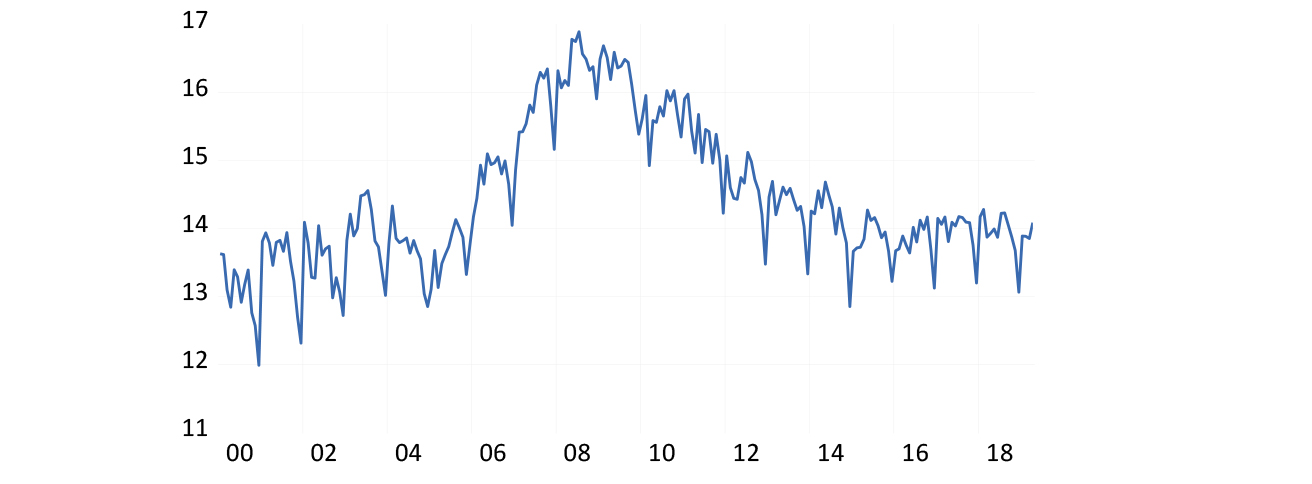
Source: SA Reserve Bank and Investec Wealth & Investment
The Reserve Bank balance sheet has been updated to April 2020. The money base (notes plus bank deposits) as at the end of April 2020 was in fact R5bn smaller than it was at 2019 year-end, despite the crisis. The money base fell by R29.4bn between March and April 2020, even though the note issue itself rose by R4.82bn in April, surely in response to crisis fears. The deposits of the banks however fell more sharply, from R103.4bn in March to R77.34bn by April.
The Reserve Bank’s portfolio of government stock, a small part of its asset portfolio, grew from R8.1bn at year-end to R20.6bn in April. This may be compared to loans made by the Reserve Bank for the banking system. They grew from R65.8bn at year-end to R103.9bn by March, but then (surprisingly in the crisis circumstances) fell back to R77.34bn by April month-end.
If the Reserve Bank were to embark on meaningful money supply growth loans to the banking system, its holdings of government stock would have to increase meaningfully. An increase in Reserve Bank lending to the banking system on favourable terms would allow the banks to support extra issues of short-term Teasury obligations at hopefully much lower rates of interest (see figures below for details of the balance sheets of SA banks since 2000 and of the Reserve Bank balance sheet this year).
Figure 3: SA banks deposit liabilities (M3), and uses and sources of cash
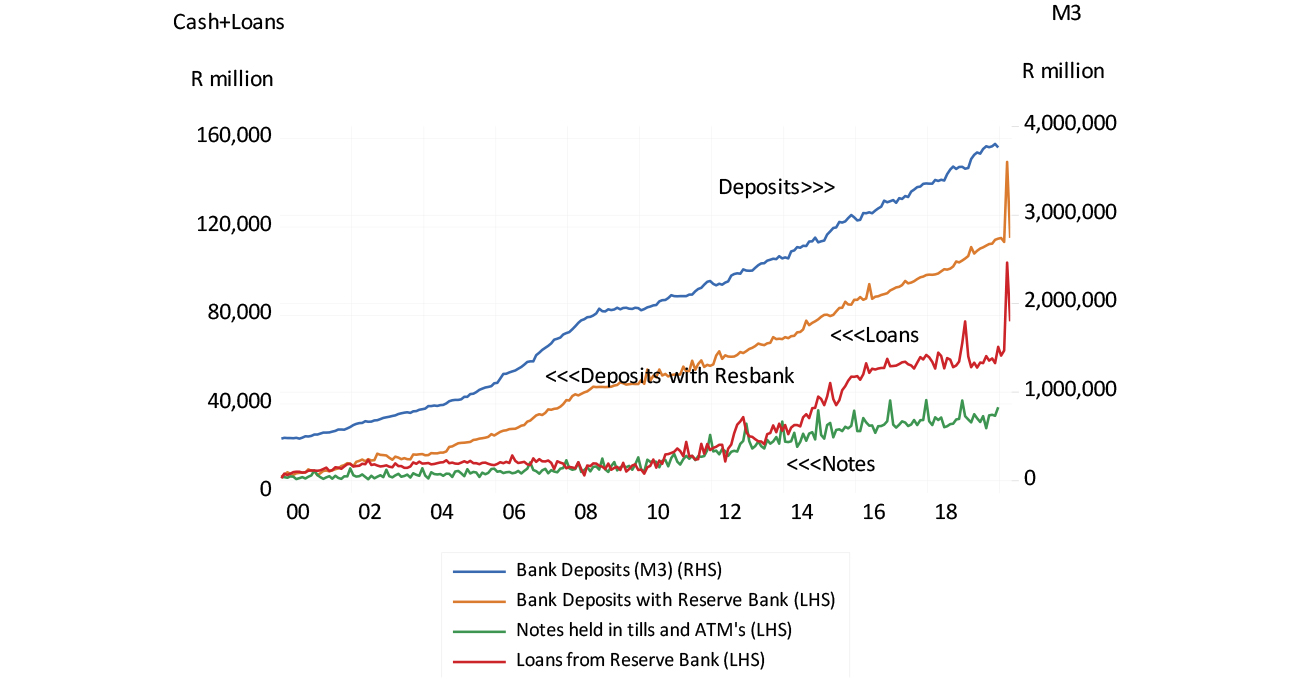
Source: SA Reserve Bank and Investec Wealth & Investment
Figure 4: The Reserve Bank balance sheet (selected items) to April 2020
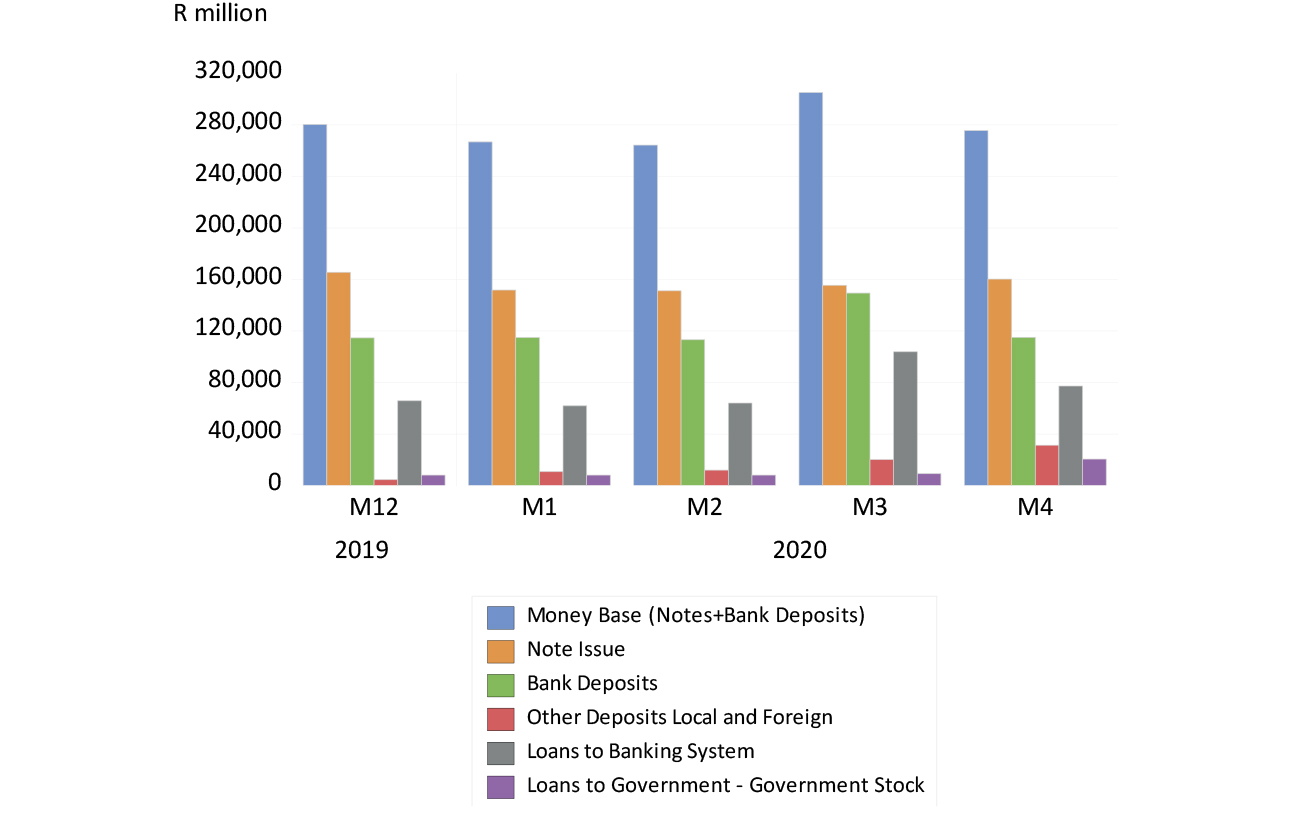
Source: SA Reserve Bank and Investec Wealth & Investment
There is always a temptation for a government to borrow money from its central bank to fund its expenditure by issuing money. Almost zero cost money may be issued as an alternative to raising taxes or paying interest on the debt it raises to fund its expenditure. It is a temptation that is widely (but not always) resisted.
How much money should be created as a service to an economy and its banks that manage the payments system? The answer in very general terms is for a central bank to supply not too much and not too little cash for the economy. Not too much – that is not to supply more than the households, businesses and banks would willingly hold as a reserve of spending power. But to supply enough extra cash to satisfy demands that would grow normally in line with real economic activity.
It is not the supply of money and of associated bank and other credit that represents inflationary dangers or the danger of asset price bubbles that must all end badly for an economy. It is the excess of the supply of money – over the willingness to hold the extra money supplied – that is to be avoided if inflation is to be controlled.
Also to be avoided is to supply too little money. If the supply of extra money is constrained, economic actors would be inclined to cash in assets or save more to build up a cash reserve. This too would not be good for an economy.
The task central banks set themselves is to smooth the business, money and credit cycles by adjusting the cost of the money they supply to the economic system. They raise the repo or discount rates they charge the banks who borrow from them, when the economy and the supply of bank credit appears to be accelerating too rapidly. They will also lower the cost of their money, reduce the repo or discount rates, to encourage the banks to extend more credit to avoid or overcome a recession. However this fine balance of additional supplies of and demands for money is seldom achieved. The business cycle has not been eliminated by modern monetary policy.
The business cycle – extended periods of above and then below potential real growth – can be mostly linked to phases of more rapid and then much slower growth in money supply and bank credit. Inflation, for which a central bank usually has a target range, will tend to follow the direction of the business cycle.
The times when the price level takes a course independently of the direction of the business cycle calls for particularly sensitive attention by the monetary authorities. Raising interest rates in response to a supply side shock to the economy that results in temporarily higher prices (for example following a shock to the oil price, food supplies or to the exchange rate) may well prove to be pro- rather than counter-cyclical. It may slow the economy down further than it might otherwise have done.
These norms and objectives for monetary policy do not apply in the extremes of a crisis, when sudden demands for extra cash threaten the banking financial and payments system. The solution for a crisis is for a central bank to supply as much extra cash as is necessary to prevent ordinarily sound businesses and financial institutions from going under and dragging the economy down with them.
Shutting down an economy to fight a pandemic is a new challenge for monetary policy. It also calls for a rapid increase in the supply of central bank money and sharply lower interest rates where there is room to lower them.
Funding extra government spending via loans from the central bank, or funded by a banking system well supported with loans from the central bank, is a helpful form of government finance when spending is growing rapidly to meet an emergency, and correctly so. Funding with money or near money avoids the long-term burden for taxpayers of funding extra debt issues at high interest rates in an unwilling capital market. And by adding extra money to the system, it makes a much-needed recovery of spending more likely when the economy comes out of lockdown.
The extra money cannot be inflationary until the economy and spending recovers. At that point, the growth in the supply of money and credit can be reduced or reversed in the usual way.
When an economy is forced to its knees, an emphasis on inflation targets makes little sense. SA urgently needs and deserves (proportionately) as much extra money as is being provided in the developed world. By contrast, the money base in the US has been increased by 40% this year with more money on the way.

11 May 2020
The R1 trillion question – estimating the GDP costs of the lockdown
What the economic cost of the lockdown is likely to be – and why the usual ways of measuring GDP changes may be misleading.
Professor Brian Kantor / Chief economist and strategist, Investec Wealth & Investment
What the lockdowns will have cost their economies before economic life returns to something like normal, will only be measured with some degree of accuracy after the event. This will be the difference between what might have been produced or earned, measured by gross domestic product (GDP), had economies not been shut down, and what was produced and earned in the process, despite the lock downs.
It is possible to forecast potential GDP pre the crisis by extrapolating the underlying trend in outputs and incomes before the crisis. A more complicated econometric model could attempt the same forecasts. The difference between this potential GDP and the GDP delivered over the two or three years, post the crisis, will give us an accurate enough estimate of the costs of the lockdown.
To help get a handle on all of this, we have estimated a GDP loss ratio for SA under lockdown. We have made a broad-brush estimate of how much of potential GDP will be produced each quarter in SA. On this basis, we assume that in Q1 2020 SA GDP ran at 90% of its potential, then in Q2, when the knock down impact is presumably at its most severe, we judge that the GDP will then run at 75% of what might have been delivered without the crisis. In each quarter therafter, the loss of output ratio reduces by 5% per quarter. In other words, GDP will rise to 80% of potential in Q3, 90% in Q4, 95% in Q1 2021 and then back to 100% in Q2 2021.
This would mean a V-shaped recovery, bringing the economy back to its potential by mid-2021. We acknowledge that this might be an optimistic scenario. Even so, the loss in GDP each quarter on these assumptions amounts to a very damaging over R1 trillion by Q2 2021.
It would be a loss equal to about 25% of the GDP delivered in 2019. Compare this with the extra R500bn the government plans to spend on economic relief. Whatever the precise measure of GDP over the next few years, there are undoubtedly large opportunity costs in the form of sacrificed output and incomes that South Africans will be bearing.
The economic damage of the lockdowns will be painful and will be measured as foregone GDP, with a good degree of accuracy. These sacrifices of income and output will not be shared equally by all South Africans. Many will lose jobs that will be difficult to replace. Others will lose their jobs and the businesses that self-employed them. Some businesses will survive better than others in the new world of business after the coronavirus. Many will see the value of the pensions and retirement plans, their hard-earned savings, painfully reduced.
Overspending to mitigate the damage caused would be better than underspending, especially if the interest rate charge to future taxpayers can be limited by money creation.
To survive, businesses will need a reserve of working capital to start up again. The banking system, with assistance from the government and the Reserve Bank, should be able to provide some effective support for those with viable businesses, but without the means to start them up again. Arguably, it would only be fair for the government to help the banks do so by creating money for the banks to deploy in the form of extra bank credit. Overspending to mitigate the damage caused would be better than underspending, especially if the interest rate charge to future taxpayers can be limited by money creation. At times like these, traditional parsimony is uncalled for.
Would it be unfair to point out that those in SA who are employed by the government at all levels, will lose neither incomes nor the pension benefits the SA taxpayer has guaranteed them on retirement? Their willingness to accept a wage and salary freeze might seem a proper form of reciprocation.
The actual GDP numbers over the next two years will be closely watched and used to update our GDP loss ratio in order to gauge the shape of the recovery. It will hopefully be a V-shaped recovery as we have estimated. However, it could be a less helpful and prolonged U-shaped recovery, with an extended bottom to the U should the economy struggle to revive its spirits and confidence. Worse, the economic recovery might even take a W course – a brief recovery followed by a further decline and then only later a recovery.
The economic growth rates as they unfold will not mean what they usually do. They should therefore be treated with great care over the next few years. GDP growth rates are most often presented as annual percentage growth from quarter to quarter, when GDP has been adjusted for seasonal influences and converted to an annual equivalent (growth from one quarter in seasonally adjusted GDP to the next quarter is then raised to the power of four to provide an annualized growth rate). This is the growth rate that attracts headlines.
Two consecutive negative growth rates measured this way are regarded as indicating a ‘technical recession’. The implication of this annual equivalent growth rate is that quarterly growth is expected to continue at that pace for the next year. Under lockdowns, growth so measured is likely to become even more variable than it usually is.
This will be especially true of Q2 2020 when the impact of the lockdown will be at its most severe, perhaps reducing growth in GDP to a truly shocking negative rate of minus 50% or thereabouts.
Estimating growth on this quarter-to-quarter basis over the next few years will be a poor guide to the underlying growth trends.
Following our estimates of the loss ratio and GDP, as an example, would show a very sharp contraction in Q2 2020, to be followed by positive growth of 40% in Q3 and Q4, 10% in Q1 2021 and then as much as 50% again in Q2 2021. The recession will seemingly have been avoided and the economy will soon be recording boom time growth rates. This would be a misleading account of what has been going on with the economy.
If GDP is compared to the same quarter a year before, we will get a much smoother series of growth rates. It is likely to show negative growth throughout 2020 (down by as much as -20% in Q2) with strongly positive growth of 30% resuming in Q2 2021 when measured off the highly depressed base of Q2 2020, when the lockdown was at its most severe.
The better way to calculate the impact of the lockdown in terms of growth rates would be to calculate the simple percentage change in GDP from quarter to quarter (not seasonally adjusted or annualised) as the impact of the lockdown unfolds and gradually, we should hope, dissipates. The worst quarters measured this way will be Q2 and Q3 2020, after which quarter-to-quarter growth in percentage terms will become positive. See the figure below that turns our estimates of quarterly GDP in current prices over the next few years into the alternative measures of growth rates.
Estimated quarterly growth rates between 2020 and 2022 under alternative conventions
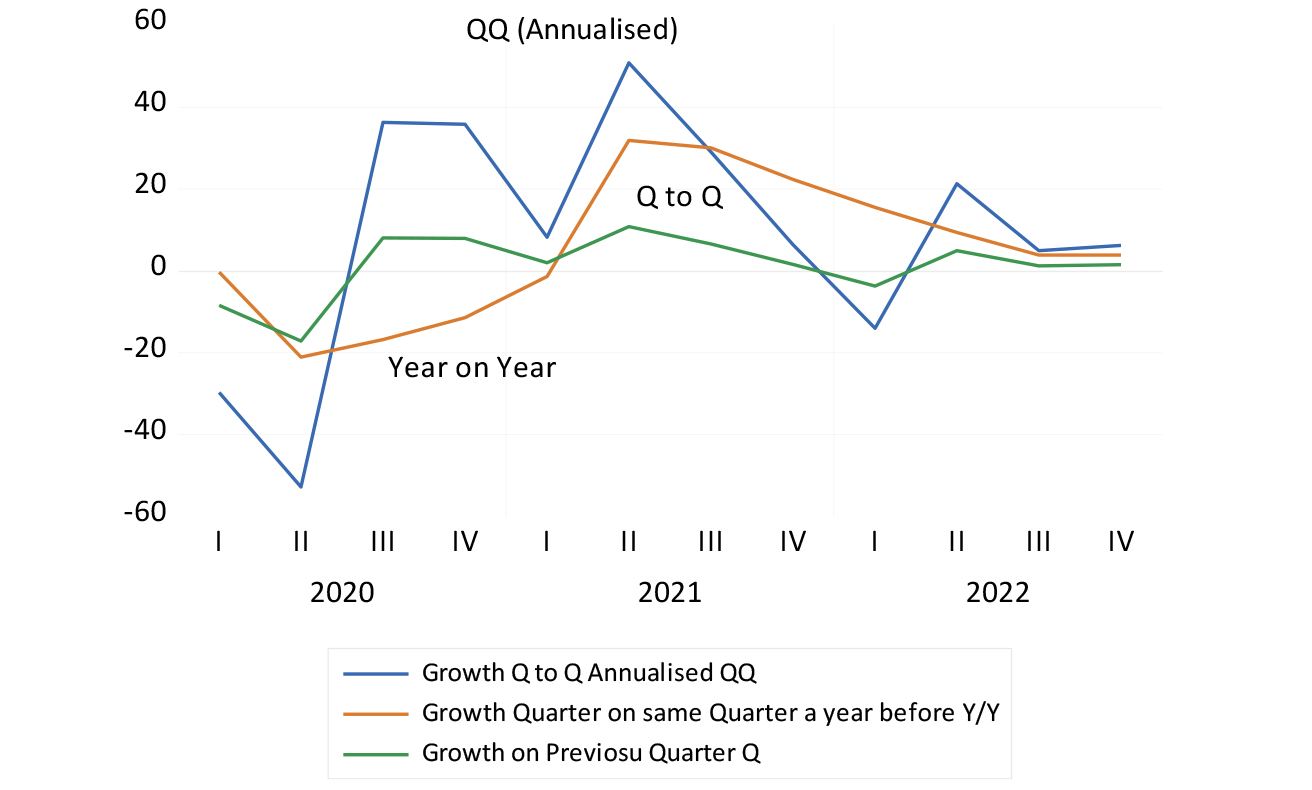
Source: SA Reserve Bank and Investec Wealth & Investment
The upshot is that growth rates will not be able to tell what has happened to an economy when subject to a severe supply side shock that is temporary in nature. Measuring in absolute terms, in money of the day GDP sacrificed each quarter, as we have attempted to do as a forecast, will tell the full tale of economic destruction under way. We would be pleased if the bill for economic loss was measured as less than the R1 trillion we estimate.
Monetary and fiscal policy should be fully engaged in avoiding such disappointments. Lower interest rates, combined with a degree of money creation, used to fund significantly more government spending, are urgently called for to revive the SA economy.

28 April 2020
Has the US market crash fully discounted the permanent loss of earnings?
Does the reduced value of the S&P 500 reflect the earnings permanently lost after the coronavirus? We give a provisional answer.
Professor Brian Kantor / Chief economist and strategist, Investec Wealth & Investment
The tribe of company analysts is hard at work revising the target prices (almost all lower) of the companies they follow. They will be adjusting the numerators of their present value calculations for the permanent losses of operating profits or free cash flow caused by the lockdowns. They will attempt to estimate the more long-lasting impact on the future performance of the companies they cover, after they get back to something like pre-coronavirus opportunities.
What discount rate will they apply to the expected post-coronavirus flow of benefits to shareholders? Will it be higher for the pandemic risk or lower because long bond yields are expected to remain low for the foreseeable future? When they have revised their target prices for the companies they cover, we could theoretically add up how much less all the companies covered by the analysts are now estimated to be worth. We would count the total damage to shareholders in trillions of US dollars since 1 January.
The analysts are taking much longer than usual to revise their estimates of forward earnings and target prices. But investors in shares are an impatient lot. They are making up their own collective minds, also with difficulty, as the turbulent markets and the high cost of insuring against market moves shows.
The companies listed in the S&P 500 Index were worth a collective US$28.1 trillion on 1 January 2020. By 23 February, when the market peaked, they had a still higher combined market value of US$29.4 trillion. By 23 March, the market had deducted nearly US$10 trillion off the value of these listed companies. Yet by 17 April, the market had recovered strongly from its recent lows, and was worth US$24.6 trillion, or US$3.5 trillion less than the companies were worth on 1 January. Is this too low or too high an estimate of permanent losses?
Figure 1: The market value of companies listed in the S&P 500, to 23 April 23 2020

Source: Bloomberg and Investec Wealth & Investment
We will try to answer these questions. First, we attempt to estimate the damage to S&P reported earnings. These lost earnings can be compared with the losses registered in the market place, the US$3.5 trillion of value destruction. To do so, we first extrapolate S&P earnings beyond 2019, using a time series forecasting method. This forecast is used to establish the S&P earnings that might have been, had the economy not been so cruelly interrupted. We then estimate the earnings that are now likely to be reported, by assuming a loss ratio. That is the ratio between the earnings that we predict will be reported as a ratio to the earnings that might have been, had the US not been disrupted by the coronavirus.
As we show in the figure below, the reduction in reported earnings is assumed to be very severe in Q2 2020, when earnings to be reported in Q2 are assumed to be equivalent of only 25% of what might have been had the earnings path continued at pre-crisis levels. Then the loss ratio is assumed to decline to 30% in Q3, 50% in Q4 2020, and 75% in Q1 2021, where after it is estimated to improve by 5% a quarter until the earnings path is regained in Q2 2022.
The calculations are indicated in the charts below. The total accumulated loss in earnings under these assumptions would be a large US$3.4 trillion. It will be seen that the growth in estimated S&P 500 earnings turns positive, off a very low base, as early as Q2 2021. The key assumption for this calculation is the loss ratio, as well as the time assumed to take until back to the previous path. The more elongated the shape of recovery and the greater the loss ratios, the more earnings will be sacrificed.
If this assumed permanent loss of over US$3.4 trillion were subtracted from the pre-coronavirus crisis value of the S&P 500 of US$28 trillion, it would bring the S&P roughly to the value of about US$24 trillion recorded on 17 April.
Figure 2: The quarterly flow of S&P earnings in billions of US dollars

Source: Bloomberg and Investec Wealth & Investment
Figure 3: Estimated quarterly loss of earnings per quarter (billions of US dollar) and growth in estimated earnings (year-on-year) 2019-2022

Source: Bloomberg and Investec Wealth & Investment
How much S&P 500 gross earnings will be lost permanently is still to be determined with any degree of confidence. The US$3.4 trillion loss we estimate is consistent with the losses recorded to date in the market value of the S&P 500 companies. The environment after the coronavirus and the impact of the new political economy will have to be considered carefully when assessing the long-term prospects for businesses. As always, the discount rate applied to future economic profits will have a decisive role to play in determining the present values of companies.

13 September 2019
Slow growth is a vicious cycle. Virtue can replace vice
A vicious cycle of slow growth and low investment can be replaced by a virtuous cycle, if the political will is there.
Professor Brian Kantor / Chief economist and strategist, Investec Wealth & Investment
We are well aware that slow economic growth depresses the growth in tax revenues. What is not widely recognised is the influence that tax rates and taxation have on economic growth. The burden of taxation on the SA economy, measured by the ratio of taxes collected to GDP, has been rising as GDP growth has slowed down, so adding to the forces that slow growth in incomes and taxes.
Trends in government revenue, expenditure and borrowing

Source: IMF World Economic Outlook and Investec Wealth & Investment
The GDP growth rate picked up in Q2 2019. But GDP is only up 1% on the year before while in current prices, it has increased by only 4.4%. That is slower nominal growth than at any time since the pre-inflationary 1960s, which is not at all helpful in reducing debt to GDP ratios (something of great concern to the credit rating agencies). This 4.4% growth is a mixture of the slow real growth and very low GDP inflation, now only about 3.5% a year.
Annual percentage growth in real and nominal GDP

Source: Stats SA, Investec Wealth & Investment
GDP and CPI inflation

Source: Stats SA, Investec Wealth & Investment
In the first four months of the SA fiscal year (2019-2020) personal income tax collected grew by an imposing 9.7% or an extra R14bn compared to the same period of the previous financial year. Higher revenues from individual taxpayers was the result of effectively higher income tax rates, so-called bracket creeps, on pre-tax incomes that rise with inflation.
Income tax collected from companies, however, stagnated, while very little extra revenue was collected from taxes on expenditure. Lower disposable incomes resulted in less spending by households and the firms that supply them. The confidence of most households in their prospects for higher (after-tax) incomes in the future has been understandably impaired.
Treasury informs us that total tax revenue this fiscal year, despite higher income tax collected, is up by only 4.8%, compared to the same period a year ago, while government spending has grown up by 10.3%, or over R51bn. The much wider Budget deficit of R33bn (Spending of R156.6bn and revenue of R123.6bn) represents anything but fiscal austerity. It has added to total spending in the economy, up by a welcome over 3% in Q2 2019 – after inflation.
But deficits of this order of magnitude are not sustainable. Nor can they be closed by higher income and other tax rates that would continue to bear down on the growth prospects of the economy and the tax revenues it generates. A sharp slowdown in the growth of spending by government, combined with the sale of loss-making and cash-absorbing government enterprises is urgently called for if a debt trap is to be avoided. Given that the debts SA has issued are mostly repayable in rand, rands that we can print an infinite amount of, a trip to the IMF and the “Ts and Cs” they might impose on our profligacy is unlikely.
More likely is a trip to the printing press of the central bank rather than the capital markets to fund expenditure. Such inflationary prospects are fully reflected in the interest we have to pay to fund our deficits. These interest payments add significantly to government spending. The spread between what the SA government has to offer lenders and those offered by other sovereign borrowers has been widening.
The SA government now has to pay 8.7 percentage points a year more in rands than the average developed market borrower, ex the US (Germany and Japan included) and 7.6 percentage points a year more than the US has to offer for long-term loans. We also have to pay 3.1 percentage points a year more than the average emerging market borrower has to pay to borrow in their own currencies.

7 August 2019
Déjà vu all over again - making sense of the recent rand weakness
The wise thing for the SA Reserve Bank to do is to leave the exchange rate to find its own level, while basing its interest rates decisions on the outlook for the domestic economy.
Professor Brian Kantor / Chief economist and strategist, Investec Wealth & Investment
The famous phrase by Yogi Berra, “It’s déjà vu all over again,” does not quite do justice to the recent turmoil in the SA currency and debt markets. The hope for a weaker dollar and stronger rand, as well as the lower interest rates, inflation, and faster growth that comes with a stronger rand, has once more been dashed.
Trade wars and currency manipulation do less damage to the US economy than to others, simply because the US is less dependent on global trade and more dependent on the US consumer. Hence in times of trouble, capital flows towards the US, raises the exchange value of the US dollar and depresses bond yields. Emerging market exchange rates weaken more than most and emerging market bond yields rise. The rand generally falls more than most other emerging market currencies.
Funding government debt has become more expensive, even as the volume of debt to fund extraordinary spending on Eskom increases at a very rapid rate. Long-dated SA government-issued (RSA) debt now offers an extra 8% over US Treasury bonds and almost as much extra when compared to other developed market issuers (many of whom now borrow at negative interest rates). SA is now paying 3% more than the average emerging market on its debt (in their domestic currencies).
For the government, raising US dollars has also become more expensive. Raising five-year dollar-denominated debt now requires an extra 0.4 percentage points (40 basis points) more than it did in early July 2019. The cost of insuring RSA foreign-currency debt against default has risen similarly and more than it has for other emerging market borrowers.
Sovereign risk spreads for RSA and other US dollar-denominated debt

Source: Bloomberg, Investec Wealth & Investment
The rand moreover has performed particularly poorly when compared to other commodity and emerging market exchange rates. Since early July, the rand is about 6% down vs the US dollar, 3% down on the Chinese yuan and about 2% weaker vs the Aussie dollar and a basket of nine other emerging market currencies.
The USD/ZAR compared to the yuan and Aussie dollar (1 July = 1)

Source Bloomberg, Investec Wealth & Investment
The USD/ZAR vs an equally weighted basket of nine emerging market exchange rates

Source Bloomberg, Investec Wealth & Investment
The cost of buying dollars for forward delivery has thus also widened, as has the compensation for bearing inflation risk in the RSA bond market. Both spreads are now over 6% for 10-year contracts. The attempts by the Reserve Bank to reduce inflation expected, by containing inflation itself (now about 4.5%, an outcome achieved by depressing domestic spending), have accordingly failed.
The RSA bond market interest rate carry and inflation compensation. July- August 2019 (10 year yields)

Source: Bloomberg, Investec Wealth & Investment
It should be recognised that the relative weakness in the rand and RSA bonds actually preceded the impact of the latest Trump tantrum. The Trump tariff threats came only at month-end. The earlier attacks of the Public Protector Mkhwebane on President Ramaphosa moved the market ahead of Trump.
What then can be done to mitigate this volatility and the damage it causes to the SA economy? The Reserve Bank cannot hope to anticipate exchange rate volatility with any degree of accuracy, or impose higher interest rates that offer no defense for the rand; they can only depress demand and growth further. The wise thing to do would be to leave the exchange rate to find its own level and accept higher inflation or the expectation of higher inflation that might follow (and which can easily reverse). The case for cutting or raising interest rates should be made only on the outlook for the domestic economy, which has not been improved by recent global events.
The Reserve Bank has called correctly for structural reform of the kind the President and his cabinet has responsibility for. It demands reforms so that SA can avoid the debt trap that Eskom has lead us into. Any confident sense that SA can address its structural weaknesses will bring immediate reward, in the form of lower interest rates and lower expectations of inflation.
There is some consolation in recent events. The oil price in rands is no higher than it was. It would have been more comfortable had SA still been producing gold on something like the scale of previous years. A mining charter that revives the case for investing in SA mining, would be a confidence booster.
Brent oil rands per barrel

Source: SA Reserve Bank, Bloomberg, Investec Wealth & Investment
All rates and percentages as at 6 August 2019.

26 July 2019
An unpredictable rand calls for better judgment, not luck
The rand (USD/ZAR) has not been a one-way road for currency traders and investors. Despite this, we are more likely to see US dollars being added to SA-held portfolios when they are expensive, rather than when the rand has recovered. Blindly following recent momentum in exchange rates or share prices is not to be recommended.
Professor Brian Kantor / Chief economist and strategist, Investec Wealth & Investment
The rand cost of a dollar doubled between January 2000 and January 2002 – but had recovered these losses by early 2005. The rand weakened during the financial crisis, but by mid-2011 was back more or less where it had been in early 2000.
A period of consistent rand weakness followed between 2012 and 2016 and a dollar cost nearly R17 in early 2016. A sharp rand recovery then ensued and the rand was back to R11.60 in early 2018. Further weakness occurred in 2018 and the rand has been trading between R15 and R14 since late 2018 – weaker but still well ahead of its exchange value in 2016.
In March 2019, the rand had lost about 20% of its dollar value from a year before. It has recovered strongly since and on 5 July, at R14.05, the rand was a mere 4% weaker than a year before. It has subsequently firmed even further.

Source: SA Reserve Bank, Bloomberg, Investec Wealth & Investment
Two forces can explain the exchange value of the rand. The first, the direction of all other emerging market currencies. The rand behaves consistently in line with other emerging market (EM) currencies. They generally weaken against the US dollar when the latter is strong, compared to its own developed market currency peers.
When the rand weakens or strengthens against other EM currencies, it does so for reasons that are specific to SA, such as the sacking of Finance Ministers Nhlanhla Nene in December 2015 and Pravin Gordhan in March 2017. These decisions (that made SA a riskier economy), can easily be identified by a higher ratio of the exchange value of the rand to that of an EM basket of currencies.
The reappointment of Gordhan as minister of finance in late December 2015 improved the relative (EM) value of the rand by as much as 25% through the course of 2016. His subsequent sacking in March 2017 brought about 15% of relative rand underperformance. The early signs of “Ramaphoria” were worth some 15% of relative rand outperformance – and its subsequent waning can also be noticed in
an increase in the ratio of the rand to EMs.

Source: Bloomberg, Investec Wealth & Investment
This ratio – higher numbers indicate relative rand weakness – is back to its level of early 2019. The rand has had periods of relative (to other EM currencies) weakness this year but has gained about 6% against the EM basket since late June 2019.
EM credit spreads have also receded recently – as have the spreads on RSA dollar denominated debt. The cost of insuring an RSA five-year dollar-denominated bond against default has fallen recently to 1.59% from 2.2% earlier in the year. This has taken RSA dollar-denominated debt into the equivalent of investment grade debt.

Source: Bloomberg, Investec Wealth & Investment
The USD/ZAR exchange rate (currently around R14) is very close to its value as predicted by other EM exchange rates and the RSA sovereign risk spread. It would appear now to have as much chance of strengthening or weakening.
As always, the performance of the US dollar against its developed market peers (euro, yen, sterling and the Swiss franc) will be crucial for the USD/EM exchange rates, including the rand.
The recent performance of the US dollar vs the peer group is shown below. No obvious trend has been revealed recently. A higher value for the dollar index (DXY) indicates dollar strength.

Source: Bloomberg, Investec Wealth & Investment
The USD/ZAR exchange rate leads consumer prices in SA because of its influence on the rand prices of imports and exports that influence all other prices in SA.
A weak rand usually means more inflation, and given the Reserve Bank’s devotion to inflation targets, the exchange rate leads the direction of interest rates.
Despite a renewed bout of dollar strength and rand weakness in 2018, import price inflation – about 6% in early 2019 – has remained highly subdued.

Source: SA Reserve Bank, Bloomberg, Investec Wealth & Investment
This has helped to subdue the impact of rand weakness against the US dollar that might otherwise have brought higher interest rates and even more depressed domestic spending.
The dollar prices of the goods and services imported by South Africans has fallen by 20% since 2010 and by more than 10% since early 2018. This has been a lucky deflationary break for the SA economy.

Source: SA Reserve Bank, Bloomberg, Investec Wealth & Investment
Given that the rand is driven by global and political forces largely beyond the influence of interest rates, it would be wise for the Reserve Bank to ignore the exchange value of the rand and its consequences.
It should allow flexible exchange rates to act as an economic shock absorber rather than attenuating the shocks that come from a volatile US dollar.
It should set interest rates to prevent domestic demand from adding to or reducing the pressure on prices that comes from the import supply side. The SA economy can do better than merely hope for a weak dollar.

12 June 2019
The Naspers restructuring – what it means for shareholders
The Naspers value gap (net asset value less market value) has narrowed significantly since the restructuring - which will see a Newco being listed in Amsterdam - was announced to the market. What does this mean for shareholders?
Professor Brian Kantor / Chief economist and strategist, Investec Wealth & Investment
The proposed restructuring of Naspers, first mooted in March and now confirmed in a circular to shareholders on 29 May, has been favourably received by the market. The intention is to restructure Naspers into two linked companies: a Newco (to be named), with a primary listing in Amsterdam and a secondary listing on the JSE, and a new Naspers with its primary listing still in South Africa.
The Newco will hold the international assets of Naspers, including its 31% of Tencent, and will focus on global opportunities. The South African Naspers will have a 73% share of the Newco, will hold the local assets of Naspers and will also pursue investment opportunities – presumably mostly in South Africa.
The Naspers share price has outperformed that of Tencent recently.
Naspers shareholders in absolute terms were, at the start of June, about R120bn better off than they were three weeks previously, according to calculations by my colleague Thane Duff of Investec Wealth & Investment. The Naspers share price has outperformed that of Tencent recently.
To explain, the large gap between the net asset value (NAV) of Naspers (the sum of its parts of which the holding in Tencent dwarfs all the others) and the market value of Naspers (now R1.462 trillion rand) has narrowed by as much as R120bn in recent weeks.
This value gap (NAV less market value – which we can describe as the difference in the value of Naspers were all its assets unbundled to shareholders and its value as an ongoing business) however, remains a considerable R386bn. The value of the Naspers holding in Tencent is currently worth 127% of the market value of Naspers – or as much as R1.85 trillion.
This value gap emerged only in 2015, with the appointment (coincidentally?) of Bob van Dijk as CEO. The value gap has been as much as R800 billion since then and is now close to its post-2015 low. Its further direction will be of crucial importance to shareholders and, one hopes, also the senior managers of Naspers who control its destiny through the high voting shares they own.
Figure 1: Naspers – NAV minus market value (R billion)

Source: Investec Wealth & Investment
How does one best explain this value gap and how will it evolve in the future under the new listings and the revised jurisdiction of the company?
The NAV and market value of Naspers have much in common. Common to both is the market value of the listed assets it owns (Tencent and MailRu being the most important). Also common is the value accorded to the unlisted assets of Naspers, though the value ascribed to these unlisted assets by the directors and included in the balance sheet may well be greater than the value accorded them by the market.
This could be one reason why NAV exceeds market value. What will not be recorded in the Naspers balance sheet or in NAV, but will affect the market value, is the expected cost of running the Naspers head office, as assumed by investors and potential investors. The more shareholders are expected to pay management for their services in the future – including the extra shares to be issued to managers that will dilute their share of the company – the less Naspers shares will be worth today.
A further force that can add to or subtract from the value of a company is the expected value to its shareholders of the business that the company is expected to undertake in the future. The more profitable the investment programme of a company is expected to be, the more value a company will offer its shareholders. Profit in the true economic senses means the difference between the internal rate of return on shareholder capital invested by the firm and its opportunity cost, that is, the returns its shareholders could expect from similarly risky investments made with its capital when invested outside the company. It is the economic, not the accounting profit earned after allowing for the cost of utilising equity as well as debt capital, that matters for the market value.
This cost of their capital for SA shareholders – or the required return on the capital they have entrusted to Naspers – is of the order of 14% a year. This 14% is equivalent to the returns currently available to wealth owners in the RSA bond market (about 9% a year for a 10-year bond) plus a premium, to compensate for the risks that these returns may not be met from the averagely risky SA company.
The extra return for risk is described as the equity risk premium and may be assumed to be of the order of 5% a year.
If Naspers were expected to achieve consistent returns of more than 14% on the large capital investments it makes every year, this programme could be expected to add to its market value. If the market expected otherwise, where the returns on the investments would fall short of their costs, then the investment programme would be expected to destroy the wealth of shareholders. And the more Naspers was expected to invest, the more value destruction would be reflected in its share price: that is, the larger the difference between NAV and market value would become.
We draw on the Credit-Suisse-Holt database for estimates of the recent investment activity of Naspers. The sums invested are large in absolute terms as may be seen in figure 2 below: they’re estimated as of the order of R200bn per annum in recent years. Holt also estimates a currently negative return on capital invested by Naspers – that is, a negative cash flow return on investment (CFROI). If the estimate of the scale of the Naspers is correct, then the investment programme is large enough to account for a large reduction in its market value accorded by a sceptical share market.
The recent sale by Naspers of 2% of its Tencent holding realised nearly US$10 billion. A large additional war chest it must be agreed, but not perhaps enough to result in as much value destruction of the order recently observed.
It suggests that shareholders also attach significant costs to them of the rewards expected to be awarded to managers – perhaps particularly in the form of share issues and options – that over time can consistently dilute their share of the company. If the number of shares issued as remuneration amounts every year to as much as 1% of the shares in issue, this becomes an expensive exercise for shareholders.
Figure 2: Naspers – gross investment

Source: Holt and Investec Wealth & Investment
Will the future be much different for Naspers shareholders?
The critical issue for shareholders in the restructured Naspers remains as before. How successful – how economic value adding or destroying – will its investment programme become, and how generous will the company be to its managers?
There seems little likelihood of much change in behaviour of either kind that would cause investors to change their assumptions about Naspers. The managers are unlikely to become less ambitious in their search for game-changing investments of the kind it made in Tencent. But it will soon be doing so out of two highly interlocked companies.
The international assets (including the Tencent stake) will be held by the Amsterdam-listed company, of which the South African company will own 73%, and not less than 70% in the future.
The international investment activities will presumably be conducted out of Amsterdam. The South African company will also have an investment programme of its own, presumably in South African and African opportunities. One imagines, however, that the larger investments bets will be made internationally by the Amsterdam-listed company, given the much larger opportunity set. Dividends (largely from Tencent) that flow out of Amsterdam back to South Africa will presumably be influenced by the scale of this investment programme.
One anticipates that both companies will not easily convince investors that they are capable of undertaking enough value-adding investments to compensate for the cost of management. Therefore, the Naspers shares will be priced lower (to compensate for value destruction and head office costs) for an expected return in line with market averages. Given a lower than otherwise share price for both companies, both are likely to stand at a discount to NAV and should continue to offer a value gap of significance.
Yet the Amsterdam company will also be priced to offer a market-related return for a company listed in Amsterdam and, under the jurisdiction of the Netherlands, a developed economy. The owners of the 27% free float in the new Amsterdam company will accordingly attach a lower real discount rate to the expected benefits of their share of the company. They will be satisfied with lower expected nominal and real returns, because they will attach less risk to doing business with the government of the Netherlands than with the SA government.
The lower returns required of a company in the Netherlands will be equivalent to the yield on a Netherlands government bond (close to zero, even negative) plus the same 5% risk premium. This makes for a required nominal return of 5% rather than the 14% required of a South African-listed company, where inflation is expected to be much higher and the sovereign risk premium is higher.
The important difference in real expected returns (returns adjusted for expected inflation) is an expected average real 5% in the Netherlands (given no expected inflation, only a risk premium) and a real return in South Africa of about 3% higher (8% real return expected from the average South African company). This 8% real is the equivalent of the 14% nominal required return, less the 6% inflation rate expected in South Africa.
This lower real discount rate makes Naspers shares worth more in Amsterdam than they would be worth in South Africa (all else remaining unchanged) and also worth more for shareholders in Naspers South Africa with their Amsterdam investment.
Perhaps it is this recognition that has already added value to Naspers for all its current shareholders.
But all else will not remain the same, including the market value of Tencent shares. This will still be the main force driving the value of the Naspers companies. What could change the game for shareholders – and help further lower the gap between NAV and market value – would be for the company to reward its managers on their ability to close this value gap. That surely would align the interest of managers and shareholders and therefore add value.

17 April 2019
The paradox of paid holidays
Looking forward to your (paid) public holidays? Despite appearances to the contrary, you are paying for it.
Professor Brian Kantor / Chief economist and strategist, Investec Wealth & Investment
The Easter holidays are upon us. Many will be enthusiastically taking time off, believing they will be enjoying a “paid holiday”, in other words, enjoying a holiday paid for by their ever-obliging employers. They are wrong about this – especially if they work in the private sector. They will in fact be sacrificing salary or wages for the time they spend not working.
This is based on the simple assumption that there is a consistent relationship between the value they add for their employers and the hours or days spent working – and that therefore they are paid according to the contribution they are expected to make to the output and profitability of the firm. Wages are not typically charitable contributions.
It makes no sense for some employer, the owner of a business, with a natural concern for the bottom line, to pay you for time spent on holiday, or on weekends off or when sleeping or traveling to or from work. They are unlikely to survive the competition if they did not take into account the accompanying loss of production, revenue and profits incurred when their employees are not working.
There are no paid holidays, any more than there are free lunches in the company canteen.
Those known costs must mean salaries, wages and employment benefits given up by the worker. There are no paid holidays, any more than there are free lunches in the company canteen.
Those paid on an hourly basis and at the end of every day or week will be under no illusions about having to sacrifice income when not working. Many of them might well be willing to work on the Easter weekend if given the opportunity to do so. They may well prefer to consume goods and services other than leisure.
It is those who are paid on a pre-determined monthly basis who may be inclined to believe that they are being paid to go on holiday. They should appreciate that the more time they are expected to take off, or the larger the contributions the employer may be making to medical insurance or pension contributions, training levies and the like, the less they will inevitably be taking home in their monthly paycheque. They are sacrificing salaries so that their employers can better stay in business and offer them employment.
The same bottom line and hence a sense of sacrificing pay may not apply in anything like the same force in the public sector, where the taxpayer picks up the salary, pension and medical aid bill, regardless of its size; where measuring the output of the public employees is not nearly as easy and where performance measures are often strenuously resisted.
European workers typically take many more days off than their US or South African counterparts. It is a widening trend that has evolved only over the past 30 or so years. We are often surprised at how little time the typical US worker takes off. Why is it so that the average US worker consumes significantly less leisure, takes less time off, therefore sacrifices less pay for holidays and consumes proportionately more other stuff that they prefer to pay for?
Is it a cultural difference, or are US workers naturally more hard working than their European or South African cousins? Maybe, but if that’s the case, why have these differences in working behaviour become so much more pronounced in recent decades? (Incidentally, the average number of hours worked per day in Europe and the US does not differ much). The striking difference is in the average number of days worked.
It may be because US workers and their employers enjoy more freedom to choose pay over leisure. Perhaps the regulations that determine compulsory time off for holidays or festivals are by now less onerous on US than European employers (and on formal South African businesses).
Were maximising output and money income and employment the primary objective of policy, South Africa would be wise to adopt the US rather than the European practice: allow the number of days off to evolve (mostly) out of competition for workers, rather than be regulated for them and their employers. And have fewer “paid holidays”.

19 February 2019
Naspers and the balance of payments
Naspers has done well as an investment for South African-based investors. But the picture for the balance of payments is a little different.
Professor Brian Kantor / Chief economist and strategist, Investec Wealth & Investment
There’s been an interesting development when it comes to foreign and local investor flows in recent years: the market value of assets held abroad by South Africans as direct investments and in portfolios offshore (R5.7 trillion at 2017 year-end) now closely matches the value of SA assets owned by foreigners (see figure 1).
Figure 1: South African foreign assets and liabilities (R millions)

Source: South African Reserve Bank Data Base (Reference numbers indicated) and Investec Wealth & Investment
That our foreign assets are as valuable as our foreign liabilities, is especially pleasing given that South Africans have had to give up so much of their patrimony over recent years to fund the excess of their spending over their incomes. Such financing opportunities provided by foreign savers have come with a cost to South Africans. It has meant giving up a share of the companies they own and incurring more debt to foreigners.
Yet despite the extra debt South African taxpayers have incurred over the years and the assets sold to foreign investors, (the cumulative R5.7 trillion rand between 2000 and 2017 according to the Financial Accounts, referred to above), we appear no less (net) asset rich than we were.
What is perhaps less pleasing is that South Africans still pay out far more in interest and dividends to foreign share- and debt-holders than they receive from their foreign investments: about R160bn more was paid out in 2018 to foreign holders of SA assets than was received by South Africans on their foreign portfolios (see figure 2).
Figure 2: Payments to foreign investors in SA and receipts from assets owned by South Africans abroad (R million)

Figure 3: South African balance of payments – net investment income

Source: South African Reserve Bank and Investec Wealth & Investment
This R160bn net dividend and interest payments abroad formed a large part of the current account deficit on the balance of payments in 2018. The trade account of the balance of payments has been in rough balance (see figure 4).
Figure 4: The SA balance of payments – trade and current account balances (R million, quarterly data)

Source: South African Reserve Bank and Investec Wealth & Investment
Given the equivalent value of the assets and liabilities on the SA balance sheet, it follows that the running yield on the SA portfolio held abroad must be significantly lower than the yield received in dividends and interest by foreign investors in SA. The yield earned by foreign investors in SA is of the order of 5% a year, while the SA portfolio held abroad has a yield of only about 1%. It’s worth noting that in 2005 and 2006, when the SA economy was growing strongly, the two respective yields were about the same. Since then, after a brief interruption caused by the Global Financial Crisis of 2008-09, the yield on SA assets held by foreign investors has stabilised at the 5% rate, while the yield on the SA offshore portfolio has remained at about the lower 1% rate.
Yield can be paid effectively out of the capital that is expected to have a short life. Or, to put it another way, high yields (as we saw in the troubled early 1990s) may be regarded as a way of repaying capital that is not expected to have a long economic life (see figure 5).
By contrast, when the outlook for capital growth is more promising, the current yield can be postponed in exchange for capital growth. The low yield of only 1% a year realised on foreign assets owned by South Africans, indicates that they must be hopeful of significant capital gains on their offshore investments, enough to make up for the low initial yield.
Figure 5: Average yield on foreign-owned SA assets and assets owned abroad by South Africans

Source: South African Reserve Bank and Investec Wealth & Investment
(Note on figure 5: Income from direct plus indirect (portfolio) investments is compared to the value of direct and indirect investments to establish yield)
What Naspers and Tencent mean to the balance of payments
This brings us to the role of Naspers. Any appreciation of the SA balance of payments and the mix of SA foreign assets and liabilities must have full regard to the role played by Naspers. Years ago, Naspers made a direct investment in Tencent, a subsequently fabulously successful Chinese internet company with a listing in Hong Kong.
Any appreciation of the SA balance of payments and the mix of SA foreign assets and liabilities must have full regard to the role played by Naspers.
In the listing of foreign assets owned by South Africans by country, total direct investment by South Africans in China in 2017 was recorded as R2.041 trillion. Almost all of this must represent the value of the shares held in Tencent by Naspers. This valuation was equivalent to 36% of all the direct and portfolio investments held abroad by South Africans on 31 December 2017.
The dividends paid by Tencent have grown strongly over the years but its share price has increased even more rapidly, reducing the dividend yield to shareholders and so also the average yield on SA investments made abroad. The dividend yield on a Tencent share is currently a mere 0.25%.
Had South Africans been willing to sell more of their Naspers shares to foreign investors and invested the proceeds in higher-yielding alternatives offshore, the balance of payments would have looked better. The economy might have accordingly been regarded as less fragile – less exposed to the withdrawal of foreign capital on which it heavily depends. But the total returns earned by South African shareholders (minus Naspers) would have been a lot lower.
Exchanging the prospect of capital gains in Naspers for lower yield by holding on (in part) to their Naspers shares has served South African investors well. It has not been as obviously beneficial to the balance of payments flows. The balance sheet has performed much better than the income statement.
There is a further implication of the Naspers success story. The value of the investment in Tencent by a company under South African jurisdiction is a national asset of macro-economic significance. It is most unlikely that the control of such a highly valuable asset would be allowed to migrate away. Hence a secondary listing of Naspers abroad could serve shareholders and the national interest.

7 December 2018
The market rules OK?
Global financial markets are reacting to two forces at work in the US. One concerns what Fed Chairman Jerome Powell might do to the US economy with interest rates and the other concerns what President Donald Trump might do to the Chinese economy with tariffs.
Professor Brian Kantor / Chief economist and strategist, Investec Wealth & Investment
Interest rates set by the Fed might or might not prove helpful for the US economy, given their unknown future path. It is not the President but market forces that are restraining interest rate increases in the US.
It is the US bond market itself that has eliminated any rational basis for the Fed to raise short-term interest rates. Should the Fed pursue any aggressive intent with its own lending and borrowing rates, interest rates in the US marketplace, beyond the very shortest rates, are likely to fall.
It is not the President but market forces that are restraining interest rate increases in the US.
Hence the cost of funding US corporations that typically borrow at fixed rates for three or more years and the cost of funding a home that is mostly fixed for 20 years or more, would likely fall (and so make credit cheaper).
The term structure of interest rates in the US has become ever flatter over the past few months. The difference between 10-year and two-year interest rates offered by the US Treasury has narrowed sharply. 10-year loans now yield only fractionally more (0.13 percentage points as at 5 December) than two-year loans (see figure 1).
This difference in the cost of a short-term and long-term loan could easily turn negative (longer-term interest rates falling below short rates, should the Fed persist with raising its rates). It is unlikely to do so beyond the 0.25 percentage point increase widely expected in December, for term structure reasons.
The US capital market is not expecting interest rates to rise from current levels in the future. Given the opportunity to borrow or lend for shorter or longer periods at pre-determined fixed rates, the longer term rate will be the average of the short rates expected over the longer period. Lending for two years at a fixed rate must be expected to return as much as would a one year loan (renegotiated for a further year at prevailing rates). Otherwise, money would move from the longer to the shorter end of the yield curve.
By interpolation of the US Treasury yield curve, the interest rate expected to be paid or earned in the US for a one-year loan in five years’ time has stabilised at about 3.2% or only about 0.5 percentage points more than the current one-year rate. These modest expectations should be comforting to investors. They are not expectations with which the Fed can easily argue- for fear of sending interest rates lower not higher.
The market believes that interest rates will not move much higher because market forces will not act that way. Increased demand for loans at current interest rates are not expected to materialise. They are considered unlikely because real growth in the US is not expected to gain further momentum and is more likely to slow down from its recent peak rate of growth. Furthermore, given the outlook for real growth, inflation is unlikely to pick up momentum, for which lenders would demand upfront compensation in the form of higher yields.
The more important known unknown for the market will be Donald Trump and his economic relationship with the rest of the world.
The market, of course, might change its collective mind – redirecting the yield curve steeper or shallower. This, in turn, would give the Fed more or less reason to intervene helpfully. Interest rate settings should not unsettle the marketplace. They are very likely to be pro-cyclical.
But the more important known unknown for the market will be Donald Trump and his economic relationship with the rest of the world. Perhaps Trump himself can also be helpfully constrained by the marketplace. The approval of the marketplace would surely help his re-election prospects.
View the graphs relevant to this article

12 October 2018
An economist's welcome for the new Minister of Finance
Tito Mboweni faces many challenges, but there is some encouragement in the form of some up-to-date indicators of the state of the economy
Professor Brian Kantor / Chief economist and strategist, Investec Wealth & Investment
Consolation and encouragement from the Hard Number Indicator
When our newly appointed Minister of Finance, Tito Mboweni, presents his update on the finances of the state later this month he will have little alternative but to look through the rear view mirror. Total output and incomes (GDP) and the balance of payments – crucial information for the Budget - will have been estimated only up to June 2018 and will be revised. The coinciding business cycle, which is a good proxy for GDP, calculated and published on a monthly basis by the SA Reserve Bank (SARB), is as out of date as the GDP figure.
The consumer price index (CPI) for September will be out by the time he presents the Medium Term Budget Policy Statement (MTBPS) on 24 October. He must hope that the misanthropes at the SARB do not regard possibly higher inflation, in the wake of the weaker rand and the higher petrol price, both obvious negative supply-side shocks to economic growth, as a reason to hike interest rates. That would further depress growth in spending, GDP and tax collections without altering the path of inflation in any predictable way.
Promising market reaction
Mboweni can take consolation from the market reaction to his appointment. The rand immediately strengthened on the news – not only against the US dollar – by a percent or two against the currencies of our emerging market peers. Alas, global economic developments a day after his appointment – pessimism about global and especially emerging market economic prospects – weakened the rand against the US dollar and undid the good news.
A stronger rand can reduce inflation and, if it is sustained, reduce the compensation for inflation, and accompanying expected rand weakness, priced into the high interest rates SA has to pay. Inflation expected is of the stubborn order of about 6%.
Our new minister will hopefully recognise that raising tax rates to close the gap between government expenditure and revenue is a large part of the problem of, rather than the solution to, South Africa’s stagnation. Perhaps he will report progress being made in private-public partnerships (alias privatisation) in taking assets and liabilities (actual and contingent) and interest payments off the Budget, now running at over 11% of all government expenditure and likely to increase further.
Encouragement from the hard numbers
I can offer the minister a little encouragement derived from some very up to date indicators of the current (September) state of the economy. These come from new vehicle sales and the supply of cash issued by the SARB in September. These are actual hard numbers and do not depend on sample surveys that take time to collect and collate. These two hard numbers are combined to provide a Hard Number Indicator (HNI) of the state of the economy. It does a good job anticipating the turning points in the SA business cycle (see figures 1 and 2 in link at bottom of page).
If current trends in new vehicle sales and the demand and supply of cash persist, the HNI is pointing to positive real GDP growth possibly of 3%, over the next 12 months.
Current sales of new vehicles are running at an annual rate of 551,000 new units sold, forecast to rise modestly to an annual equivalent of 570,000 units in 12 months. The demand for cash is, however, suggesting more impetus for growth. It is recovering quite strongly and is expected to grow at a 7% rate in 2019 and when adjusted for consumer prices to rise to at a near 4% real rate in 2019 (see figure 3).
What moreover does this growing demand for old-fashioned notes and coins say about the SA economy, given all the electronic alternatives to cash? It suggests that much economic activity is not being recorded in GDP. Raising the contribution made by the unrecorded economy to the GDP figures is a move long overdue. It would improve all the critical ratios by which our economy is judged.
We economy watchers and the Treasury must hope that this growth in the demand for and supply of cash – so indicative of spending growth – continues to run ahead of inflation.
View the graphs relevant to this article
Receive Focus insights straight to your inbox
Investec products you may be interested in

My Investments
Get online access to a digital investment platform backed by Investec’s global active investment expertise.
Wealth management

Retirement Investments
My Investments
Get online access to a digital investment platform backed by Investec’s global active investment expertise.
Wealth management
Retirement Investments
Browse further in