Receive Focus insights straight to your inbox
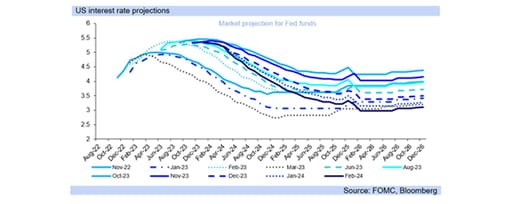
The FOMC (Federal Open Market Committee) left the federal funds target rate unchanged at 5.25% - 5.50% as expected, highlighting “inflation is still too high, ongoing progress in bringing it down is not assured, and the path forward is uncertain.”
The Fed did note “inflation has eased from its highs without a significant increase in unemployment. That is very good news. But inflation is still too high ... Restoring price stability is essential.”
“Our restrictive stance of monetary policy is putting downward pressure on economic activity and inflation. Over the past two years, we have raised our policy rate by 5-1/4 percentage points.”
The rapid tightening of the US interest rate cycle has been felt, with the housing market seeing subdued activity levels over the past year on high mortgage rates, and elevated borrowing costs also suppressing business fixed investment.
The FOMC did highlight “we believe that our policy rate is likely at its peak for this tightening cycle and that, if the economy evolves broadly as expected, it will likely be appropriate to begin dialing back policy restraint at some point this year.”
“But the economy has surprised forecasters in many ways since the pandemic, and ongoing progress toward our 2 percent inflation objective is not assured.” The tone of the Fed is cautious, not dovish, but has become markedly less hawkish.
The rand strengthened slightly to R18.57USD in response, but has retraced today to R18.73USD, with markets having centered on May as the first rate cut, but will digest the FOMC statement in the remainder of this week.
The market expectations for the first FOMC cut are unlikely to change materially, i.e. be brought forward to the next (March 20) meeting, although US data releases in the interim will remain key for markets.
The Fed also notes “we are prepared to maintain the current target range for the federal funds rate for longer, if appropriate”, placing a quelling tone on market exuberance and seeking to prevent early rate cut expectations.
Consequently warning “that reducing policy restraint too soon or too much could result in a reversal of the progress we have seen on inflation and ultimately require even tighter policy to get inflation back to 2 percent.”
“The Committee does not expect it will be appropriate to reduce the target range until it has gained greater confidence that inflation is moving sustainably toward 2 percent. We will continue to make our decisions meeting by meeting”.
It remains likely the FOMC will not cut its interest rates before May at the earliest, potentially rather at its June meeting, and for SA the SARB is unlikely to cut before July, with the FRA (Forward Rate Agreement) curve aligned to a July cut (all -25bp).

CPI update: inflation subsides to 5.1% y/y
24 January 2023
The fuel price had a moderating effect, with the petrol price dropping 65c/litre in December, along with private vehicle operation costs

CPI inflation dropped, to 5.1% y/y (0.0% m/m) in December, from 5.5% y/y % in November, slightly below the Bloomberg market consensus of 5.2% y/y.
The fuel price had a moderating effect, with the petrol price dropping 65c/litre in December, along with private vehicle operation costs, and the transport category contributed -0.1% m/m alone to the flat (0.0% m/m) CPI outcome.
Food and non-alcoholic beverage prices did not contribute (0.0% m/m) to the inflation outcome. International (US dollar) agricultural food commodities prices fell by -3.1% m/m in December (Economist commodities index) while the rand saw only fractional weakness of 0.4% m/m against the US dollar.
The overall food (and non-alcoholic beverages) inflation rate came out at 8.5% y/y, from 9.0% y/y in December. Food (and non-alcoholic beverages) prices contributed over a quarter (1.5% y/y) of the overall CPI inflation rate (of 5.1% y/y) in December.
Housing and utilities saw a not unusual 0.1% contribution to the m/m CPI outcome, on some upwards price pressure from water costs and rentals, as December was the survey month for these costs.
Core inflation (which excludes food, non-alcoholic beverages fuel and energy prices), remained at 4.5% y/y, showing underlying inflationary pressures are at the midpoint of the target range.
January recorded another petrol price cut, of -76c/litre, which will exert downwards pressure on the inflation outcome, although it is a price increase month, and in addition it suffers from a low base which will elevate inflation. February is currently on course for a small petrol price hike of 40c/litre.
The MPC meets tomorrow to make its interest rate decision, and will likely continue to have a hawkish tone, warning of inflation risks, although on balance is expected to keep interest rates unchanged.
The MPC’s last meeting forecast CPI inflation at 5.0% y/y for 2024 and 4.5% y/y for 2025, and today’s figure is unlikely to change its 2024 view, with the SARB currently targeting inflation in 2024 and 2025.

Trade note: January 2024 sees rising global trade costs
16 January 2023
Global trade growth is expected to be weak in 2024 after 2023’s slowing, and supply chain capacity has already seen a high level of underutilisation
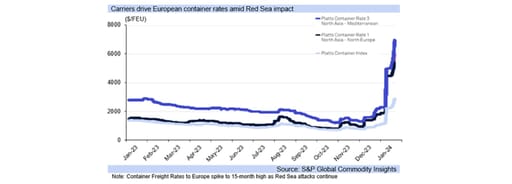
Global trade growth is expected to be weak in 2024 after 2023’s slowing, and supply chain capacity has already seen a high level of underutilisation, although some container freight rates recently rose substantiality as geopolitical tensions escalate.
A slowdown in global trade growth in 2024 would contribute to the weaker outcome for global growth this year, with the escalation in the red sea conflict (particularly Iranian backed groups and the US) a downside risks to an already weaker outlook.
The latest data in the J.P. Morgan Global Manufacturing PMI survey saw a further fall in production in December (the seventh month in a row) as new business fell further (for the eighteenth month), and the pace of contraction overall quickened.
“Job losses were registered for the fourth successive month, with cuts seen in China, the euro area, the US and the UK (among others), while staffing levels were unchanged in Japan.” (J.P. Morgan Global Manufacturing PMI survey).
With the survey adding “price inflationary pressures continued to edge higher in December. Although rates of increase in both input costs and output charges remained relatively mild, they nonetheless accelerated slightly over the month.”
Inflationary concerns have also risen over the jump up in container freight to Europe on the attacks in the Red Sea’s Bab al-Mandab Strait by Yemen’s Houthi faction, lifting global risk aversion, strengthening the US dollar, and so weakening the rand.
The lengthened passage for ships to travel past the Cape of Good Hope instead of the Red Sea has pushed up container freight rates to reportedly fifteen-month highs and creating delays in deliveries as well as adding to port bottlenecks.
The Israeli- Hamas War, and that of Russia and Ukraine, are adding to geopolitical stresses, and concerns over disruptions to trade relations with SA, which is seen to have very cordial relations with Russia, causing some Western concerns.
With Agoa set to be renewed, South Africa is on the list of eligible countries for a ten year extension, but geopolitical tensions have raised concerns over the potential for SA to actually gain renewal, given its stance towards some of the US’s adversaries.

MPC preview: SARB likely to keep rates on hold again
9 January 2023
South Africa’s Reserve Bank (SARB) will decide on its interest rate stance at the MPC meeting on the last Thursday of this month
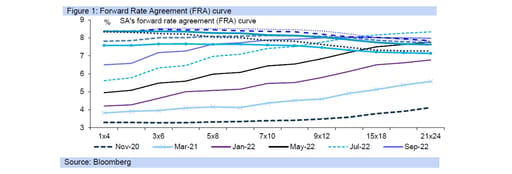
South Africa’s Reserve Bank (SARB) will decide on its interest rate stance at the MPC meeting on the last Thursday of this month, a few days before the FOMC meeting at the end of January.
Both the MPC and the FOMC are expected to leave interest rates unchanged, with the FOMC minutes released last week (for the 13 December 2023 meeting), proving more cautious on the start of the US rate cut cycle than markets were hoping for.
The FOMC minutes highlighted “the importance of maintaining a careful and data-dependent approach to making monetary policy decisions and reaffirmed that it would be appropriate for policy to remain at a restrictive stance for some time.”
Financial markets tend to run ahead on exuberance, and the rand saw some strength early last week, then mild weakness post the FOMC minutes release, but largely traded relatively quietly overall.
The start of the US rate cut cycle is typically positive for investor appetite towards EM portfolio assets, bolstering EM currencies, but investor sentiment towards SA has been negatively affected by domestic issues.
Financial markets have pulled back on expectations of the timing of the first US interest rate cut, from early last week’s view of close to a 75% chance of a 25bp cut in the fed funds rate at the 20 March FOMC meeting, to now around 50%.
Additionally, the previous 100% chance of close to two 25bp interest rate cuts in the US by the 1st of May FOMC meeting, has now dropped to around 87% chance of one. SA market expectations currently do not see a cut in Q1.24.
Instead, SA’s FRA curve factors in at least two 25bp cuts in H2.24. South Africa’s Reserve Bank tends to be on the hawkish side, and will view the CPI inflation rate above 5.0% y/y as a disincentive to any interest rate cuts in SA in the near-term.
The SARB has communicated its determination to see CPI inflation regain the mid-point, of 4.5% y/y, of the inflation target range. The latest print is at 5.5% y/y, and likely to remain above 5.0% y/y until March, only reaching 4.5% y/y in July.
Additionally, risks to the inflation outcome are to the upside, with CPI inflation likely to rise to around 5.8% y/y in January. We continue to forecast South Africa’s first interest rate cut in H2.24.

Inflation note: CPI inflation likely to average 4.5% y/y for 2024
5 January 2023
This year South Africa’s CPI inflation rate is currently likely to come out at 4.5% y/y, the midpoint of the inflation target range, although this average could face upside risks
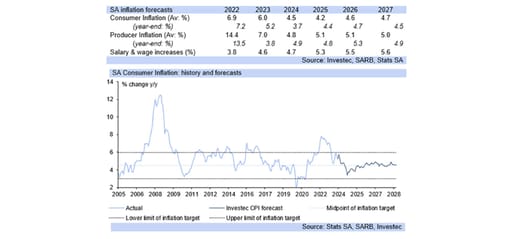
This year South Africa’s CPI inflation rate is currently likely to come out at 4.5% y/y, the midpoint of the inflation target range, although this average could face upside risks, potentially from food prices, a weaker rand and higher global commodity prices.
Specifically, we currently forecast that CPI inflation will reach 4.5% y/y in July this year, dipping to 3.4% y/y in October and moving back towards 4.0% y/y in December on base effects, although the upside risks mentioned could derail this outcome.
An average of 4.5% y/y for 2024, and likely similar for 2025, if not slightly lower (currently the forecast is at 4.2% y/y for 2025), would imply interest rate cuts, with monetary policy increasingly restrictive from mid-Q1.24 without easing rates.
However, given the marked weakness in the rand, which has contributed significantly to higher inflation, South Africa’s MPC (Monetary Policy Committee) would likely favourably view rand strength in order to drive inflation lower.
The rand remains undervalued, over R3.00/USD removed from its fair (PPP) value against the USD. Such substantial weakness has been instrumental in contributing to higher fuel and food costs in SA, amongst other inflationary effects.
Should the US cut interest rates in H1.24, with March currently viewed as the first month this could likely occur, the rand could see some strength as the differential (difference) between US and SA Bank rates widens if SA does not cut.
Inflationary pressures, globally and domestically, are on a general downwards trend, which is adding to expectations of interest rate cuts. This does not mean inflation consistently falls (at every print), but instead in general is tending to decline.
Fuel prices are key for SA’s inflation outcomes, and November’s large R1.78/litre cut in the petrol price helped pull inflation down to 5.5% y/y in November, from 5.9% y/y in October, and December’s -64c/litre cut should aid it lower, to around 5.2% y/y.
While inflation is likely to temporarily return to around 5.8% y/y in January’s outcome for this year, it should drop to near 5.3% y/y in February, and 4.7% y/y in March, as an overall downwards trend is maintained, allowing for interest rates cuts this year.

GDP Update: GDP fell by -0.2% qqsa in Q3.23
5 December 2023
The weak GDP outlook is reflective of the fragile economic environment which continues to be plagued by a number of challenges, predominantly inadequate electricity supply

Headline GDP fell by -0.2% in the third quarter of 2023 when measured on a quarter on quarter seasonally adjusted (qqsa) basis. The outcome which was largely in line with consensus expectations (Bloomberg) follows Q2.23’s modest 0.5% qqsa (revised) lift. Measured on a year-on-year basis GDP contracted by -0.7% in the third quarter.
The weak GDP outlook is reflective of the fragile economic environment which continues to be plagued by a number of challenges, predominantly inadequate electricity supply and significant logistical constraints. Specifically electricity generation is down -6.0% year-to-date (to end September) when compared to the same period last year. Moreover, the N3 truck incidents that took place in July and the week-long Western Cape taxi strike in August will have contributed to the third quarter’s lacklustre growth outcome.
The agricultural sector was the worst performing sector in Q3.23, contracting by -9.6% qqsa and accordingly detracting -0.3 of a % point from the topline outcome. “A decline in output was recorded for field crops, animal products and horticulture products,” according to Stats SA. The agricultural sector continues to face a number of challenges impeding optimal activity, including the declining state of our roads, failing water infrastructure, electricity supply constraints and climate concerns.
Moreover, the mining and quarrying sector contracted by -1.1% qqsa in the third quarter. Indeed, the fragile global environment has weighed heavily on commodity demand, with the World Bank’s metals and minerals index down over -13.0% year-to-date (to end October). Overall, the primary sector of the economy declined by -4.4% qqsa.
The secondary sector of the market contracted by -1.3% qqsa, weighed down by the manufacturing and construction industries which together detracted a further -0.2 of a % point from the GDP outcome. Specifically, manufacturing activity fell by -1.3% qqsa, largely underpinned by the performance of the the food, beverages & tobacco division. Notwithstanding the myriad of domestic challenges, including subdued demand, the fragile global manufacturing environment continues to undermine export potential.
Activity in the construction sector fell by -2.8% qqsa, following a decline of -0.2% qqsa (revised) in Q2.23. “Decreases were reported for residential buildings, non-residential buildings and construction works,” according to Stats SA. The results of the BER’s Q3.23 building survey reveal that confidence amongst builders in the residential segment of the market fell further in the third quarter. Indeed, “the outlook for work deteriorated as based on respondents’ own expectations”.
The tertiary segment of the economy rose by a marginal 0.4% qqsa. The transport, personal services and finance sectors added a combined 0.3 of % point to the headline GDP outcome, on the back of modest growth of 0.9% qqsa, 0.6% qqsa and 0.5% qqsa respectively. Conversely, the trade sector fell by -0.2% qqsa. Although retail trade sales and tourism accommodation figures ticked up in the third quarter, the sector was weighed down by food and beverages, wholesale and motor trade activity.
Similarly, the expenditure approach to measuring GDP yielded an outcome of -0.1% qqsa in Q3.23, following Q2.23’s 0.7% qqsa (revised) lift. Household consumption expenditure, which makes up around two thirds of GDP declined over the quarter, falling by -0.3% qqsa and accordingly detracted -0.2 of a % point from the top line number.
The semi-durables category was the only positive contributor to the HCE reading, while non-durables, durables and services all declined over the quarter. The semi-durables retail category (which includes, clothing and footwear) appears “to be continuing the growth trend that has emerged since the lifting of lockdown restrictions”, according to the BER’s Q3.23 retail survey.
Indeed, the consumer remains highly constrained grappling with the elevated cost of living, while domestic interest rates are projected to remain higher for longer weighing on the indebted. Moreover, the unemployment rate is hovering at a still elevated 31.9%.
Government consumption grew by 0.3% qqsa in the third quarter adding 0.1 of a % point to the overall reading, while gross fixed capital formation (GFCF) declined by -3.4% qqsa, following seven consecutive months of growth and thereby detracted -0.5 of a % point from the quarter’s GDP result. The decrease was underpinned largely by the machinery and other equipment segment, which declined by -3.2% qqsa, (detracting -1.3% points). A notable pick-up in business confidence which slid further into depressed territory in Q4.23 is required to markedly boost investment. Security of electricity supply, a significant improvement in the logistics network, political certainty and an improvement in the ease of doing business are imperative in this regard.
FOMC note: rand gains further as an end to the US rate hike cycle seen supported
2 November 2023
The Federal Open Market Committee once again left the federal funds target rate unchanged as widely expected
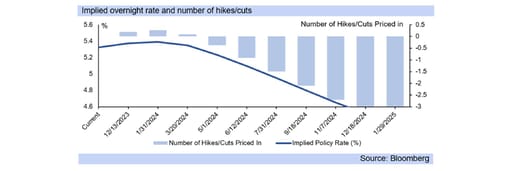
The FOMC (Federal Open Market Committee) once again left the federal funds target rate unchanged at 5.25% - 5.50%, as widely expected, highlighting “the Committee is proceeding carefully” in its monetary policy approach.
The strength of the US economy was evident in the most recent GDP data, where activity levels expanded by 4.9% qqsaa, running above expectations, and against prior expectations some forecasters had of a recession in H2.23.
This is not to say that the effects of the rapid, tightening interest rate cycle have not been felt, with the housing market having flattened out below the levels of a year ago as high mortgage rates temper its momentum.
Business fixed investment has also seen the suppressing effect of higher borrowing costs while the labour market is seeing increasing balance between demand and supply conditions, but is still tight in areas.
Lastly the FOMC noted that inflation still remains above the long-run goal of 2.0%, with the core PCE deflator at 3.7% y/y, although “inflation has moderated since the middle of last year, and readings over the summer were quite favorable”.
However, “a few months of good data are only the beginning of what it will take to build confidence that inflation is moving down sustainably toward our goal. The process of getting inflation sustainably down to 2 percent has a long way to go.”
The rand strengthened to R18.46/USD in response to the outcome, with expectations that the US rate hike cycle has ended underscored, and that 2024 is still likely to see the beginning of the US interest rate cut cycle.
The FOMC next meets to deliver its interest rate decision on the 13th December, and after that at the end of January 2024. Markets have factored in no full expectations of another US rate hike this year, and the potential for cuts are building from Q2.24.
Chair Powell added “despite elevated inflation, longer-term inflation expectations appear to remain well anchored, as reflected in a broad range of surveys of households, businesses, and forecasters, as well as measures from financial markets”.
“Financial conditions have tightened significantly in recent months, driven by higher longer-term bond yields, among other factors. Because persistent changes in financial conditions can have implications for the path of monetary policy, we monitor financial developments closely”.
This tightening of financial conditions adds to the expectations that the US has seen its last interest rate hike. In South Africa, no further interest rate hikes are likely this year either.
Next year, SA is only expected to see an interest rate cut in Q3.24, of 25bp, with the FRA (Forward Rate Agreement) curve slow in factoring in rate cuts for SA, but we continue to believe a 125bp drop will occur beginning in 2024 and ending in 2025.

Oil note: falling supply, inventories, war boost prices
12 October 2023
Tightening supply of oil from OPEC+, US inventory rundown and the Israel-Hamas war raise oil prices

International oil prices climbed at the start of the week, to US$88.15/bbl for Brent crude, from US$84.07/bbl towards the end of last week, in reaction to the advent of the Israel-Hamas war over the weekend, but have not seen severe elevation.
Over September, oil prices had already reached US$94.43/bbl on tightening supply, with the US having drawn down its Strategic Petroleum Reserve (SPR) to limit oil price gains, but this has created worries now of shortages as the reserve is depleted.
The US’s emergency crude oil supply “established primarily to reduce the impact of disruptions in supplies of petroleum products”, and its “sheer size … makes it a significant deterrent to oil import cutoffs and a key tool in foreign policy.”
With “storage capacity of 714 million barrels”, the Energy Information Administration (EIA) reports the US’s Strategic Petroleum Reserve is at less than half its capacity, the last time it was at such a low was in May 1983 when it was first being filled.
The depletion of the US’s SPR reserves is adding to the lift in oil prices, with neither Israel nor Palestine key oil exporters, but risks for higher oil prices (with Brent reaching or exceeding US100/bbl) this year exist on the conflict widening to other regions, as the war intensifies currently.
Higher oil prices add directly to inflation, with markets having hoped that the upwards interest rate hike cycle had ended globally, even if rates are likely to stay higher for longer. The war could imperil the terminal rate having already been reached.
The IMF estimates “that a 10% increase in oil prices leads to inflation being 0.4 percentage points higher a year later. Under that scenario, global output falls by 0.15 percentage point.”
“That would add to an already difficult environment for inflation and growth that’s challenging central banks.” Additionally, US Treasury Secretary, Janet Yellen, said the war brings risks to an already weak global growth outlook, but a US soft landing is still likely.
Historically, sustained political instability in the Middle East has seen oil prices rise as trade routes and/or the supply of oil for export are interrupted. Upside risks for oil prices persist this year, adding to inflation concerns and central banks hawkishness.
Also supportive of US Treasury Secretary, Janet Yellen’s comments, the Fed’s FOMC member, Minneapolis Fed President Neel Kashkari, is reported to have concluded that "(w)e feel like we're on track for a soft landing”.
"Inflation has come down quite a bit, the labor market has remained strong, maybe we can get inflation all the way back down and avoid ,,, a deep recession". Dallas Fed President, Lorie Logan, said higher for longer could mean "less need" for another rate hike.
The IMF again advised “central banks to keep policy tight until there’s a durable easing in price pressures.” “Monetary policy needs to remain tight in most places until inflation is durably coming down towards targets”. “We’re not quite there.”
In addition, the IMF recently lifted “its projection for the pace of consumer price increases across the world to 5.8% for next year up from 5.2% seen three months ago” with “global growth of 2.9% for next year, down 0.1% from its outlook in July”.
US treasury ten year yields have risen substantially on the higher for longer communication for US interest rates, and this has added to higher long-term borrowing costs for consumers and corporates, supporting risks to the economy.
US Treasury Secretary, Yellen, adds “I haven’t seen any evidence of dysfunction in connection with the increase in interest rates. When rates are more volatile, sometimes you see some impact on market function, but that is pretty standard.”
On climate change and oil, the IEA (International Energy Association) has said demand for oil and other fossil fuels needs to drop sharply “to meet the goals of the Paris climate accord, which aims to limit global warming to 1.5 °C above pre-industrial levels”.
“As a result, in this scenario, no new oil or gas fields need to be approved for development. New coal mines or mine extensions are also not needed.” “The impacts of climate change are increasingly frequent and severe, and scientific warnings about the dangers of the current pathway continue to grow.”
“By 2035, emissions need to decline by 80% in advanced economies and 60% in emerging market and developing economies compared with 2022 levels. However, current Nationally Determined Contributions are not in line with countries’ own net zero emissions pledges – and those net zero pledges are not sufficient to build a decarbonised global energy system by 2050.”

Commodity currencies: still facing risk-off, as central banks remain hawkish
6 October 2023
The rand has remained very weak this year, far removed from its fair value of closer to R15.00/USD. Substantial US dollar strength has been a key reason
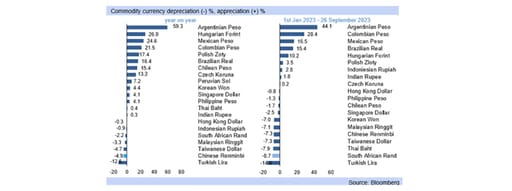
The rand has remained very weak this year, far removed from its fair value of closer to R15.00/USD. Substantial US dollar strength has been a key reason (see Rand outlook, 5th October), but the currency has also underperformed on its own.
Compared to other commodities and EM currencies the rand is particularly weak on the year against the greenback, and has also depreciated against the key crosses, at R20.62/EUR and R23.84/GBP, versus R15.65/EUR and R18.77/GBP in H1.22.
The rand recorded R14.40/USD in H1.22, and has been beset by prolonged financial market risk-off since the second half of Q2.22, but also by internal fundamental (structural) weaknesses of the economy, particularly weak economic growth.
GDP growth is likely to come out around 0.5% y/y this year, and the World Bank supports this view highlighting “economic activity in South Africa is expected to be subdued, with growth decelerating sharply to 0.5(%) in 2023 from 1.9%.
“Scheduled power outages increased in 2023, holding back manufacturing and mining. Poor port and rail performance have stymied domestic and foreign trade limiting the ability of commodity exports to reach their destinations”.
Additionally, hawkish Central Bank commentary, also dulling EM and commodity currencies, persists to control inflation and reduce the need for a continuation of the severity of the interest rate hike cycles which have been under way.
That is, being able to manage inflation expectations by the tone (of hawkishness) of the communications of the Central Banks, instead of additional hikes, increases the chances of soft landings for economies, avoiding recessions.
The IMF adds “the more effective monetary policymakers are in influencing inflation expectations, the lower the cost in forgone output involved in central banks achieving their inflation objective.” Particularly when “inflation rises sharply or becomes volatile.”
For commodity currencies, and EM’s, what will be key is the advent of interest rate cuts, particularly in the US, expected in July 2024 currently, and a strengthening in production in the Chinese economy, which could continue to lag.
Countries with healthier government finances have stronger economic fundamentals and lower bond yields, contributing to faster economic growth and can become a virtuous cycle, which SA was in under President Mbeki in most of the 2000s.
“The World Bank warns “pressures for higher government spending in South Africa (in particular, social spending and an increase in the wage bill), weaker domestic growth, and a decline in commodity export prices are weighing on the budget deficit.”
“Fiscal risks include the relief of the heavy debt burden of state power utility Eskom and increasing debt service costs. The fiscal deficit is expected to narrow slightly to 4.6 percent by 2025.”
“Nearly two-thirds of Sub-Saharan African Market-Access Countries (MACs) have tapped international markets over the past decade. Angola and South Africa are the largest issuers among the Sub-Saharan African MACs, which also include Côte d’Ivoire, Ghana, and Nigeria.”
“Now, however, the sell-off of developing countries’ Eurobonds and increasing investor fears about the global outlook amplify the risks for SubSaharan African countries facing large Eurobond redemptions.”
“Sovereign credit ratings, on average, deteriorated after 2018, and SubSaharan African countries tapped international markets amid worsening creditworthiness. Furthermore, countries lengthened the maturities of new bond issuances at marginally higher costs.”
Countries have been under strain as (non-oil) commodities prices weakened. Non-commodity exporters have seen benefits from rising demand for services, while manufacturing demand is weak in China, typically a main commodity importer.
The World Bank finds “growth of global trade in goods slowed in the first half of 2023 in tandem with weakening global industrial production, while (in contrast) services trade strengthened in the aftermath of the easing of pandemic-induced mobility restrictions that supported tourism.”
The delay in the global interest rate cut cycle, switch to services from goods (commodities) trade and the imbedded weakness in the Chinese economy limiting its recovery has stalked commodity prices, weakening currencies, with China’s growth expected to be services led.

FOMC note: US hike cycle expected to have ended
21 September 2023
The FOMC (Federal Open Market Committee) left the federal funds target rate unchanged at 5.25% - 5.50%, as widely expected.

The FOMC (Federal Open Market Committee) left the federal funds target rate unchanged at 5.25% - 5.50%, as widely expected and as already indicated at its July meeting, with the members concluding that recent data warranted its stance.
The projections materials showed a downwards revision in unemployment expectations, to 3.8% from 4.1% for this year, while the GDP growth figure was revised up, to 2.1% y/y from 1.0% y/y, highlighting the likelihood of a soft landing.
Fed Chair Powell noted that “recent indicators suggest that economic activity has been expanding at a solid pace, and so far this year, growth in real GDP has come in above expectations.”
And additionally, “recent readings on consumer spending have been particularly robust. Activity in the housing sector has picked up somewhat, though it remains well below levels of a year ago, largely reflecting higher mortgage rates.”
The projections for next year also showed a revision in unemployemt expectations, to 4.1% from 4.5% previously, while the GDP growth figure was revised up, to 1.5% y/y from 1.1% y/y, still representing some cooling next year.
Indeed, 2025 sees economic growth recover to 1.8% y/y in the FOMC forecasts, and the US unemployment rate remain at 4.1%, and then drop to 4.0% in 2026 (as the real GDP growth projection remains at 1.8% y/y in 2026).
The rand strengthened to R18.80/USD in response, from yesterday’s close of R18.84/USD, but the markets are likely to continue to digest the FOMC statements, and the rand consequently has room for further strength against the USD.
The FOMC next meets to deliver its interest rate decision on 1st November, and then its last meeting this year will be on the 13th December. Markets have factored in no full expectations of another US rate hike this year, and still see cuts next year.
Chair Powell added last night that “the labor market remains tight, but supply and demand conditions continue to come into better balance”, with the Fed showing less concern overall about the labour market”.
Indeed, he added, that “the unemployment rate ticked up in August but remains low, at 3.8 percent”, with the Fed previously having said that the labour market has to weaken substantially for inflation to cool.
Fed projections also show core PCE inflation nearing, then reaching, 2.0% over the next few years, as the Fed’s projections see inflation returning to the implied target, averaging 2.6% next year, from 3.7% y/y this year, then 2.3% y/y in 2025.
Changes in interest rates take a while to have an effect on inflation, with this lag potentially two to three quarters initially and the full effects coming through over a year to eighteen months.
The Fed itself says it “will take into account the cumulative tightening of monetary policy, the lags with which monetary policy affects economic activity and inflation, and economic and financial developments”.
While the Fed members signal the possibility of another hike, this is likely aimed at quelling inflation expectations and is not widely expected to transpire. In SA as well markets expect no further hikes this year, and cuts from next year.

Inflation: likely near 5.0% y/y for the rest of 2023
5 September 2023
CPI inflation has likely reached its low point for 2023, coming in at 4.7% y/y in July, as it benefited from statistical base effects in its descent over most of this year (the first half of 2022 to July saw inflation rise sharply in SA).
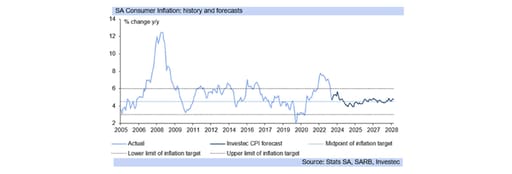
The next few months (August to February 2024) will likely see inflation rise to, and then remain above, 5.0% y/y, before moving back towards 4.5% y/y for the remainder of 2024, potentially undershooting towards 4.0% y/y at the end.
Fuel prices saw modest changes in August, with the petrol price rising by only 37c/litre last month, but tomorrow it is set to rise by R1.71/litre while diesel prices rise by around R2.80/litre, which will place some upwards pressure on the CPI.
However, petrol prices account for 3.5% of the CPI basket, while diesel prices only make up 1.4%. The lower weighting of the diesel sub component will have some moderating effect, but still place upwards pressure on the September CPI outcome.
Otherwise, August sees medical costs surveyed for private sector hospitals, and municipal rates and taxes. The largest individual component of the CPI basket, which is made up of food prices, will likely have only a small impact in August.
That is, although US dollar based international agricultural commodity food prices would have contributed some downwards price pressure on the month, the rand weakened by about 3.3% m/m against the dollar, eradicating the impact.
The publication of the August figure (in September) is likely to see South Africa’s CPI inflation rate climbing towards 5.0% y/y - mainly as a consequence of statistical base effects as CPI inflation began to fall in general from August last year.
While CPI inflation is expected to average around 4.5% y/y in 2024 – we currently have 4.6% y/y, risks remain from food price inflation in a El Nino (below average rainfall) year, along with the costs of load shedding.
This year, CPI inflation is expected to come out just below 6.0% y/y, potentially at 5.8% y/y, while further out in the period to 2025 and 2026, inflation is expected closer to the mid-point of 4.5% y/y, but with pressure to move to 5.0% y/y.

Unemployment slightly down at 32.6% in the second quarter
15 August 2023
The official unemployment rate decreased marginally to 32.6% in the second quarter of 2023 from 32.9% logged in Q1.23. Although it has improved moderately from levels recorded during the pandemic, it remains at an elevated level.

A “number of persons moved from the "not economically active" and "unemployed" statuses to the "employed" category between the two quarters”, according to Stats SA, resulting in the 0.3 of a percentage point decline in the unemployment rate.
Accordingly, the labour force participation rate picked up slightly to 59.6% (previously 59.4%), however it remains below 60%, evincing the fragility of the South African economy, which is plagued by a number of structural challenges, significantly impeding activity and weighing heavily on confidence and growth.
The number of employed persons increased by 154 000 to 16.3 million (1.0% q/q) with the formal sector of the economy primarily absorbing these individuals. Moreover, employment gains were logged within the private households’ segment (37 000 positions). Conversely, the informal (non-agriculture) sector shed -33 000 positions (-1.1%) over the quarter, but employment in this category is still up when compared to the same period last year (2.2%).
A disaggregation of the data (formal employment) on an industry basis, indicates that q/q increases were logged in five of the eight industries surveyed, with the trade sector recording the largest number of job gains of 71 000, this following job losses of -44 000 in Q1.23. Moreover, the construction sector added a further 62 000 positions.
Conversely, the manufacturing sector shed -53 000 jobs in Q2.23. Structural challenges including persistent load shedding, subdued local demand and a fragile global environment have weighed on business activity and new order growth.
The youth category which comprises those aged 15-24 years are the most disadvantaged segment of the economy when it comes to finding sustainable employment in this subdued market, with many lacking the necessary skills and experience. Unemployment in this grouping did come down slightly in Q2.23 to 60.7% (from 62.1% previously) but remains at a critically elevated level. Improving the quality of and access to education and skills training programmes remains vital.
According to Stats SA, “of the 7,9 million unemployed persons in the second quarter of 2023, as many as 50.1% did not have matric” a worrying statistic, while 40.2% had completed matric. “Only 6,6% of the unemployed had other tertiary qualifications, while 2,4% of unemployed persons were graduates”.
While this is a priority area for government, gains will be felt over the longer term. Emphasis needs to be placed on areas of the economy which can rectified or improved in the near-term, thus boosting confidence, attracting investment and accordingly driving growth and job creation.
The expanded unemployment rate, (which includes individuals who desire employment regardless of whether they are actively seeking work) declined marginally to 42.1% (from 42.4% in Q1.23) but is a marked 12.6 percentage points higher than the rate logged during the same period in 2008, demonstrating the extent of SA’s unemployment predicament.
Electricity production and consumption readings eased in June
3 August 2023
Electricity production and consumption readings eased notably to -3.7% y/y and -3.2% in June, following May’s respective -8.7% y/y and -7.7% y/y declines.

A combination of factors, including improved wind generation capacity, reduced demand and lower planned maintenance, allowed Eskom to reduce load shedding during the month, offering some reprieve to households and businesses.
Indeed, the energy availability factor rose to over 59.0 during the week of the 5th to the 11th June, after falling to levels closer to 50.0 earlier in the year.
However, as temperatures plummeted, Eskom was again forced to up the stages of rotational load-shedding as demand climbed, while a loss of generating capacity exacerbated the situation.
Persistent load shedding continues to weigh heavily on both consumer and business confidence and has severely impeded economic activity in the country, with marginal growth predicted for this year.
Various initiatives to improve the dire electricity supply predicament are ongoing.
An Energy One Stop Shop and Energy Resilience Fund were recently launched by the Minister of Trade and Industry. He commented that these “are critical steps towards alleviating the challenges faced by our industries during this energy crisis” and stressed that they are “committed to fostering a resilient business environment and accelerating private-sector investment in electricity generation to secure a stable energy future.”
Nersa’s recent decision to assign a license to the National Transmission Company South Africa SOC Ltd (NTCSA) to operate the Transmission system was favourably received by Eskom. The utility commented that the “decision marks a significant milestone in the legal separation process of the Transmission Division”.
A recent release by the President reported on the progress achieved a year since the introduction of the Energy Action Plan to tackle South Africa’s load shedding emergency. “To ensure that we never experience power shortages again, we are implementing fundamental reforms to create a competitive electricity market and an independent national grid operator,” the President commented. He did however acknowledge that the loadshedding crisis “will not be resolved overnight” but stressed that “we are making clear progress towards reducing it and eventually bringing it to an end”.

Foreign appetite for SA bonds grows on global financial market risk-on sentiment
1 August 2023
South African bonds have seen a further, modest recovery in yields, with the ten year benchmark yield reaching 11.10%, after some volatility in July
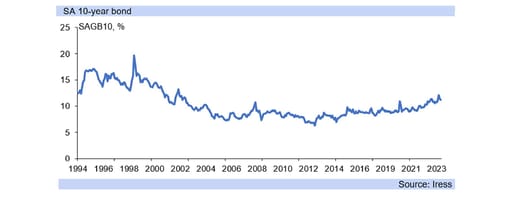
South African bonds have seen a further, modest recovery in yields, with the ten year benchmark yield reaching 11.10%, after some volatility in July when the yield reached 11.69%, while June started off at 11.99%.
Foreign investors have been net purchasers of SA government bonds in both June R14.5bn and July R11.4bn, after net selling of -R10.41bn in May, and indeed have been net purchasers for four months out of seven this year so far.
Overall non-residents have been net buyers of government bonds this year, at R7.5bn (settled trade data from Bloomberg, JSE), but with volatility month to month, and SA’s ten year yield is still 39bp higher than the start of the year.
Markets have been constantly recalibrating interest rate expectations this year, leading the volatility, along with uncertainty about global growth outcomes, and concerns are still apparent on inflation for a number of advanced economies.
The tightening in monetary conditions is unlikely to see release this year, with inflation still sticky for most advanced economies, and markets wary, with some appetite for risk assets (risk-on) but not a full-scale shift away from risk aversion yet.
In particular, the slow descent (stickiness) of core inflation creates a risk for inflation expectations, which have tended to the optimistic side in markets recently. This, along with incoming economic growth data, leaves room for some volatility.
In South Africa, concerns over slowing growth on the electricity crisis reduced economic growth expectations and so had negatively impacted expectations as well over the revenue collection potential of government.
SA is seeing its revenue collection, at R406bn for the year to date below that of last year for the same period of R424bn, while expenditure has not been curtailed, at R453bn for the year to date well above the R412bn of the same period last year.
The risk of a deterioration in state finances persists, even with a possible marginal upwards revision for GDP growth this year, from 0.2% y/y to 0.3% y/y or even 0.4% y/y. The state is not trimming expenditure and increased bond issuance is a risk.

FOMC note: markets see no further hikes currently
27 July 2023
The FOMC lifted the federal funds target rate by 25bp and indicated that at the September meeting it could hold rates steady
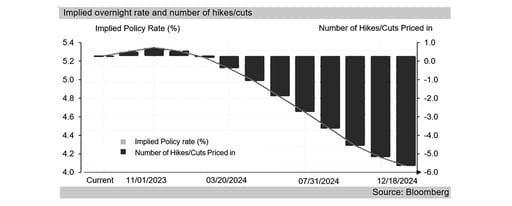
The FOMC lifted the federal funds target rate by 25bp (to 5.25% - 5.50%) and indicated that at the September meeting it could hold rates steady if the data warranted it, although a lift was not impossible.
Fed Chair Powell noted, “we have been seeing the effects of our policy tightening on demand in the most interest-rate-sensitive sectors of the economy” but “it will take time for the full effects of our ongoing monetary restraint to be realized, especially on inflation.”
Adding “the economy is facing headwinds from tighter credit conditions for households and businesses, which are likely to weigh on economic activity, hiring, and inflation.”
“In determining the extent of additional policy firming that may be appropriate … the Committee will take into account the cumulative tightening of monetary policy, the lags with which monetary policy affects economic activity and inflation, and economic and financial developments.”
"We will continue to make our decisions meeting by meeting, based on the totality of incoming data and their implications for the outlook for economic activity and inflation as well as the balance of risks”.
The FOMC communications leave some possibility for a hike in the Fed funds rate in September, but currently the markets have essentially priced in no change for the remainder of this year, and continue to see US interest rate cuts from next year.
The rand consequently has retained much of its recent strength, reaching R17.56/USD today, and yesterday R17.52/USD on US dollar weakness, its strongest rate since February this year.
The FOMC next meets on 20th September, and then will deliver another interest rate decision on the 1st November. Markets have factored in only a 5bp hike at the September meeting, and by November for rates to have risen by only 10bp.
With the FOMC hiking by 25bp at the July meeting it is not expected to do the same again at the September meeting, and market expectations see no further hikes in the current cycle for the US.
The last meeting of the year is on 13th December, and market expectations have fallen by then for only a 6bp hike, i.e. no change in rates. The market expectations for the moves at each meeting are not cumulative, but a reading at a point in time.
It is consequently believed that the FOMC has now reached the end of its interest rate hike cycle, as per the implied Fed funds futures, with the January 2024 meeting seeing the first indications of markets leaning toward a cut instead of a hike.
However, only by the May 2024 FOMC meeting is a 25bp cut in the Fed funds rate fully factored in (with a 32bp fall implied), while the March 2024 FOMC meeting currently has a 16.5bp cut factored in – as markets see a cut more likely than a hold.
In South Africa, the FRAs have not priced in any further hikes in the repo rate this year, with the essentially flat trajectory extending over Q1.24. However, as US interest rate cut expectations grow, SA is seen as cutting as early as mid-2024.
The FRA (Forward Rate Agreement) curve currently shows expectations of a further 25bp cut in the repo rate by the end of 2024, making it a 50bp drop in interest rates in total, although market expectations are subject to rapid change.

Mining Update: declines by -3.8% on a m/m seasonally adjusted basis in May
13 July 2023
Mining output decreased by -0.8% y/y in May and by -3.8% when measured on a month-on month seasonally adjusted basis, as the mining industry continues to face a number of challenges domestically and grapples with a fragile global environment weighing on export potential.

The outcome was notably weaker than consensus (Bloomberg) expectations.
A breakdown of the annual production reading shows that PGMs contracted by -7.2% y/y and owing to their size in the mining basket (22.96%) detracted -1.9% points from the headline reading. Moreover, diamond production continued to decline y/y, dipping for the 8th consecutive month in May. It fell by a notable -31.4% y/y, slicing -1.2% points off the topline number.
Weak global economic conditions, with a slower than projected rebound in demand from China as Covid restrictions were lifted have weighed on diamond sales, while competition from the lab-grown diamond industry persists.
Conversely, gold output increased by a further 27.3% in May, following April’s 27.4% lift, adding a notable 3.4% points to the headline outcome and preventing a larger year-on-year slump. This is line with the performance of the World Bank’s Precious Metals index which grew by over 8.0% y/y in May.
Indeed, the energy intensive mining sector continues to deal with electricity supply challenges, hindering optimal operational performance. Specifically, electricity generation fell by a further -9.0% y/y in May, according to Stats SA. Year-to-date (until end of May) it is down -8.1%.
Eskom recently announced a return to higher stages of load shedding, owing “to the loss of additional generating units overnight, the extensive use of Open Gas Cycle Turbines and the inability to replenish pumped storage dam levels” according to Eskom. This following, a moderation over June, supported by (amongst other factors) heightened wind generation and lower anticipated demand.
Besides the electricity supply predicament, the mining sector continues to grapple with logistical hinderances, labour specific issues and policy uncertainty. Moreover, the subdued global environment continues to weigh on the country’s export potential. Advance indications provided by June’s JP Morgan Global Manufacturing PMI survey indicated that the manufacturing PMI reading slipped to a six-month low.

Employment Update: Non-farm employment fell marginally in Q1.23
27 June 2023
Formal sector, non-farm employment fell by -21 000 or -0.2% in March 2023 when measured on a quarter-on-quarter basis.

Declines were recorded in the trade, business services, construction and transport sectors.
Indeed, the trade sector (which encompasses retail sales and related industries) shed 36 000 positions over the quarter, this following an increase over the seasonally significant festive period. Job numbers in all other sectors covered grew q/q, but not by any significant amount (except community services), evincing the dire state of the economy.
Indeed, when measured on a year-year basis, total employment numbers fell by -97 000 or -1.0%, with the country’s numerous challenges continuing to impede growth. We forecast GDP at a marginal 0.2% for this year.
The Quarterly Employment Survey also provides detail on wage developments across economic sectors. Gross earnings paid to employees across all industry groups declined by R34.1bn or -4.0% q/q. The decline was broad based, with only the business services and mining sectors logging increases in gross earnings over the quarter.
Moreover, average monthly earnings (in real terms) for non-farm employees decreased by -3.7% q/q (incl. bonuses and overtime) in February to R23 451. Measured on an annual basis, average earnings were down -0.2%, adding to the predicament of already financially stretched households.
A notable lift in business confidence which has fallen further into depressed territory this year, is required to encourage investment, growth and accordingly job creation.

Tourism Update: income from tourist accommodation rose by 30.9% y/y in April
20 June 2023
Income derived from the domestic tourist accommodation industry grew by 30.9% y/y, evincing the notable rebound in this significant sector of the economy

Income derived from the domestic tourist accommodation industry (accommodation only) eased moderately when measured on an annual basis (in nominal terms) in April. However, it still grew by 30.9% y/y, evincing the notable rebound in this significant sector of the economy, with receipts nearing pre-pandemic levels.
All accommodation types surveyed rose on a y/y basis in April, however the primary contributors to April’s 30.9% y/y lift were the hotels category and the “other” accommodation category (which includes lodges, bed-and-breakfast establishments, self-catering establishments and ‘other’ establishments not elsewhere classified). Specifically, they increased by 31.3% y/y and 33.7% respectively.
Indeed, routine data gathered by the Department of Home Affairs’ (DHA) reveals that 2 676 540 travellers (arrivals, departures and transits) passed through South African ports of entry/exit during the month of April. This represents an increase of 9.5% m/m and 57.7% y/y respectively.
Looking at tourist numbers specifically, there was a notable 65.4% y/y climb between April 2023 and April 2022. Those emanating from ‘overseas’ countries rose by 34.4% y/y during the month, with travellers from Europe comprising the largest share (over 60% of all ‘overseas tourists’) led by the UK and Germany. Moreover, tourists travelling from African nations rose by 77.3% y/y in April, with those stemming from SADC countries making up the majority.
These numbers reflect a buoyant tourism industry with significant potential. Tourism Minister Patricia De Lille recently published a statement on progress in the industry. She stated that “… we are committed to doing more to grow the tourism numbers and the sector even more to make a greater contribution to the country’s Economic Reconstruction and Recovery Plan.”
She noted that in April, together with the President she signed a new performance agreement, containing “key priorities to recover and grow the tourism sector” and she elaborated on the progress in these key areas. Indeed, the reduction of red tape, Infrastructure development and maintenance, tourism safety, improving air access and branding and communication are imperative to increase the country’s competitive position and attract more travellers.

FOMC note: pause as expected, likely terminal rate reached
15 June 2023
The FOMC left the federal funds target rate unchanged (at 5.00% - 5.25%) as widely expected last night, to allow the “lags with which monetary policy affects economic activity and inflation, and economic and financial developments” to come through.
That is, with a two to three quarter lag between a change in interest rates and the effect on the economy, including inflation, the rapid interest rate hike cycle in the US has not had time to fully feed through into inflation and other economic data.
The unemployment rate in the US has only ticked up somewhat, and expectations are that the economic growth rate will slow, while both the consumer and producer price inflation rates are falling (disinflation is occurring).
“Since early last year, the FOMC has significantly tightened the stance of monetary policy. We have raised our policy interest rate by 5 percentage points” but “the full effects of our tightening have yet to be felt.”
“In light of how far we have come in tightening policy, the uncertain lags with which monetary policy affects the economy, and potential headwinds from credit tightening, today we decided to leave our policy interest rate unchanged”.
“Committee participants generally expect subdued growth … the median projection has real GDP growth at 1.0 percent this year and 1.1 percent next year, well below the median estimate of the longer-run normal growth rate.”
The rand strengthened to R18.24/USD yesterday on US dollar weakness from a close of R18.63/USD, but has since moved back to R18.31/USD, with markets concerned that the FOMC is signalling further interest rate hikes could occur.
In particular, Chair Powell said at the press conference that “(l)ooking ahead, nearly all Committee participants view it as likely that some further rate increases will be appropriate this year to bring inflation down to 2 percent over time”.
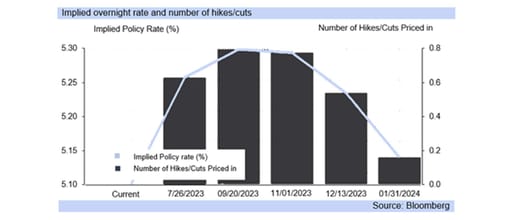
The FOMC next meets towards the end of July, and will deliver another interest rate decision on the 26th. Markets have factored in a 18bp hike at the meeting, and by September for rates to have risen by 21bp, not cumulatively (i.e. not 18bp + 21bp).
Instead, if the FOMC hikes by 25bp at the July meeting it is essentially not expected to do the same again at the September meeting, but rather instead only deliver one more 25bp hike in total in the current interest rate cycle as per market expectations.
However, it is likely that the FOMC will pause for longer then one meeting to assess the lagged effect of its interest rate hikes, given the two to three quarter lag noted above, and instead the Fed could keep interest rates flat out to Q4.23.
Towards the end of this year markets (Fed funds implied futures) are currently factoring in the possibility of interest rate cuts, from November, although this is unlikely to occur so soon, and the FOMC is more likely to wait until January.
While events can change in the next six months, economic data coming out in the US is likely to pull market sentiment closer to that of no further hikes in the US interest rate cycle, allowing the terminal (end) rate to have been reached already in May.
South Africa’s FRAs have currently only fully priced in a 25bp hike in SA’s repo rate by September, and then a flat trajectory thereafter, but as US interest rate hike expectations work out of the system this is likely to fall away too.

US says SA in danger of losing AGOA benefits due to Russian ties
13 June 2023
South Africa’s export trade ability has deteriorated substantially on the fall in rail and port capacity, which has negatively affected industrial production in SA
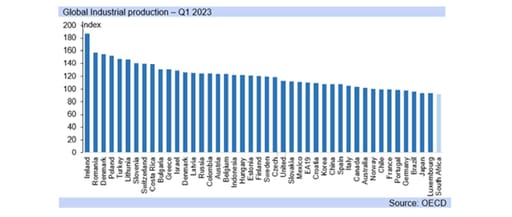
South Africa’s industrial (manufacturing, mining and electricity) production grew by a small 0.4% m/m (seasonally adjusted), in April 2.1% y/y with industrial production accounting for around 19.7% of GDP, while demand for trade weakened in April.
South Africa’s export trade ability has deteriorated substantially on the fall in rail and port capacity, which has negatively affected industrial production in SA and in part prompted the urgent partnership between government and organised business.
The partnership initiative, outlined yesterday in the rand note as well as in Friday’s note (contact details below) aims to dramatically improve the performance of SA’s logistical sector, as the country cannot consistently meet demand for its exports.
However, the bigger threat to South Africa’s industrial production, and so growth and existing jobs, is the loss of benefits from AGOA and secondary sanctions from Western countries, with the relationships not quickly and or easily repaired.
Russia accounts for a paltry 0.2% of SA’s global export trade, and the US, UK and EU combined 35%, with China only around 9%. South Africa has been playing with fire for its economy in participating in naval exercises with Russia and other activities.
A group of US bipartisan legislators said recently that “serious concerns with current plans to host this year's AGOA Forum in South Africa” and that “actions by South Africa call into question its eligibility for trade benefits under AGOA”.
This is the strongest communication coming from the US so far on SA’s allegiances to Russia, with AGOA’s “statutory requirement that beneficiary countries not engage in activities that undermine United States national security or foreign policy interests”.
The group added “while we understand that the AGOA eligibility review process for 2024 is underway and that decisions have not yet been made, we question whether a country in danger of losing AGOA benefits should have the privilege of hosting the 2023 AGOA Forum.”
SA imports and exports virtually nothing from Russia, at 0.2% and 0.1%, while risks losing up to 40% of its trade if sanctions are imposed against it by the West, which would drive the economy into a deep, severe recession, extreme rand weakness and collapse in government finances, most likely bankrupting the state. SA will likely face its worst economic crisis if it undergoes full sanctions from the West.
The US bipartisan legislators group further said “(h)osting the forum in another country in Sub-Saharan Africa would send a clear and important message that the United States continues to stand with Ukraine and will not accept our trading partners provision of aid to Russia's ongoing and brutal invasion.”
“We are seriously concerned that hosting the 2023 AGOA Forum in South Africa would serve as an implicit endorsement of South Africa's damaging support for Russia's invasion of Ukraine and possible violation of U.S. sanctions law.”
South Africa's government has “deepened its military relationship with Russia over the past year. Late last year, a Russian cargo vessel subject to U.S. sanctions docked in South Africa's largest naval port, and Intelligence suggests that the South African government used this opportunity to covertly supply Russia with arms and ammunition that could be used in its illegal war in Ukraine.”
“In February, South Africa held joint military exercises with Russia and China, and in April, authorized a Russian military cargo plane also subject to U.S. sanctions- to land at a South African air force base.”
“On top of this, in August, South Africa will host the BRICS Summit where the government aims to strengthen its ties with China and Russia and is working to facilitate the Participation of Russian President Vladimir Putin, despite the outstanding arrest warrant issued by the International criminal Court (ICC).”
South Africa needs to cease absolutely all and any military ties, relationships and activities with Russia if it does not want to lose the AGOA trade benefits and face sanctions from Western countries that will decimate its economy, socioeconomics and major sources of government funding.
South Africa is, worst case, risking becoming a bankrupt state for its relationship with Russia, which adds virtually nothing to the economy, state revenues, economic growth job creation or socioeconomic stability and investor sentiment.
The rand has depreciated this morning on the news, halting its rapid gains recently which means SA will lose out on what could have been a fuel cut for the population if the states allegiances with Russia had not negatively caught up with it as per the US brief. However, US disinflation figures aided some small rand strength this afternoon.
There remains poor understanding in South Africa of the absolutely dire consequences pursuing a relationship with Russia will have on the country in the current geopolitical climate, particularly looking to physically host President Putin in SA and seeking ways to avoid the ICC edict for his arrest.

South Africans are getting poorer: salaries declining in real and nominal terms
9 June 2023
As living costs rise and salaries shrink, South Africans are finding it increasingly difficult to make ends meet. This alarming reality not only erodes individuals' purchasing power but also weakens the overall economy.
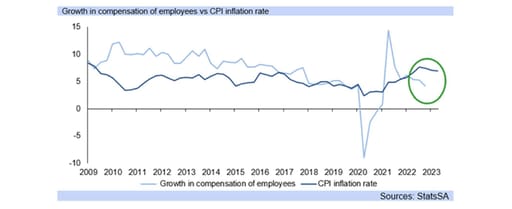
According to the BankservAfrica Take-home Pay Index (BTPI), the average nominal take-home pay of South Africans in April 2023 was R15,063, down from R15,335 in April 2021. In real terms, adjusted for inflation, take-home pay dropped even further to R13,524, marking a significant 10.4% decline compared to the previous year’s figure of R15,097. These downward trends are concerning, with salaries experiencing a 4.2% year-on-year decrease while the cost of living increased by 6.8% in April.
Poor economic fundamentals
South Africa has been grappling with a stagflationary environment characterised by weak economic activity and persistently high inflation. This, coupled with declining real wages, has significantly hindered economic growth and employment prospects. With muted demand and reduced non self-generation fixed investment, the economy finds itself in a precarious position. In this environment, companies find themselves in a prolonged "survival mode," which makes it difficult for them to retain existing staff, let alone increase wages or hire new people.
South Africa's electricity crisis, exacerbated by corruption scandals within Eskom and Transnet, has further hampered economic growth and employment prospects. Additionally, insufficient rail and port capacity has negatively impacted growth and job creation. Recognising the urgency, President Ramaphosa last week convened a meeting with business leaders in hopes that the private sector can help spearhead efforts to address these pressing issues.
But power shortages and load shedding are not the sole causes of South Africa's current predicament. The drop in consumer affordability also plays a significant role in weakening the economy. Household Consumption Expenditure (HCE), which drives two-thirds of GDP, suffers when affordability declines, resulting in overall economic growth being affected. The BankservAfrica's Economic Transactions Index (BETI) confirms this trend, with a 7.4% year-on-year decline in HCE in May.
The burden of debt
South African households are burdened with mounting debt stress. The impact of successive interest rate increases and elevated inflation levels is becoming increasingly evident in the state of consumer finances. Debt Busters reports that a significant portion of net incomes, reaching up to 65%, is now allocated to debt repayments. Disturbingly, even individuals earning R20,000 or more per month are forced to allocate 70% of their income towards debt repayment.
Unsecured debt levels in South Africa have reached unsustainable heights: on average, they are 30% higher than in 2016, with an even steeper increase of 67% for those earning R20,000 or more per month. This surge in unsecured debt is a direct consequence of falling take-home pay as consumers resort to credit to compensate for their diminishing income.
Impact on the economy
Salaries below the inflation rate do not contribute to strengthening the economy or driving demand for goods and services. On the contrary, this downward trend in personal earnings has been a key factor behind poor economic growth and employment outcomes in South Africa. Unless the country’s fundamental economic weaknesses are urgently addressed, by way of solutions to the energy and transport crises as well as far-ranging structural economic reforms, the country risks falling into a self-perpetuating spiral of increasing poverty and permanent economic malaise.

Marginal GDP increase amidst persistent challenges
6 June 2023
Lacklustre 0.4% rise in Q1 2023 GDP reflects electricity shortages and a -12.3% decline in the agricultural sector

The first quarter of 2023 saw a marginal rise of 0.4% in GDP when measured on a quarter-on-quarter seasonally adjusted basis. This outcome, in line with our and consensus expectations, follows a contraction of -1.1% in Q4 2022. On a year-on-year basis, GDP only increased by 0.2% during the first quarter.
The subdued GDP reading reflects the fragile economic environment, plagued by numerous challenges, with inadequate electricity supply being a persistent issue. In the first quarter, electricity generation declined by -7.7% year-on-year, significantly hampering the country's growth potential.
The agricultural sector experienced a sharp decline of -12.3% quarter-on-quarter, shaving 0.4% from the topline reading and effectively negating most of the gains recorded by other sectors. As a result, despite a modest 0.9% lift in mining output, the primary segment of the economy fell by -4.7% quarter-on-quarter.
On a more positive note, the secondary sector of the market showed an increase of 1.1% quarter-on-quarter, driven by the manufacturing and construction industries. Manufacturing activity rose by 1.5% quarter-on-quarter, with the food and beverages segment playing a significant role. Additionally, the construction sector increased by 1.1% quarter-on-quarter, with growth reported in both residential and non-residential building projects, according to Stats SA. This aligns with the Q1 2023 building survey conducted by BER, which indicated increased confidence among builders in both sectors.
The tertiary segment of the economy experienced a moderate rise of 0.7% quarter-on-quarter, with all sub-sectors contributing to the growth. The finance sector increased by 0.6% quarter-on-quarter and, due to its substantial size, added 0.2% to the headline GDP number. The trade sector also contributed 0.1% to the topline reading, with growth reported in wholesale trade, retail trade, and catering and accommodation, according to Stats SA.
In terms of expenditure, the first quarter of 2023 also yielded a 0.4% increase quarter-on-quarter, following a decline of -1.1% in Q3 2022. Positive contributions from household consumption expenditure, government expenditure, and gross fixed capital formation were observed, although net exports detracted -0.2% from the overall result. Export growth of 4.1% underperformed import activity, which stood at 4.4% over the quarter. Domestic logistical constraints – notably the poor state of SA’s rail and ports – along with subdued global manufacturing demand, weighed on the country's export potential.
Household final consumption expenditure (HFCE), which comprises around two-thirds of GDP, rose by 0.4% quarter-on-quarter, contributing 0.3% to the overall number. Notably, semi-durable goods grew by 2.4% quarter-on-quarter, driven by a recovery in clothing and footwear sales, particularly for work attire and formal wear, as workers returned to offices and recreational activities normalised. Furthermore, the non-durables segment increased by 1.0% quarter-on-quarter. Despite this modest lift in HFCE, consumers continue to face financial constraints, grappling with the rising cost of living while unemployment remains at critically high levels.
Gross fixed capital formation increased by 1.4% quarter-on-quarter, following a lift of 1.5% in Q4 2022. This growth was primarily supported by the pick-up in the other assets category and the machinery and other equipment grouping. However, a notable improvement in business confidence, which further deteriorated in Q1 2023, is necessary to significantly boost private sector investment. This can only be achieved if visible gains are made in improving electricity supply, fixing transport infrastructure, restoring political stability and pushing through policy reforms that make it easier to do business.

Rand collapse and SA’s geopolitical choices jeopardise economic growth
1 June 2023
Load shedding and rand weakness threaten South Africa's inflation trajectory, hindering economic growth and necessitating urgent action to stabilise the currency and restore investor confidence.
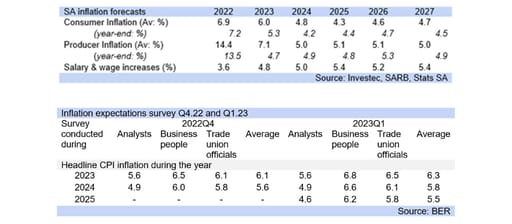
South Africa's battle with inflation is facing unexpected headwinds, including the sharp depreciation of the rand, a rapidly deteriorating energy crisis and geopolitical choices that are alienating the country’s major trading partners.
The substantial depreciation of the rand over the past fourteen months has fueled higher inflation rates compared to what would have been seen in a more stable currency environment. This depreciation has had a cascading effect on consumer prices, pushing them upwards.
Load shedding, the scheduled power outages that have plagued South Africa, has placed severe strain on an already moribund economy. It has not only added to costs and inflationary pressures but also hampered economic growth, job creation, and business confidence. The Council for Scientific and Industrial Research (CSIR) highlights that power from generators can be up to 408% more expensive than power from the municipal grid. This increase in costs has hamstrung business activity and contributed to inflationary pressures. According to the South African Reserve Bank (SARB), load shedding could add an additional 0.5 percentage points to headline inflation in 2023.
The persistent concerns surrounding load shedding have also taken a toll on investor sentiment, causing an increase in South Africa's risk premium and putting pressure on the currency. The weakened rand raises the cost of imported goods, leading to higher prices for goods purchased in hard currency.
Moreover, South Africa's involvement with Russia on various fronts, including the prospective hosting of the Russian President at a BRICS summit this year, has further contributed to the rand's weakness. The country's graylisting and geopolitical choices have added to the uncertainties surrounding the economy.
Addressing these issues will require concerted efforts from policymakers to stabilise the currency, alleviate the strain caused by load shedding, and restore investor confidence. Failure to do so could prolong South Africa's struggle with inflation and further damage the country’s struggling economy.

PPI update: SA inflation outlook improves on lower April PPI numbers
25 May 2023
April’s headline producer price inflation (PPI) reading eased to 8.6% from 10.6%, significantly below consensus forecasts

April’s headline producer price inflation (PPI) reading remained flat on the month, easing to 8.6% from 10.6% previously when measured on an annual basis. This was below consensus expectations (Bloomberg) of 9.0% y/y.
The monthly contribution from the coke, petroleum, chemical, rubber and plastic products grouping, in which fuel price dynamics are recorded fell by -0.4% in April, from an increase of 0.5% previously, supported by the drop in the diesel price at the beginning of April.
When measured on an annual basis, petrol price inflation decelerated to 4.5% y/y from 6.4% y/y previously, while diesel price inflation contracted by -1.4% on the year, after rising by 11.1% y/y in March. Accordingly, the contribution from this category of the PPI index, which makes up 22.7% eased notably to 1.6% points from 3.3% points previously.
Manufactured food price inflation decelerated further in April to 11.1% y/y from 11.7% y/y and 13.7% y/y recorded in March and February respectively. According to Agbiz, while load-shedding continues to weigh heavily on optimal production, “various interventions to ease the load-shedding burden on farmers, such as load curtailment, expansion of the diesel rebate to the food value chain, and, most recently, the launch of the Agro-Energy Fund” have eased the burden somewhat. However, for those not fully benefiting from these support measures, costs “remain high because of all the necessary mitigation measures”.
A breakdown of the food basket indicates that meat and meat product inflation eased to 4.8% y/y from 6.1% y/y previously, while prices of grain mill products, starches and starch products, and animal feeds declined to 19.1% y/y from 22.0% y/y.
Moreover, the oils and fats category saw prices contract y/y by -8.9%. According to Agbiz this notable “moderation in the "oils and fats" products is in line with what we are seeing in the global environment, as South Africa still imports its palm oil usage”. Specifically, FAO's vegetable oil price index was 45% lower in April, when compared to the same time last year. However, it cautioned that “the weaker rand exchange remains an upside risk to prices”.
Price pressures also eased within the metals, machinery and equipment segment of the PPI basket from 9.2% y/y to 6.9% y/y, aided by the structural and fabricated metal products sub-category.

Tourism Update: strong recovery in tourist accommodation revenues in Q1.23
23 May 2023
South Africa's tourism industry is making a comeback. Y/y domestic tourist accommodation income was up 50% for the quarter, and traveller numbers in March increased by 73.4%

Tourism in South Africa is experiencing a notable uptick, following the pandemic's devastating impact on the travel industry. Income from domestic tourist accommodation rose by nearly 50% in Q1.23 compared to the same period last year. The hotels category and the "other" accommodation category, which includes lodges, bed-and-breakfast establishments, self-catering establishments, and other establishments not elsewhere classified, were the primary contributors to this increase.
In March, 2,445,237 travelers passed through South African ports of entry/exit, according to data from the Department of Home Affairs. This represents a month-over-month increase of 16.1% and a year-over-year increase of 73.4%. Looking specifically at tourist numbers, there was a significant 102.5% year-over-year climb between Q1.23 and Q1.22, with the majority of travelers originating from Europe. Travelers from African nations also rose by 99.3% year-over-year in Q1.23, with those stemming from SADC countries making up the majority.
The tourism industry is a valuable stream of foreign exchange, sustaining and creating jobs and enabling further investment in South Africa's tourism infrastructure. In a recent statement, the Presidency reinforced the fact that "the industry is making a strong and sustained comeback," adding that tourists "are also spending more during their visits - more than R25 billion in the first quarter of 2023." This is a valuable source of foreign exchange that can help sustain and create jobs while enabling further investment in the country's tourism infrastructure.
President Ramaphosa has emphasised the importance of growing this essential sector of the economy, which is a significant channel for job creation, with strong links to other key sectors. The government intends to forge ahead with the process of immigration reform to improve South Africa's competitiveness as a tourism destination.

Labour Update: unemployment slightly up at 32.9% in the first quarter
16 May 2023
The overall labour participation rate is below 60% at 59.4% evincing the fragility of the South African economy

The official unemployment rate picked up marginally to 32.9% in the first quarter of 2023 from 32.7% logged in Q4.22. Although it has fallen from levels recorded during the pandemic, it remains at an elevated level. The overall labour participation rate is below 60% at 59.4% evincing the fragility of the South African economy, which is plagued by ongoing rotational load shedding, significantly impeding activity and weighing heavily on confidence and growth. Indeed, we expect GDP growth of just 0.2% this year with downside risks apparent.
A “number of persons moved from the "not economically active" category to "employed" and "unemployed" statuses between the two quarters” according to Stats SA, resulting in the 0.2 of a percentage lift in the unemployment rate.
Specifically, the number of employed persons increased by 258 000 to 16.2 million (1.6% q/q) with the formal sector of the economy primarily absorbing these individuals. The informal (non-agriculture) sector however added an additional 107 000 positions (3.6%) over the quarter and when measured on a year-on-year basis informal sector employment has grown by a notable 8.7%. Employment within private households however slid by -7.5% q/q (-85 000), bringing down the total employment reading.
A disaggregation of the data (formal employment) on an industry basis, indicates that increases were logged in only three of the eight industries surveyed. Specifically, the finance sector, services sector and utilities sector which added 157 000, 139 000 and 8 000 positions respectively over the quarter.
Conversely, the trade sector recorded the largest number of job losses at -44 000, after the fourth quarter of the year generally sees a seasonal pick-up in employment in this particular segment of the market, primarily in the tourism, hospitality and related sectors. Moreover, the mining industry saw unemployment decline by -25 000, while the manufacturing sector shed -17 000 positions. These are highly energy intensive industries and the unprecedented electricity supply situation has weighed heavily on activity in these respective sectors.
The youth category which comprises those aged 15-24 years are the most disadvantaged segment of the economy when it comes to finding sustainable employment in this subdued market, lacking skills and experience. Unemployment in this group rose to a critically high 62.1% in Q1.23, from 61.0% in Q4.22. Improving the quality of and access to education remains vital. According to Stats SA, “of the 7,9 million unemployed persons in the first quarter of 2023, as many as 48.3% did not have matric, and 40.7% had completed matric …while only 2,7% of unemployed persons were graduates.”
The is a priority area for government and while many initiatives have been announced, a significant pick up in confidence is imperative to drive sustainable growth and accordingly job creation. Rectifying the electricity supply situation remains imperative in this regard.
The expanded unemployment rate, (which includes individuals who desire employment regardless of whether they are actively seeking work) declined marginally to 42.4% (from 42.6% in Q4.22) but is a marked 11.5 percentage points higher than the rate logged during the same period in 2008, demonstrating the extent of SA’s dire unemployment situation. Indeed, consumers are highly constrained; the cost of living has spiralled with inflation proving sticky, while the indebted are having to contend with markedly higher interest rates with a further hike expected at next week’s MPC meeting.

FOMC note: Fed does not affirm a halt to rate hikes
4 May 2023
The FOMC raised its target range for the federal funds rate to 5.00% - 5.25% (25bp lift) as widely expected yesterday, but its statement was much more balanced, highlighting all areas of concern versus previously showing a greater inflation focus.
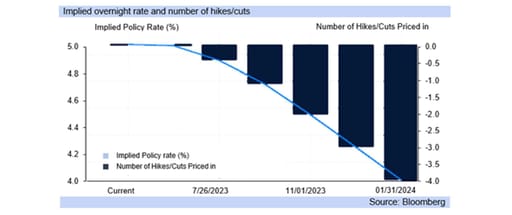
In particular, it recognised a more flexible approach to “additional policy firming”, is appropriate, taking “into account the cumulative tightening of monetary policy” and “the lags with which monetary policy affects economic activity and inflation”.
The very hawkish approach of the earlier FOMC statements was dialed down, and the Fed essentially left the door open for a pause at its next meeting (14th June) or the terminal rate having been reached, but also did not rule out further hikes.
Chair Powell also placed concerns over instances of weakness in the US banking system front and foremost in his press conference statement, with the failure of a third US bank during the US’s very rapid, and severe, rate hike cycle.
In particular though, last night’s statements showed a shift in monetary policy to focus on both employment and inflation (the FOMC’s dual monetary policy mandate), from what had become a very unidimensional focus on inflation.
The Fed has raised its funds rate by a full 5.00% over last year and this year to date, which has only partially reduced inflationary pressures, although subsiding supply side pressures from last year into this was a key driver of lower inflation.
High commodity prices pushed up the US’s inflation CPI and PPI inflation measures last year, and high demand pull pressure the year before. Both have subsided substantially since then, but second round effects have now become entrenched.
These are evident in core inflation measures in particular, which are elevated, far removed from the FOMC’s implicit inflation target of 2.0% y/y, and proving sticky which is still raising concerns for the FOMC.
The FOMC has to balance these concerns against the impact of tighter credit conditions on the economy and banking sector, particularly the latter for financial stability, although the FOMC’s concerns over high inflation are still very apparent.
The rand strengthened to R18.21/USD on slight US dollar weakness from a close of R18.29/USD in SA markets yesterday, but has since moved back to R18.25/USD, very slight movements as markets are not sure of the direction of rates yet.
The FOMC next meets mid-June, and will deliver another monetary policy update. The chance of another hike is currently seen at 0%, and instead the Fed funds futures are tipping towards a greater chance of a cut than a hike at the next meeting.
That is, markets believe the US has ended its rate hike cycle for this year, and that cuts are likely instead, of 1.00% by the end of January next year, and that July this year will see close to a 50bp drop.
With markets having seen around a 50% chance of US recession in H2.23, markets believe cuts instead of further hikes from here are likely, and that the Fed did indeed reach its terminal rate (last hike) in the current cycle yesterday.
South Africa’s FRAs have fully priced in a 25bp hike for this month in SA’s repo rate, with a 34bp hike indicated, down slightly from closer to 40bp hike factored in on Monday. By July SA markets currently expect another 25bp hike in the repo rate.

Manufacturing Update: production contracted by -5.2% y/y in February
12 April 2023
Manufacturing production contracted by a further -5.2% y/y in February, from -4.1% y/y (revised) in January. The result was weaker than consensus expectations (Bloomberg) of a -3.7% y/y decline.

The dire electricity supply situation remains a key downside risk to the energy intensive manufacturing sector. Indeed, electricity production and consumption fell by a marked -9.7% y/y and -8.7% y/y respectively, in February, with Eskom’s Energy Availability factor (EAF) hovering below 55.
The decline was broad based with only two of the sub-sectors included in the manufacturing index increasing on an annual basis in February (namely the motor vehicles, parts and accessories sector and the radio, television and communication apparatus and professional equipment sector).
Food and beverage production which makes up over 20.0% of the manufacturing index declined by -6.1% y/y in February, following a rebound at the beginning of 2023. Accordingly, the sector detracted -1.3% points from the headline reading. The decrease was largely underpinned by a -12.9% y/y slide in beverage output.
Moreover, the petroleum and chemical products segment, together with the basic iron and steel sector sliced a further -2.1% points off the topline number on the back of declines of -4.7% y/y and -5.3% y/y respectively.
February’s manufacturing production result is in line with the movement of the ABSA headline Purchasing Managers’ index (PMI) which slid into contractionary territory in February, for “the first time since September 2022”, according to the BER. In turn, “pointing to a marked deterioration in business conditions in the factory sector”. The business activity sub-index moved below 50 (neutral reading) in February, weighed down by heightened load shedding during the month. Specifically, “an unprecedented seven consecutive days of stage 6 load-shedding” was undertaken during the PMI survey period, according to the BER.
Similarly, March’s PMI reading remained in contractionary territory weighed down by domestic specific challenges, with the PMIs of some advanced economies showing some improvement. Specifically, across the euro area, manufacturing production “signalled the strongest monthly performance in factory output since May last year,” according to S&P Global.
Moreover, the BER’s manufacturing survey results for Q1.23 indicate that business confidence amongst manufacturers has decreased notably, dragged down in part by the negative effects of persistent power outages “on production, costs and confidence”.

Household finances: salaries weakening, confidence low
12 April 2023
Household finances: salaries weakening in both real and nominal terms, confidence is low
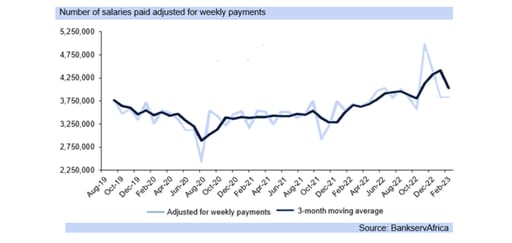
Early consumer data for February shows that the BankservAfrica Take-home Pay Index, or BTPI, continues to contract on the year, by -1.8% y/y in February in nominal terms (to R15 186 monthly) and -8.3% y/y in real terms (R14 225).
The actual number of salaries, as opposed to the rand value, fell on a monthly basis in December and January but BankservAfrica says “less than a thousand” “jobs were created in February”, as “the job market stabilised”.
The fall in annual salaries, both in nominal (or actual), and real (or inflation adjusted terms) should be viewed against the difficult environment businesses face in South Africa’s high operating cost environment, due not least from electricity loadshedding.
Companies also are operating in a high interest rate environment, the highest in fourteen years, which is adding to the restrictive conditions, while economic demand is subdued, and inflation is still high historically for SA, near 2009 highs.
South Africa’s cost of living has increased at a rapid rate over the past twelve months, as measured by the CPI inflation rate, peaking at 7.8% y/y in July last year, but still high at 7.0% y/y, eroding consumers purchasing power.
With weak economic growth of only 0.2% y/y expected in 2023, little job creation is to be expected, with BankservAfrica data for February showing economic activity contracting, and in March economic activity reached its lowest point in three years.
Specifically, the BankservAfrica Economic Transactions Index (BETI) dropped -3.6% y/y, falling also in quarterly and monthly terms as “the weakness in the economy has become quite broad-based, with most sectors under severe pressure”.
BankservAfrica further highlights that “the BETI (is) flagging … a negative quarterly growth rate in Q1 2023. The March BETI was 1.7% lower than in the quarter ending December 2022. Other nowcast indicators also performed dismally”.
We continue to forecast a GDP contraction for Q1.23, of -0.5% qqsa (quarter on quarter, seasonally adjusted, but not annualised) from Q4.22’s -1.3% qqsa, with a recession on a technical basis as loadshedding cuts into productive capacity.

Rising Oil Prices Pose Inflation Risks for Global and South African Economies
4 April 2023
Implications for Central Bank Policies and the Need for Greater Rand Strength

FOMC note: rand strengthens as Fed dials back on hawkishness
23 March 2023
The FOMC raised its target range for the federal funds rate to 4.75% - 5.00% (25bp higher) as expected, balancing the need to continue to seek to return inflation to 2.0% with the impact of high interest rates on financial stability.
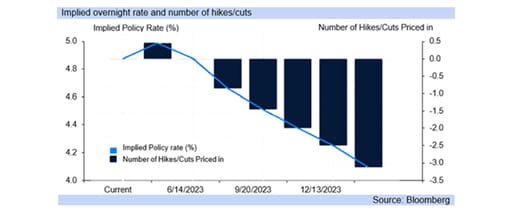
The tone was seen as somewhat less hawkish than commentary coming out early in the month and in February, when market expectations were factoring in a 50bp lift at last night’s meeting, although the recent banking crisis in the US saw a more modest hike.
Fed Chair Powell highlighted “recent developments in the banking sector” “in the past two weeks, particularly serious difficulties at a small number of banks have emerged."
“History has shown that isolated banking problems, if left unaddressed, can undermine confidence in healthy banks and threaten the ability of the banking system as a whole to play its vital role in supporting the savings and credit needs of households and businesses.”
“In response to these events, the Federal Reserve, working with the Treasury Department and the FDIC, took decisive actions to protect the U.S. economy and to strengthen public confidence in our banking system.”
Higher interest rates have added to some stresses in the US banking system amongst smaller banks, particularly in the case of SVB which had invested heavily in US treasuries, but had not hedged against changes in their value.
A depositor run, and further problems resulting in the failure of Signature Bank, led to concerns that other financial institutions would be negatively affected by the higher interest rate environment, particularly smaller banks, creating some systemic risk.
Market expectations pulled back on US interest rate hike expectations, with yesterday’s 25bp lift striking a balance as the FOMC also communicated “inflation remains too high, and the labor market continues to be very tight”.
“Price stability is the responsibility of the Federal Reserve. Without price stability, the economy does not work for anyone. In particular, without price stability, we will not achieve a sustained period of strong labor market conditions that benefit all.”
“Inflation has moderated somewhat since the middle of last year, but the strength of recent readings indicates that inflation pressures continue to run high. The process of getting inflation back down to 2 percent has a long way to go and is likely to be bumpy.”
The rand strengthened in response to the more modest Fed tone, reaching R18.06/USD on some US dollar weakness from a close of R18.28/USD in SA markets yesterday.
The FOMC next meets in May (3rd) although the chance of another hike is currently seen around 50% for a 25bp lift, with the Fed statement reading “some additional policy firming may be appropriate”.
The Fed funds futures have factored in implied rate cuts for H2.23, with July (26th) meeting seeing 80% chance of a 25bp cut, and factoring in a second 25bp cut the FOMC’s November meeting (1st), although expectations will likely remain volatile.
South Africa’s monetary policy committee (MPC) meets for its interest rate decision at the end of this month, and the FRA curve (Forward Rate Agreement) curve has mostly (but not fully) factored in a 25bp lift in SA’s repo rate.

Credit Rating note: risk of downgrade as S&P drops its positive view on SA
10 March 2023
The deteriorating outlook is directly attributable to electricity shortages, erosion of transport infrastructure and general failure of SOEs

S&P was only due to provide a country review on SA and potentially in May, but instead, it opted to this week to remove the positive outlook it had on SA’s BB- rating, dashing hopes of a rating upgrade to BB.
The agency said the deterioration in its outlook on SA came as “economic growth in South Africa is facing increasing pressure from infrastructure constraints, particularly severe electricity shortages.”
"Reforms to address infrastructure shortfalls and to improve governance and performance at state-owned enterprises (SOEs) are slow, weighing on growth, while contingent liabilities from SOEs pose continued downside risks," the statement continued. “We therefore revised our outlook on South Africa to stable from positive, reflecting these risks. We affirmed our 'BB-/B' foreign currency sovereign credit ratings on the country. The now stable outlook … balances South Africa's credit strengths--particularly a credible central bank, a flexible exchange rate, an actively traded currency, and deep capital markets--against infrastructure-related pressures on growth, and downside risks to the fiscal and debt position.”
The stable outlook means SA is no longer in line for a credit rating upgrade to BB, although the agency does say it “could raise the ratings if there is an improving track record of effective reforms, resulting in structural improvements in economic growth alongside a reduction in public debt and contingent liabilities.”
It is key to note that the decision was not due to any weakening in government finances, but instead because of the weakening economic growth rate, as load shedding worsens, along with rail and port capacity.
Indeed, S&P warns it could downgrade SA “if the ongoing implementation of economic and governance reforms does not progress as planned, resulting in further deterioration in economic growth, or higher-than-expected fiscal financing needs," or a "deepening of the electricity crisis or if critical infrastructure constraints worsen.”
SA’s electricity crisis is likely to worsen without the eradication of the reported criminality damaging supply, with plans for higher levels of loadshedding extended beyond stage 8 to protect the grid.

GDP Update: GDP contracted by a weaker than anticipated -1.3% qqsa in Q4.22
7 March 2023
Headline GDP fell by -1.3% on a quarter on quarter seasonally adjusted (qqsa) basis in the fourth quarter of 2022, following Q3.22’s 1.8% qqsa (revised) increase.

Q4.22’s outcome was notably weaker than consensus expectations (Bloomberg) of a -0.4% qqsa decline. Measured on a year-on-year basis GDP rose by just 0.9% in the fourth quarter, while for the year as a whole growth eased to 2.0% (from 4.9% y/y recorded in 2021).
The decline in growth over the quarter was largely broad based, with only the transport, construction and personal services sectors increasing over the quarter. The electricity supply crisis remains a severe impediment to the country’s growth potential, with aging power plants which are prone to breakdowns, necessary maintenance and elevated levels of criminal activity adding to the country’s precarious energy predicament.
The primary sector of the economy declined by -3.2% qqsa in Q4.22, detracting -0.2% points from the topline reading on the back of decreases in agricultural and mining production of 3.2% qqsa and 3.3% qqsa respectively. “A decline in output was recorded for field crops and horticulture.” according to Stats SA, weighing on the agricultural sector’s performance. Moreover, persistent load shedding and logistical bottlenecks exacerbated by the Transnet strike in October 2022 affected production and export potential, while the fragile global position at the end of last year weighed on commodity demand.
The secondary sector of the market fell by -0.8% qqsa, dragged down by the manufacturing and electricity industries. Manufacturing activity declined by -0.9% qqsa, largely underpinned by the performance of the food beverages segment of the market, while the electricity, gas and water sector declined by -1.9% qqsa. The construction sector however picked up moderately (0.5% qqsa), preventing a larger decline in the secondary sector.
Moreover, the tertiary segment of the economy contracted by -1.2%, with the finance sector falling by -2.3% qqsa and owing to its size of the overall GDP reading detracted -0.6% points from the headline number. The trade sector sliced a further -0.3% points off the top line reading, contracting by -2.1% qqsa, underpinned by diminished economic activity in wholesale trade, according to Stats SA.
The expenditure approach to measuring GDP likewise yielded an outcome of -1.3% qqsa in Q4.22, following Q3.22’s 1.7% qqsa (revised) lift. Export activity declined by a notable -4.8% qqsa and accordingly detracted -1.4% points from the total. Reduced “trade in base metals and articles of base metals; mineral products; and paper and articles of paper”, according to Stats SA was primarily responsible for the unfavorable outcome.
Conversely, household final consumption expenditure (HFCE) which makes up around two thirds of the GDP outcome rose on a qqsa basis, by 0.9%. Specifically, durable goods and services rose by 2.0% qqsa and 1.4% qqsa respectively, adding 1.0% points to the HFCE result, while the non-durable category declined by -0.2% qqsa. Despite this moderate quarterly lift, consumers remain financially constrained, reeling from the rising cost of living. Moreover, unemployment remains critically high, especially in the youth category of the market.
Gross fixed capital formation accelerated to 1.3% qqsa, following Q3.22’s 0.3% qqsa lift. The increase was supported largely by growth in transport and machinery and other equipment, according to Stats SA, while residential building activity declined by -1.6% qqsa. A notable pick-up in business confidence which slid further into depressed territory in Q4.22 is however required to markedly boost private sector investment. Security of electricity supply of electricity, political certainty and an improvement in the ease of doing business is essential in this regard.

Labour Update: unemployment eased to 32.7% in the fourth quarter
28 February 2023
Although it has declined notably from levels logged during the pandemic, it remains at a critically high level.

Erratum: Please note that this article has been corrected since its first publication. The original number of q/q jobs added in the Western Cape was erroneously stated as 333 000, which is the y/y increase. The correct q/q job growth figure in the province was 167 000.
The official unemployment rate eased marginally to 32.7% in the last quarter of 2022 from 32.9% logged in Q2.22. Although it has declined notably from levels logged during the pandemic, it remains at a critically high level, with the labour participation rate at 58.5% evincing the fragility of the South African economy, which is plagued by ongoing rotational load shedding, significantly impeding activity and weighing heavily on confidence and investment.
A “number of persons moved from "not economically active" category to "employed" and "unemployed" statuses between the two quarters” according to Stats SA. The number of persons employed rose by 1.1% q/q ahead of the 0.4% q/q increase in the unemployment category leading to the reduced unemployment reading. Specifically, the number of employed persons climbed by 169 000, with the formal sector of the economy primarily absorbing these individuals.
A disaggregation of the data on an industry basis, indicates that six of the eight industries surveyed within the formal sector (non-agriculture) reported a lift in employment, with only the construction and services sectors logging declines. The trade sector recorded the largest number of job gains over the quarter at 99 000, followed by the finance sector at 54 000. The fourth quarter of the year generally sees a seasonal pick-up in employment, particularly in the tourism, hospitality and related sectors.
The largest increase in employment over the quarter stemmed from the Western Cape at 6.9% (or 167 000) supported by the semigration trend, with an influx of skilled individuals moving to this province. Conversely the Gauteng Province saw employment numbers drop by -0.4% q/q.
The youth category which comprises those aged 15-24 years are the most afflicted segment of the economy. Unemployment in this group rose to an unacceptably high 61.0% in Q4.22, after easing slightly in Q3.22. Improving the quality of and access to education remains essential. According to Stats SA, “of the 7,8 million unemployed persons in the fourth quarter of 2022, as many as 50,4% did not have matric, and 39,5% had completed matric”.
The expanded unemployment rate, (which includes individuals who desire employment regardless of whether they are actively seeking work) declined to 42.6% (from 43.1% in Q3.22) but is a marked 13.9 percentage points higher than the rate logged during the same period in 2008, demonstrating the extent of SA’s unemployment crisis.
A significant pick up in confidence is imperative to drive sustainable growth and accordingly job creation. “Without a reliable supply of electricity, our efforts to grow an inclusive economy that creates jobs and reduces poverty will not succeed,” according to the President (SONA 2023).

Fixed investment: Eskom's debt relief conditions bring hope for economy
24 February 2023
SOEs were a core focus of Finance Minister Godongwana’s budget statement. Given the massive risk that loadshedding poses for SA's economic growth, addressing Eskom's shortcomings is the most urgent priority, and the minister sees the private sector as a key part of the solution
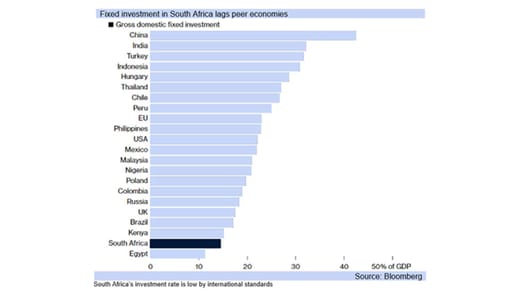
The Budget recognises right at the start that “prolonged power failures and poor operational performance of transport industries continue to hamper operations and investment in manufacturing, mining and agriculture.”
Core to the debt relief tabled for Eskom are the conditions “of key reforms that address the inadequacies of the transmission network and performance of existing power stations, which form part of the following obligatory conditions.”
Eskom, National Treasury and the Department of Public Enterprises will “design a mechanism for building new transmission infrastructure that will allow for extensive private-sector participation in the development of the transmission network.”
“The National Treasury has appointed an international consortium with extensive experience in the operations of coal-fired power stations to review all plants in Eskom’s coal fleet and advise on operational improvements.”
This review concludes mid-2023 with Eskom then required to implement the recommendations including which plants can be resuscitated to original equipment manufacturers’ standards.
National Treasury has appointed an international consortium, reportedly led by Vgbe Energy and includes Dornier Power, KWS Energy, RWE Technology and Steag Energy: well regarded, international power specialist companies.
Accessing National Treasury’s debt relief programme obliges Eskom to concession (transfer ownership and operational control to private companies for) all these power stations with clear targets for the electricity availability factor and operations. SOEs are being assessed for critical necessity, with the state running down its guarantees over SOE debt.
Were it not for the FATF decision on SA's grey-listing weighing on sentiment, markets would likely have rallied on the news of greater oversight and private sector participation in solving the country's power crisis.

Tourism Update: tourist numbers were up 152.6% y/y in 2022
20 February 2023
Income derived from the tourist accommodation industry (accommodation only) grew by 5.1% when measured on a month-on-month seasonally adjusted (mmsa) basis during the month of December

Income derived from the tourist accommodation industry (accommodation only) grew by 5.1% when measured on a month-on-month seasonally adjusted (mmsa) basis during the month of December, this compared to -2.8% mmsa (nominal terms).
Indeed, at R2 128.6 million (seasonally adjusted, current prices), receipts from the accommodation industry are nearing pre-pandemic levels, while hotel occupancy levels rose above 40% (on a seasonally adjusted basis) in December.
Routine data gathered by the Department of Home Affairs’ (DHA) indicates that 2 881 887 travellers (arrivals, departures and transits) passed through South African ports of entry/exit during the seasonally significant month of December, which sees domestic travellers and international holidaymakers flock to South Africa’s tourist hotspots. This represents a 37.7% m/m increase and a 146.1% y/y lift.
Looking at tourist numbers specifically, there was a 157.6% annual increase and a 19.8% m/m lift in December. For the year as a whole (2022), tourist arrivals climbed by 152.6% y/y.
Specifically, those emanating from ‘overseas’ countries rose by 284.0% y/y, with travellers from Europe making up the largest share (around 62.1%). Travellers from the UK reached 283 031 in 2022, followed by Germany (173 146), the Netherlands (90 289) and France (76 077). Moreover, tourists travelling from African nations rose by 126.2% y/y between January and December 2022, with those stemming from SADC countries making up the majority.
The tourism sector remains a key growth area for the country with the potential for significant job creation at all skill levels. Upgrading aging or damaged infrastructure, addressing crime and reducing red tape (amongst others) remain key and are essential to attract investment into the sector and entice travellers.
On the issue of crime, the President in his State of the Nation Address stated that they are “strengthening the SAPS to prevent crime and improving the capacity of the National Prosecuting Authority (NPA) and courts to ensure perpetrators are brought to justice”. Including “ putting more police on the streets and setting up specialised teams that will focus on specific types of crime”.

MPC Update: SARB lifts rates by a further 25bp to 7.25%
26 January 2023
The SARB’s monetary policy committee (MPC) opted to hike the repo rate by 25bp to 7.25%, below consensus expectations of a 50bp lift and the Federal Reserve Bank’s move last month.

The decision was not unanimous with 2 out of the 5 MPC members preferring a 50bp lift in the repo rate.
Inflation globally has eased but remains elevated and this combined with subdued growth continues “to shape global conditions”, according to the SARB. Domestically, inflation has decelerated, but it remains notably above the SARB’s inflation targeting band (3% - 6%). The Reserve Bank’s headline consumer price inflation forecast for 2023 remains unchanged at 5.4% but has increased to 4.8% for 2024 (previously 4.5%).
Overall risks to the inflation trajectory continue to be assessed to the upside. Specifically, although global food prices have decelerated, as evinced by indicators such as the Food and Agricultural Organization of the United Nation’s (FAO) food price indices the SARB has revised local food price inflation up again. Partly “due to the lagged impact of the weaker exchange rate”. Food price inflation is now forecast at 7.3% in 2023 (previously 6.2%) and 4.4% for next year (previously 4.2%).
Moreover, administered price inflation continues to remain an upside risk, with projections for electricity prices higher than at the previous MPC meeting. The energy regulator Nersa recently granted Eskom a 18.65% tariff increase. Indeed, persistent load shedding “may have broader price effects on the cost of doing business and the cost of living”.
Global growth remains lacklustre, specifically, the US’s growth prospects for 2023 have deteriorated, while the “outlook for China has improved but is likely to remain modest by historical standards”. Accordingly, the Reserve Bank has amended its global growth forecast for 2023 to 1.6% from 1.9% previously.
On the domestic front, the economic environment remains fragile. The SARB has pencilled in zero growth for Q4.22, which would equate to a 2.5% y/y rise for 2022, up from its forecast of 1.8% previously on account of a better than anticipated Q3.22 outcome. However, it has markedly reduced its 2023 forecast to just 0.3% from 1.1% at the previous meeting.
Indeed, “the Bank estimates that it deducts as much as 2 percentage points from growth in 2023, compared to the previous estimate of 0.6 percentage points” on account of the heightened load shedding. Indeed, the electricity supply situation in the country is dire, with persistent load shedding weighing on all sectors of the economy, decreasing confidence.
The growth trajectory for 2024 and 2025 has also been revised lower to 0.7% (previously 1.4%) and to 1.0% (previously 1.5%) respectively. These projections incorporate “ongoing high levels of loadshedding, and more modest household spending and investment growth than previously”.
Following revisions to the growth numbers, the SARB has calculated “the risks to the medium-term domestic growth outlook” as balanced.

Trade note: domestic recession not expected this year
25 January 2023
Trade note: while a domestic recession is not currently expected this year, risks abound

A week ago Bloomberg released the economic consensus expectation for South Africa’s GDP growth this year , at1.2% y/y, with Reuters showing the same estimate, and FocusEconomics 1.3% y/y.
Bloomberg’s January consensus also does not show a recession in SA this year, but weak economic growth of 0.3% qqsa (quarter on quarter, seasonally adjusted) for the first three quarters of 2023, and 0.4% qqsa for Q4.23.
The Reuters consensus just differs on Q1.23’s growth, of 0.1% qqsa, with the consensus not seeing a recession in SA this year, or indeed any economists in their forecasts in the Reuter’s Econometer.
Investec forecast GDP growth at the start of January, at 1.1% y/y for this year, but material risks to this include the recent worsening of SA’s electricity crisis, along with Transnet’s rail and port capabilities, which threaten exports.
Globally however, the outlook may improve with IMF MD Kristalina Georgieva saying at the end of last week “although the IMF projects 2023 to be a difficult year and for growth to fall further, we don't expect a global recession.”
Warning the world has been "too complacent around globalization and not admitting … there were winners but … also losers. Not enough was done for … losers, so public support for a global integrated economy weakened."
"Covid and the war in Ukraine taught us … security of supplies matters. Some diversification …, steps to bring the chain of supplies closer, … are a necessity. But we should be careful …. Trade makes us all better off."
The IMF 2023’s global growth forecast is 2.7%, although its WEO (World Economic Outlook) is released early next week, which will give an update on the IMF’s global growth forecast, with the multi-lateral sounding more positive.
2023 is expected to see supply chains strengthen, and associated cost increases slow, while H2.23 sees recovery, from the slowdown in economic growth evident already in H2.22, boosting trade volumes.

Interest rate note: MPC to hike this week
24 January 2023
Interest rate note: the interest rate hike cycle is likely to slow in SA

This week’s MPC meeting is expected to see South Africa’s interest rates hiked again, with both the Forward Rate Agreement (FRA) curve and the consensus economist estimates showing a 50bp lift.
That is, the FRA curve has fully factored in a 50bp hike, but only factored in a 75bp hike at close to 10% chance of it occurring. Only one more hike this year is currently being factored in by the FRAs, 25bp, also in H1.23.
The MPC tends to follow the markets expectations on the day of its meeting, but has historically lent to the hawkish side, although the Fed’s drop down to 50bp move in December will likely be a key influence.
The SARB has maintained a strong stance against high inflation, although it has been under-forecasting CPI inflation, with 2022 coming out at 6.9% y/y versus the SARB’s last forecast of 6.7% y/y.
In May the SARB expected CPI inflation would average 5.9% y/y for 2022, and in July adjusted this to 6.5% y/y, with inflation proving higher in 2022 than expected, and stickier (slower) in coming down.
For 2023 the SARB expect its targeted measures at 5.4% y/y, and is likely to leave its forecast around this rate (we have 5.3% y/y), but aims to achieve a 4.5% y/y outcome, and so pressure will remain for a further rate hike.
The rand has been weakened against the key crosses (including the US dollar) by the fact that the US has hiked interest rates by a larger quantum (4.25%) than SA has (3.50%) to date in the current interest rate hike cycle.
A 50bp hike at the MPC meeting on Thursday will not restore the balance, and even a 75bp lift only temporarily as the FOMC is expected to hike at its next meeting (on 1st February) by at least a 25bp move in its target rate.
The rand could gain somewhat on a 75bp increase in the repo rate instead of 50bp this week, although the ongoing loadshedding remains a substantial, overshadowing negative effect on the domestic currency.

Industrial production note: contracts in SA mainly on electricity crisis
17 January 2023
Industrial production has contracted in Q4.22 to date, as global growth slowed over the fourth quarter, impacting domestic activity.
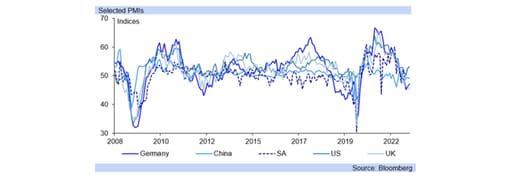
Industrial production has contracted in Q4.22 to date, down by -1.4% for the first two months of Q4.22 versus the same period in Q3.22 (seasonally adjusted), as global growth slowed over the fourth quarter, impacting domestic activity.
The drop in Q4.22’s industrial production activity so far comes on weaker electricity production than in the first two months of Q3.22, down -2.7% on further breakdowns of units, to 56.0% from 58.2% of available electricity capacity (EAF).
The last month of Q4.22 saw SA’s EAF (Energy Availably Factor) fall to 50.4%, heralding an even weaker December than October and November. Mining production fell by -3.7% in the period on the fall in electricity production, as well as the Transnet strike.
The minerals council notes “smelters require sufficient time to ramp down as sudden loss of power will result in catastrophic damage. With loadshedding, smelters … (experience) uncharacteristic trips as they were not designed to operate under these conditions.”
“The adverse operating environment of unreliable and expensive electricity, and a crisis in transport logistics for bulk mineral exports erode the mining sector’s global competitiveness”. This in turn negatively impacts industrial production.
“The mining sector, … smelters and refineries … consume about 30% of Eskom’s output. Eskom will remain a source of baseload electricity supply for the mining industry because solar and wind energy are intermittent.”
“Over the medium to longer term, these uncertainties bode ill for starting new mines”, with “the ability to accurately estimate long-term electricity prices and supply … critical factors in deciding whether to start new project”.
“Confidence in securing reliable and cost-efficient transport and export channels” are also critical, and SA’s collapsing electricity availability is increasingly negatively impacting the industrial production sector.
Little communication has come from government on solving the electricity crisis, with electricity supply from Karpowerships’ blocked by the lack of environmental regulatory approval in SA in H2.22.

SA bond note: inflation key to yields
10 January 2023
SA bond note: the pace of dissipation of inflation will be key to bond yields this year
Listen to the podcast
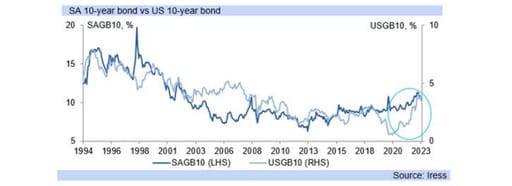
SA’s benchmark government bond narrowed its yield differential with the equivalent US treasury bill, from 8% to 7% over the course of the past year, as inflation rose sharply and Central Bank rates did too, in a generally risk averse year.
Falling inflation and smaller interest rate hikes are likely to be supportive of bond markets this year, particularly lower than expected inflation, with room for downside inflation surprises as price drivers are expected to weaken, although risks persist as well.
SA’s ten year government bond rose by 120bp from start to end 2022, versus the 240bp lift in the ten year US treasury, as the US hiked rates by 4.25%, while SA only saw a 3.25% lift in its rate hike cycle over 2022.
The US has seen wage increases moderate in the latest set of hourly earnings data (for December), halved to 0.3% m/m versus 0.6% m/m in November, and on an annual basis, at 4.6% y/y versus 4.8% previously, and both lower than the expected outcomes.
The slowing in US wage growth began in April last year, in the process of establishing a downwards trend, but is not back at the pre-COVID hourly wage growth rates of 2.0% y/y to 3.0% y/y. The ongoing moderation is supportive of the slowing pace in US interest rate hikes.
The hourly earnings data indicates that the labour market is not necessarily tightening rapidly, but also does not show enough reduction to signal an end to US rate hikes either yet. US yield inversion (10 year vs 3 months) shows markets still fear US recession.
A slower interest rate hike environment will still maintain some pressure on bond yields, expected over H1.23 but US interest rate hikes are likely over the whole of 2023, and evidence of a definite weakening in economic activity is becoming more evident in some areas.
Factory orders contracted in the US in November, by -1.8% m/m, the lowest rate in the past few years, durable goods orders falling by -2.1% y/y. The FOMC notes the rapid slowing in the US economy, providing a more balanced monetary policy view recently.
The February Budget is expected to see SA stick to projected reduced borrowing by its government, but yield strength is likely to be limited in Q1.23, with many risks still concerning investors, not least one of US recession.

Tourism Update: income from tourist accommodation was up m/m in October
12 December 2022
Year-to-date (January-October 2022) there was a 159.4% increase in tourists travelling both from ‘overseas’ and the rest of Africa into the country.

Routine data gathered by the Department of Home Affairs’ (DHA) indicates “that a total of 2 216 962 travellers (arrivals, departures and transits) passed through South African ports of entry/exit in October 2022”. This represents a 2.9% m/m increase and a 121.3% y/y lift.
Looking at tourist numbers specifically, year-to-date (January-October 2022) there was a 159.4% increase in tourists travelling both from ‘overseas’ and the rest of Africa into the country. Travellers from ‘overseas’ regions climbed by 335.5% y/y while those stemming from Africa rose by 129.0% y/y.
Travellers from Europe made up the largest share of “overseas” visitors (around 60%), with those emanating from the UK dominating, followed by Germany, the Netherlands and France. Travel from North America was also buoyant with 233 477 tourists visiting the country between January-October this year, representing a 253.0% annual increase.
Income derived from the tourist accommodation industry has picked up notably benefitting from the uptick in traveller numbers. Receipts grew by a further 54.0% y/y and 10.8% m/m in October to R2.3bn (current prices), not far below pre-pandemic levels (average income from accommodation for October 2017-2019 was R2.9bn).
We anticipate a favourable festive period with travel restrictions eliminated and pent-up demand elevated. International tourism spend remains significant for many operators in the tourism and hospitality sector that relied largely on domestic travellers last year when the Omicron strain prompted a large number of cancellations by foreign tourists.
Indeed, according to the Minister of Tourism this is projected "to be the biggest and boldest summer period yet after the two-year hiatus occasioned by the COVovid-19 pandemic’s lockdowns, restrictions and travel bans.” Persistent, heightened load shedding however remains a downside risk, impeding optimal activity.

Current account deficit narrows notably
8 December 2022
The current account deficit narrowed notably in the third quarter of 2022 to -R18.1bn, from -R107.0bn (revised) recorded previously.

Expressed as a % of GDP, the current account balance eased to -0.3% from -1.6% (revised) in Q2.22.
The outcome was ahead of consensus expectations (of -0.8% of GDP), assisted by a narrowing of the deficit on the services, income and current transfer account to -R251bn, which had reached a historic high in the second quarter of -R358bn. In turn, the deficit declined to -3.7% of GDP from -5.4% of GDP recorded in Q2.22.
The lower deficit stemmed from a markedly “smaller deficit on the primary income account, and to a lesser extent on the secondary income account, while the deficit on the services account increased”, according to the SARB.
The services account is largely comprised of travel related receipts and payments. The air travel and tourism sectors were heavily disrupted by the pandemic. Although the lifting of travel restrictions has seen a significant increase in international tourist arrivals, numbers are still down when compared to pre-pandemic readings.
Conversely, the trade surplus deteriorated further to R233bn in Q3.22 from R252bn (revised) in Q2.22, or to 3.5% of GDP from a prior 3.8% of GDP (revised). “The value of both merchandise exports and imports increased further to all-time highs in the third quarter,” according to the SARB however the value of merchandise imports outpaced that of exports.
Indeed, the global oil price remained elevated during Q3.22 (although below Q2.22 readings) impacting the value of imports. It has subsided (it is currently trading at around $72/bbl), however the final quarter of the year does see a pick-up in the volume of imports as industry prepares for the seasonally significant festive period.
This combined with constrained export potential, as a result of domestic logistical bottlenecks and subdued global demand, could see a further narrowing in Q4.22’s trade balance position. Indeed, October’s merchandise trade account logged a deficit of -R4.3bn, according to data released by SARS. Export activity was heavily impacted by the Transnet strike, which commenced on 6th October, compelling Transnet Port Terminals to declare a force majeure.

Inflation could fall quicker than expected next year
7 December 2022
Commodity currencies: inflation could fall quicker than expected next year, taking some pressure off interest rates
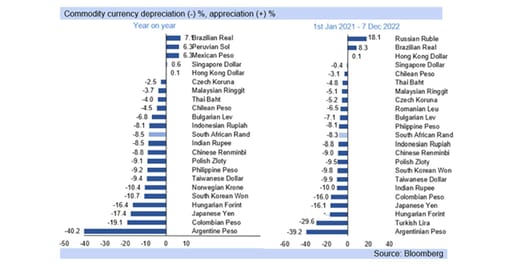
The rand has settled above R17.00/USD, after tumbling on Thursday last week on the release of the Phala Phala report to above R18.00/USD from R16.80/USD, and so lost out on strengthening on Thursday as the Fed’s Governor reduced his hawkish tone.
Commodities prices have dropped since May, on both a year on year and month on month basis (Economist commodities price index), and this will likely continue until at least the second quarter of next year on an annual basis as high base effects fall out of the system.
Global growth has slowed this year, weakening commodity prices overall. This has dulled the exchange rates of commodity exporting countries, although international food prices are bucking the trend, causing some pressure on inflation still, on an annual basis.
On a monthly basis, food prices are volatile, causing some volatility in inflation numbers, which in South Africa’s case, and typically in developing countries and EMs, sees food relatively highly weighted in the inflation basket .
The high cost of living has had a marked effect on real wages (wages less the inflation rate), with International Labour Organization (ILO) annual report on renumeration finding that globally H1.22’s real average monthly wage rate fell -0.9% y/y, the first drop in 15 years.
The U.N. agency’s report said there was little indication of wage increases driving inflation, and instead the fall in average real wages represents the first drop in worldwide living standards in the data’s history.
Furthermore, advanced economies were the worst affected among the G20 economies and the U.N.’s ILO report calculated that real wages had dropped by 2.2% y/y. Additionally, there was evidence of productivity outpacing wages in certain cases.
This adds to a disinflationary (falling inflation) environment, with the UN calling on countries to protect workers from the current cost of living crisis, as falling real wages mean this would not have an inflationary (but rather a disinflationary) effect, while alleviating harsh conditions.
Higher food prices, which are up 54% this year to end November, versus the same period in 2020, are driving food crises in poor countries, while key food exporters benefit from terms of trade and so typically their currencies, although oil importers have faced a suppressing effect.

GDP rose by 1.6% qqsa in Q3.22, ahead of expectations
6 December 2022
Headline GDP rose by 1.6% on a quarter on quarter seasonally adjusted (qqsa) basis in the third quarter of 2022, following Q2.22’s -0.7% qqsa slide.

The outcome was notably ahead of consensus expectations (Bloomberg) of a 0.4% qqsa increase.
Base effects were partly responsible for the quarterly lift, following a dire second quarter performance which was adversely effected by the severe flooding in Kwa-zulu Natal, impeding economic activity.
The increase in growth over the quarter was largely broad based, with only the electricity and personal services sectors detracting from the headline outcome.
The primary sector of the economy rose by a notable 8.2% qqsa in Q3.22, adding 0.6% points to the topline reading on the back of gains in agricultural and mining production of 19.2% qqsa and 2.1% qqsa respectively. “Increased economic activities were reported for field crops and horticulture products” according to Stats SA, boosting the agricultural sector’s performance.
Going forward however, modest “declines in critical crop harvests such as maize, production challenges in the sugar industry, trade friction in fruits, vegetables, beef and wool, as well as widespread foot-and-mouth disease” could weigh on the full year’s performance, according to Agbiz. Moreover, the mining sector remains susceptible to slowing global growth and accordingly demand.
The secondary sector of the market increased by a modest 1.2% qqsa, supported by a 3.1% qqsa lift in the construction sector and a 1.5% qqsa increase in manufacturing activity. The electricity, gas and water segment of the economy however declined over the quarter, on a slide in the consumption of electricity and water. Indeed, the electricity supply situation remains critical, with rotational load shedding a persistent feature.
Similarly, the tertiary segment of the economy grew by 1.1%, with the finance sector increasing by 1.9% qqsa and owing to its size of the overall GDP reading added 0.5% points to the headline number. Additionally the trade sector rose by 1.3% qqsa, aided by gains in “wholesale, motor trade and catering and accommodation”, according to Stats SA. The retail component however disappointed but we anticipate a pick up in sales in Q4.22 supported by the seasonally significant festive season.
The expenditure approach to measuring GDP likewise yielded an outcome of 1.6% qqsa in Q3.22, following Q2.22’s -0.7% qqsa decline, boosted largely by a 4.2% qqsa in export activity, which added 1.1% points to the topline reading.
Conversely, household final consumption expenditure (HFCE) which makes up around two thirds of the GDP outcome fell by- 0.3% qqsa and accordingly detracted -0.2% points from the headline number, dragged down primarily by the non-durable goods category, which declined by -0.8% qqsa (detracting 0.3% points). Indeed, consumers remain financially constrained, reeling from the rising cost of living and declining real incomes.
Government expenditure rose by 0.5% qqsa, moving back into growth territory following Q2.22’s -0.8% qqsa (revised) contraction.
Gross fixed capital formation slowed marginally to 0.3% qqsa in the third quarter. The modest lift was supported largely by “increased investments in residential buildings and transport equipment”, according to Stats SA. However, a -7.2% qqsa decline in the machinery and other equipment category largely cancelled out any gains
A notable pick-up in business confidence which slid further into depressed territory in Q3.22 is however required to notably boost private sector investment. The consistent supply of electricity, political certainty and an improvement in the ease of doing business is imperative in this regard
Indeed, domestically, security of electricity supply remains a key priority. The economy cannot function optimally without access to reliable, affordable energy. Moreover, as a small, open economy South Africa remains highly susceptible to global events, with the slower global growth outlook a significant downside risk.

Inflation note: 6.8% 2022 forecast retains upside risk
29 November 2022
While 2022 will likely see CPI inflation come out at, or very close to, 6.8% y/y the risks are wider for 2023’s inflation rate
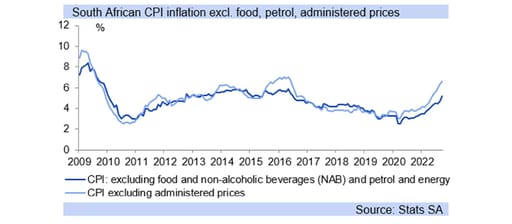
The recent uptick in CPI inflation in October is expected to be short-lived. November is a low survey month while international food prices fell -2.9% m/m and the petrol price only saw a small uptick. However, some broadening in price pressures will likely be evident.
International food prices are a key contributor to local food costs as SA is a price taker for most agricultural foods produced, through either import, or export, parity pricing. Domestically, the start of the 2022/23 crop season has seen strong rainfalls which should boost production.
While excessive rain can be damaging to crops, and there has been some impact from heavy rains and wind, so far it is very small in proportion to the total, while delays in planting are expected to be made up, and yields overall are expected to be robust.
Food prices have come down, and for grains in particular compared to early in the year as the flow of shipping has largely resumed after interruptions in October that drove prices up as Russia temporarily suspended its grain export deal with the Ukraine.
The FAO (Food and Agricultural Organisation of the UN) has warned however that “world cereal stocks are forecast to contract by 2.0 percent below opening levels by the end of seasons in 2023, to 841 million tonnes, down 7.3 million tonnes from last month’s forecast.”
Food prices are expected to remain relatively elevated, although volatility will persist between months and quarters, and be affected by further slowing in global economic activity in H1.23. The high base food price inflation is calculated off in 2023 will have some suppressing effect.
An end to the Russian/Ukraine war is not in sight, and has been a key driver of commodity price volatility and elevation this year, as well as market sentiment and its impact on economic activity, inflation and in particular energy prices.
After a sharp rise this year in energy prices, the Brent crude oil price has dropped over November, from US$98.6/bbl, to US$83.2/bbl yesterday, on concerns over slowing global demand, which has reduced the petrol price increase building for December.
CPI inflation is still likely to come out at 6.8% y/y in 2022, albeit with upside risk. Oil prices could fall further, and the slowdown in China has already weakened prices, while renewed concerns have surfaced in the markets about the severity of the likely global recession.

FOMC minutes: sees rand run stronger
24 November 2022
FOMC minutes note: easing tone from FOMC members over the past few weeks supports rand
The Federal Open Market Committee (FOMC) minutes of the FOMC meeting on 2nd November gave deeper insight into discussions on the US interest rate path, and showed greater support for a slowing in the pace of interest rate hikes, weakening the US dollar.
The softening in the tone amongst most FOMC members in the minutes was in contrast to Chair Powell’s comments at the press conference after the November FOMC meeting, where he portrayed a more hawkish tone, weakening the rand to R18.53/USD from R18.26/USD.
That is, Chair Powell said at the start of November “(a)t some point … it will become appropriate to slow the pace of increases as we approach the level of interest rates that will be sufficiently restrictive to bring inflation down to our 2 percent goal.”
In contrast, the minutes released last night said “a substantial majority of participants judged that a slowing in the pace of increase would likely soon be appropriate”, i.e., the majority of FOMC members used the word “soon” instead of Chair Powell’s “at some point”.
The softening in the tone of most FOMC members not only contrasts with the very hawkish tone of the press conference led by Jerome Powell after the FOMC meeting in early November, but also with the more neutral sounding statement released on 2nd November.
The US dollar consequently weakened sharply on last night’s release of the minutes, and the rand reached R16.91/USD today, from R17.41/USD yesterday, and has been strengthening earlier this month as other FOMC members evinced more dovish tones than Powell.
The FOMC minutes did state “as monetary policy approached a stance that was sufficiently restrictive to achieve the Committee’s goals it would become appropriate to slow the pace of increase in the target range for the federal funds rate.”
But immediately followed it with the sentence that the majority of FOMC members believed that this would happen soon. The markets have noted a shift in the Fed’s tone, which has lowered risk aversion somewhat, particularly given fears of global recession.
The rand has managed to stay below R17.00/USD this morning, after running above R18.00/USD for September and October when bearish sentiment increased on escalating FOMC hawkishness.
However, risks remain, and the signalled terminal (end point of the interest rate hike cycle) has lifted in the last few months, and the FOMC has not yet indicated a reversal, while no projection materials were published in November updating the members rate forecasts.
For South Africa, its MPC meets today, with the FRA curve pricing close to a 90bp lift in the repo rate today over its current level, with October’s worse than expected CPI figures and broadening inflationary pressures likely to keep the SARB hawkish.
The decision is likely to be between a 75bp and 100bp increase in SA today, with the erosion of the differential between US and SA interest rates having had a notable impact on the domestic currency, and so the rand has strengthened on likely future smaller US rate hikes.
To date the US has hiked by 375bp, while SA has hiked by 275bp. The rand strength today in response to the FOMC minutes may aid the SARB to decide on a 75bp hike instead of a 100bp, but the MPC is very hawkish and there is no certainty on its move today.
Much will depend on the SARB’s rand and oil forecasts, as well as expectations on global inflation. Oil prices have subsided recently, at US$85.1/bbl today, down from above US$90/bbl in the first half of February, and most of September and October.
International food price pressures have eased too, although the outlook is uncertain and likely to retain some volatility, with the FOMC signalling continued rate hikes in the foreseeable future, which would widen the differential between SA and US interest rates even further.

PPI update: Annual headline PPI eased to 16.0% y/y in October
24 November 2022

Headline producer price inflation (PPI) for final manufactured goods eased to 16.0 y/y in October from 16.3% y/y logged in September. A decline in inflation within the coke, petroleum, chemical, rubber and plastic products grouping was largely responsible for the annual decline in the headline reading. However, manufactured food price inflation as well as price pressure within the furniture and other manufacturing category also eased.
Specifically, the coke, petroleum, chemical, rubber and plastic products grouping (in which fuel price dynamics are included) and which makes up just under 23% of the PPI basket fell to 31.8% y/y from 34.2% y/y in September and accordingly it added 8.0% points to the headline reading, versus 8.6% points previously.
Indeed, petrol price inflation eased to 25.6% y/y in October from 31.5% y/y previously on a R1.02/litre cut in the petrol price in October. However, the reprieve to consumers was short-lived with a further hike applied in November on the back of the elevated global oil price (during the period the price was determined).
Manufactured food price inflation also decelerated, after climbing notably in September. Specifically, it eased to 15.2% y/y (from 16.4% y/y). Accordingly, the contribution of the food products, beverages and tobacco products’ category to the headline number fell to 2.9% points from 3.1% points in September.
Meat and meat products inflation which makes up a notable portion of the food basket fell to 14.1% y/y in October from a prior 15.1% y/y, bringing down overall food price inflation as did the other food products category which includes sugar. Additionally, the oil and fats segment, a category significantly affected by the Ukraine war has eased considerably with inflation dropping to 35.3% y/y from 50.3% y/y previously.
Conversely the grain mill products, starches and starch products, and animal feeds category experienced an increase in prices over the year. This is in line with the movement of the FAO cereal price index which rose by 3.0% m/m and 11.1% y/y in October.
Specifically, an increase in the maize price “was underpinned by lower production prospects in the United States of America and the European Union, along with dry planting conditions in Argentina and uncertainty about the continuation of Ukraine’s exports”, according to FAO. Indeed, “South Africa is interlinked with the global market and will likely also see higher maize prices in the foreseeable future, despite the optimistic forecasts of the domestic harvest”, according to Agbiz.
CPI update: price pressures broaden as CPI inflation lifts
23 November 2022
South Africa’s food prices rose to the highest food price inflation rate that has been recorded in the current CPI’s history back to 2010.

October’s CPI inflation rate rose slightly to 7.6% y/y (0.4% m/m), from 7.5% y/y in September, above the Bloomberg consensus expectation (of 7.4% y/y) on upwards pressure from food price inflation and also a broadening of price pressures.
South Africa’s food prices rose by 0.9% m/m in October, to maintain a high 12.3% y/y increase for a second month, the highest food price inflation rate that has been recorded in the current CPI’s history back to 2010. The jump in food (and non-alcoholic beverages) prices on the month contributed half of October’s monthly CPI inflation rate.
International food prices rose by 1.4% m/m in October, a key contributor to local food costs as SA is a price taker for most agricultural food produced through either import, or export, parity pricing.
Worryingly, core CPI inflation, which excludes food and non-alcoholic beverage prices as well as excluding fuel and energy costs, rose to 5.0% y/y in October from 4.7% y/y in September.
Second round effects have become more apparent as the year progresses, with the residual category also contributing to the overall lift in the CPI by 0.1% m/m – which further indicates the broadening nature of CPI inflationary pressures in SA.
The SARB will worry that high inflation (inflation above its 4.5% y/y midpoint target) can become entrenched, and both the lift in the core measure and rise in headline CPI inflation in October will add to these concerns.
That is in the latter, the reversal of the downwards momentum that headline CPI inflation has been on since July’s 7.8% y/y drop to 7.6% y/y in August and then 7.5% y/y in September has been interrupted by October’s print today of 7.6% y/y for October.
The SARB discussed a 100bp hike at the last MPC meeting, but instead hiked by 75bp although it may choose to deliver the 100bp increase now at its MPC interest rate decision tomorrow, instead of another 75bp rise, given the deterioration in the inflation figures today.
Indeed, a large degree of uncertainty remains for the outlook. Price inflation increased in October in some other countries as well, with volatility in commodities prices likely to persist on the high levels of uncertainty.
The ongoing Russian/Ukraine war, severe Covid lockdowns in China on its economic activity and concerns over global economic growth all add to the high levels of uncertainty, which will also worry the SARB as it targets inflation over the next six to twenty-four months.

Mining and manufacturing sectors expected to contribute positively to Q3.22 GDP
9 November 2022
Measured on a quarter-on-quarter seasonally adjusted (qqsa) basis, mining output increased by 2.2%.

Mining production fell by a further -4.5% y/y in September, following August’s -6.4% y/y slide, below consensus expectations (Bloomberg) of a -4.1% y/y decline. Measured on a quarter-on-quarter seasonally adjusted (qqsa) basis however mining output increased by 2.2%.
A decrease in production of iron ore and gold, which together detracted -4.8% points from the topline reading, on the back of contractions of -23.1% y/y and -12.4% y/y respectively were largely responsible for the annual decline in mining production.
Demand for iron ore, an essential input into steel production continues to be afflicted by the weakening global environment. Indeed, the JP Morgan Global Manufacturing PMI slid below 50.0 in September, with a further decline in output and new orders logged. While the results from the S&P Global Steel Users PMI Survey for October revealed that the US and Europe saw the “steepest fall in demand since May 2020”.
Additionally, domestically, the energy intensive mining sector continues to deal with logistical challenges, while persistent, heightened load shedding, which was particularly severe in September, reaching stage 6 at times remains a key operational hinderance.
September’s electricity production and consumption numbers published by Stats SA show that generation fell by a marked -8.2% y/y and by -6.9% month-on-month seasonally adjusted (mmsa), while electricity distributed declined by -7.5% y/y and -7.7% mmsa. Indeed, Eskom’s Energy Availability Factor (EAF) is below 60.
September’s manufacturing production reading surprised on the upside, coming in at 4.9% mmsa and 2.9% y/y, notably ahead of market expectations of a -2.4% y/y slide, this despite the severe load shedding experienced during the month. Measured on a quarter-on-quarter seasonally adjusted (qqsa) basis manufacturing output increased by 1.9%.
This is also in contrast to the results of the seasonally adjusted (SA) headline Purchasing Managers’ index (PMI) which moved back into contractionary territory in September underpinned by a sharp fall in the business activity and new sales orders sub-indices (the export index recorded its fourth consecutive decline in September).
A break-down of the manufacturing production numbers indicates that the motor vehicles, parts and accessories and other transport equipment subsector was the largest contributor to the headline number, adding 3.7% points on the back of marked growth of 43.2% y/y, while the food and beverages category added a further 1.9% points (on growth of 8.1% y/y). The reopening of Toyota SA’s plant in Durban in August following damage caused by the April KZN floods will have boosted automotive capacity, while an easing of semi-conductor supply issues is also supportive.
Advance indications provided by October’s Manufacturing PMI survey results show that while the headline reading moved back to 50.0 (from 48.2 in September), business activity and new sales orders remained subdued, while expectations of business conditions in six months’ time deteriorated. Moreover, the employment index worsened, dropping to its lowest reading in two years. Continuous load shedding and logistical bottlenecks continue to detract from fixed investment, hindering growth and job creation.

Oil price likely to run above US$90/bbl
9 November 2022
The oil price likely to run above US$90/bbl for the remainder of this year and a large part of next year, driven by OPEC+
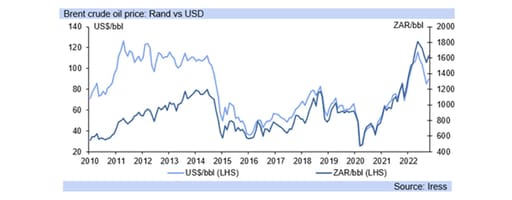
After oil prices dropped since June on average, resulting in several months’ worth of fuel price cuts in SA, the recent increase has now seen petrol and diesel price increases this month, and further price hikes building for December too, with the rand stable and not a contributor.
That is, for the oil price in rand terms there has been a similar trajectory, with the rand’s exchange rate reflective of sentiment in global financial markets, and the movement’s in the US dollar, and the latter stabilising over October, then weakening in November.
Markets have been gaining cheer recently on building expectations that the US will not see a severe recession, and that its interest rate hikes have been fairly easily absorbed in a strong labour market, while the pace of average hourly earnings (y/y %) subsiding since April.
A slowdown in the quantum of US rate hikes is expected by December, with markets factoring in a 50bp instead of a 75bp lift. Progress on suppressing wage growth is also seen in US unit labour costs, which have fallen since June, and markets are becoming less risk averse.
The rand has consequently strengthened against the US dollar, reaching R17.66/USD today, from R18.41/USD after the FOMC meeting last week, although still not enough to counter higher oil prices, with December currently factoring in a R1.35/litre petrol price hike.
The Brent crude oil price is lower, at US$94.6/bbl, compared to the average for the year to date of US$101/bbl, but in rand terms it is at R1 690/bbl currently, higher than the average for the year so far of R1 639/bbl, with OPEC+ now supporting the oil price above US$90/bbl.
OPEC+, which includes Russia, has been supporting the oil price by cutting quotas on supply, and has lifted the level from US$75/bbl a few years ago, and with reductions in carbon emissions over the longer-term, as OPEC+ continues to seek to maximize returns.
Typically when economic cycles slow down, commodity prices do too, as demand weakens, allowing for lower inflation and then interest rate cuts on a significant cycle, but high, and rising oil prices, have not allowed for a rapid subsidence in inflation.
Falling fuel prices pulled SA inflation down since July, but this effect wore out in November and now likely will continue in December, which will slow the descent in inflation this year and into next, as high energy prices support slower pace of disinflation (falling inflation).

FOMC note: rand sees slight reaction to FOMC
3 November 2022
The widely anticipated 75bp hike last night was accompanied by a statement that the terminal rate will be higher than previously expected
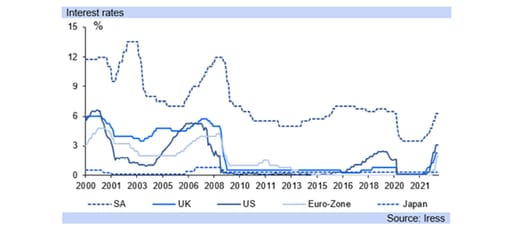
The Federal Open Market Committee (FOMC) raised its target range for the federal funds rate to 3.75% - 4.00% (75bp higher) last night as expected, stating “we continue to anticipate that ongoing increases will be appropriate to attain a stance of monetary policy that is restrictive."
The tone of the FOMC became more hawkish, with FOMC members raising their interest rate hike expectations again, and the Fed highlighting that “incoming data since our last meeting suggest that the ultimate level of interest rates will be higher than previously expected.”
This was not balanced by the repeated communication from the last two meetings that “at some point it will become appropriate to slow the pace of increases, as we approach the level of interest rates sufficiently restrictive to bring inflation down to our 2 percent goal”.
Markets found relief in both the expected hike materialising, and the likelihood that future hikes would be 75bp or lower in size, although the FOMC added on its expected terminal rate (level of last hike in the cycle) “there is significant uncertainty around that level of interest rates”.
The tone did not become less hawkish as was hoped, and decidedly held the line on its “overarching focus which is using our tools to bring inflation back down to our 2 percent goal and to keep longer-term inflation expectations well anchored”.
Adding “reducing inflation is likely to require a sustained period of below-trend growth and some softening of labor market conditions. Restoring price stability is essential to set the stage for achieving maximum employment and stable prices in the longer run.”
“The historical record cautions strongly against prematurely loosening policy”. This is particularly significant, as the FOMC aims to move to restrictive monetary policy, and then stay there for a while, avoiding a premature move to neutral or loose monetary policy.
This means both higher interest rates for longer, and a higher level of interest rates than was previously indicated by the September dot plot graph which showed a peak (terminal rate) of 4.75% to 5.0% next year. The December FOMC meeting will yield a new dot plot graph.
The rand has weakened to R18.46/USD in response, from a close of R18.26/USD yesterday, with FOMC highlighting that it will “stay the course, until the job is done” in “returning inflation to our 2 percent objective.”
We continue to expect that SA will hike its interest rates by 100bp on 24th November, with the Federal Reserve Bank hiking by 3.75% so far in the current cycle, and the SARB only by 2.75%. The MPC’s last meeting this year is in November, but the FOMC meets again in December.
The FOMC communication signals it does not feel ready to slow the pace of rate hikes from 75bp per meeting, and could likely do so again on 14th December, and allowing for a further hike at its next meeting following around six weeks on (likely 1st February 2023) of 75bp.
By the end of the year the FOMC likely have hiked rates by 5.50% in the current cycle, and SA by 4.75%, with the MPC likely to discuss a larger hike than 100bp in November particularly given the higher end rate now signalled by the FOMC, and so could surprise on the upside.
The fed fund futures will likely rise somewhat, as markets digest the FOMC statement and Fed Chair Powell’s comments to the press over this week, lifting the expectation for the December rate hike towards 75bp, and placing the rand at risk of further weakness.

Britannia un-Trussed – Britain heads for third PM this year
20 October 2022
Following a chaos-strewn 45 days as prime minister, Liz Truss stood down today, stating that she could not deliver the mandate on which she was elected by Conservative Party members. Indeed, even the past week has been filled with turmoil, starting with the sacking of Chancellor Kwasi Kwarteng last Friday and culminating yesterday in the departure of Home Secretary Suella Braverman and total confusion among Tory MPs in the House of Commons over a vote on fracking.
By contrast with the political situation, conditions in markets have calmed down over the past week or so. At the time of writing, ten-year gilt yields are 43 basis points lower since last week’s close and 30-year yields down 81 basis points – helped by the Bank of England stating that for now, it will not sell gilts of more than 20 years’ maturity in its Quantitative Tightening operations, which it plans to start from 1 November. Sterling is also a touch higher, at $1.1260.
The critical point here is that new Chancellor Jeremy Hunt acted quickly to reassure markets on Monday morning, making it clear that he would jettison almost all of Kwarteng’s unfunded tax cuts, saving £32bn per annum. He also announced that Truss’ plan to freeze the domestic energy price cap at £2,500 would be curtailed from two years to six months, with a (yet to be decided) more targeted scheme to replace it in April next year. Furthermore, Hunt stated that additional painful decisions need to be made both in terms of taxation and public spending.
The Budget on 31 October has therefore become a critical event. Interest rate markets have rallied to price in a lower peak in the bank rate, from 6.25% in late September to a touch above 5.00% now, but after the events of the past month and a half, the reputation of the UK remains on the line. While credibility is easily lost, it can take a very long time for it to be regained. In this respect, markets will consider it essential for the chancellor to be able to carry through his plans to bring the UK back on course to meet its fiscal rules.
The party intends that the leadership contest is completed by 28 October. It has also been indicated that the full party membership will be involved. The rules of the contest have yet to be made public but our suspicion is that a high bar in the number of supporting MPs will be needed for a potential candidate to enter the contest. Indeed, Chairman of the 1922 Committee Sir Graham Brady conceded it was possible that only one candidate might emerge. We note that the bookmakers’ favourite is former Chancellor Rishi Sunak who came second to Liz Truss in the vote among members, but who topped the poll among Conservative MPs. However, other names such as former PM Boris Johnson have also been mentioned.
In short, further information will emerge in due course, and the situation is very fluid. However, it should be noted that the Tories are on the backfoot and on average trailing Labour in the polls by around 30 percentage points. Hence, we would expect the party to try to paper over the cracks of its own disunity in order to avoid potential electoral annihilation. The next general election is not due until 2024, which the party will hope will give it time to turn public opinion around.

CPI update: on course to average 6.8% y/y this year
19 October 2022
CPI inflation came out at 7.5% y/y (0.1% m/m) in September, below the Bloomberg consensus expectation (of 7.6% y/y) and aided by the cuts in fuel prices.

The outcome was also lower than August’s 7.6% y/y (July 7.8% y/y), and October’s CPI inflation reading is expected to at 7.4% y/y.
Core CPI inflation rose to 4.7% y/y, from 4.4% y/y. Second round effects have become more apparent with March 2021’s core reading at 2.5% y/y and then on an upwards trend since. Core inflation excludes food and non-alcoholic beverages, fuel and energy prices from the CPI.
The rise in core inflation indicates the broadening in inflationary pressures, and the SARB will worry that high inflation can become entrenched. The SARB is expected to hike interest rates on 24th November after the Fed does on 2nd November, with SA likely to deliver a 100bp increase instead of the 75bp rise it has put through at its last few meetings.
Since June 2021, the US has had higher inflation outcomes than SA, which is an unusual phenomenon historically, but due in part to the US’s high integration into the global supply chain.
The US is a large, open economy (the largest in the world) with high consumer demand, and the flow of goods to it was disrupted by the dislocation of global supply chains, resulting in significant price elevation. The UK similarly sees higher CPI inflation than SA, at 10.1% y/y in September (US 8.2% y/y).
Indeed, globalisation, or the interdependence on cross-border trading in goods and services as well as technology, information and investment flows, had all contributed to lowering inflation in general since the 1980’s for most countries, while deglobalisation has, in turn, raised price inflation.
Pressure on supply chains since the pandemic, is not fully unwound yet, while the US has also had the release of pent-up demand, and a strong labour market which has contributed to both demand led and supply push inflation this year and last.
Countries which produce more of the goods they consume, particularly for bulk commodities such as food, tend to have less severe inflation rates, while those with higher rates of inflation such as the US, UK and EU tend to have to import more of what they consume. High freight costs also bolster inflation.
The unwind in generally high inflation is likely to take time however, again due to the lagged effects mentioned for shipping costs and price inflation, and so it will take time for SA’s inflation rate to fall back below that of the US, UK and the EU.

Mining update: mining output falls by -5.9% y/y in August
13 October 2022
Demand for iron ore, an essential input into steel production continues to be afflicted by the deteriorating global environment.

Mining output fell by a further -5.9% y/y in August, following July’s -8.2% y/y (revised) contraction. The outcome was slightly ahead of consensus expectations of a -6.9% y/y decline (Bloomberg).
A decrease in production of PGMs, gold and iron ore, which together detracted -8.1% points from the topline reading, on the back of contractions of -12.9% y/y, -17.4% y/y and -15.2% y/y respectively were largely responsible for the annual decline in production.
Demand for iron ore, an essential input into steel production continues to be afflicted by the deteriorating global environment. Specifically, the IMF recently downgraded its global growth projection to 2.7% for 2023, which is “0.2 percentage points lower than the July forecast—with a 25 percent probability that it could fall below 2 percent”.
Indeed, the JP Morgan Global Manufacturing PMI slid below 50.0 in September, with a further decline in output and new orders logged. “Barring the pandemic lockdown months in the first half of 2020, the latest decline was the steepest since 2012”, according to S&P Global.
Moreover, continued monetary tightening by the Fed to contain inflation has boosted the greenback and concomitantly weighed on precious metals. Specifically, the gold price is down markedly from levels attained earlier on in the year when it reached over $2000/0z (March 2022).
Notwithstanding concerns over a precarious global outlook, domestically, the mining industry continues to face additional challenges. Persistent load shedding is a key impediment for the energy intensive mining sector. Additionally, logistical constraints continue to weigh heavily on industry participants.
Declining productivity, vandalism and inadequate maintenance of infrastructure, “onerous government procurement rules” and in the case of railroads “idled locomotives bought in a corrupt transaction”, continue to impede operating conditions and severely impact export potential.
A decrease in onerous red tape, provision of stable electricity supply, improving policy transparency and certainty and tackling the significant crime situation in the country are some of the key challenges that need to be resolved to boost confidence and drive sustainable investment.

Falling Transnet capacity weakens economy
11 October 2022
Trade note: falling Transnet capacity weakens economy, while persistent strike action risks a contraction for Q3.22
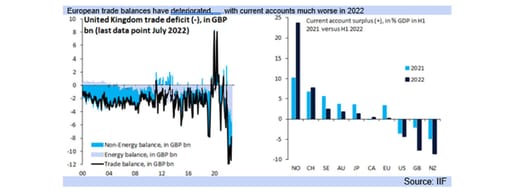
South Africa’s terms of trade have collapsed, after peaking in the middle of last year, with the current reading back at 2019 lows (excluding April 2020), as growth in imports accelerated this year, while the pace of export growth has slowed substantially.
High energy prices have been a key driver of the jump in the value of imports this year, while the growth in mineral exports slowed substantially, with miners also reporting the deteriorating performance of Transnet to transport bulk commodities a key constraint.
The Minerals Council highlights “crime and cable theft (1,500km copper cable stolen in 5 years), onerous government procurement rules, vandalism, idled locomotives bought in a corrupt transaction, poor maintenance, falling productivity at rail and at ports”.
The Council further emphasises that the “cost of deteriorating logistics performance remains high” and the “2022 performance year-to-date actual versus target opportunity cost of ~R50 billion” and Treasury forfeiting ~R3 billion in taxes or R6 billion considering optimized target."
“At current export rates on dedicated TFR … (Transnet Freight Rail) iron ore channel, exports will be 51Mt in 2022, 8Mt lower than target and 9Mt below nameplate … (full production and export) capacity”. The current Transnet strike, on its own, risks pushing SA into recession.
Falling rail and TPT (Transnet Port Terminal) export performance also weakens Transnet’s finances, increasing the burden on the state for providing financial assistance and bailouts, with the State’s finances not recovered from the damage of years of state capture.
Reliable private sector service and infrastructure provision on rail and port services is needed, with regulatory and other hurdles smoothed. Load shedding has also been a key constraint in SA’s export ability this year, as has some weakening in global demand in some areas.
“Economic activity is slowing down in all three major economies - Europe, which has been hit hard by high natural gas prices, China, where housing volatility and Covid-19 disruptions are dragging down growth, and the U.S., where interest rate hikes are starting to bite." IMF
The World Bank and IMF warned this week “of a growing risk of global recession” Uncertainty over energy supplies has already dampened consumer and business sentiment, and slowed economic activity in Europe, with the region SA’s second largest trade partner.

Income from tourist accommodation grew by 140% y/y
29 September 2022
Income derived from the tourist accommodation sector (at current prices) rose sharply year-on-year on base effects, intensified by the riots and unrest that took place during July 2021.

Specifically, it climbed by a marked 140.0% y/y in July, following June’s 61.4% y/y rise.
Indeed, the unrest which occurred predominantly in Kwa-Zulu Natal, a popular tourist destination, coupled with the tighter lockdown restrictions imposed during that period (late June – 25th July 2021), prohibiting interprovincial leisure travel to and from Gauteng, weighed heavily on the already battered sector.
A disaggregation of the headline reading indicates that the hotels segment of the market was largely responsible for the notable uptick, with hotel occupancy rates having picked up significantly (although they remain below pre-COVID levels).
Indeed, tourist arrival numbers are up notably as indicated by the tourism and migration figures published by Stats SA. Specifically, year-to-date (January – July 2022) the number of ‘overseas’ tourists entering the country rose by 430.3% when compared to the same period last year.
Visitors from Europe made up the largest share of overseas travellers, specifically those from the UK, while the number of tourists from North America have also increased notably.
While domestic travel remains imperative and will continue to support the tourism industry, international tourism spend is vital for many domestic operators.
South Africa’s tourism industry has a way to go before it returns to pre-pandemic levels and continues to face a number of headwinds. Indeed, capacity constraints and heightened costs continue to plague the airline industry. While heightened load shedding and logistical constraints impede local operators.
Growing South Africa’s tourism sector however remains a key priority of Government. It has a “deep and wide value chain” and “by the very nature of its geographic distribution and low barriers to entry, tourism also generates economic activity, SME opportunities and employment for low- and semi-skilled workers in rural and remote areas with the greatest need”, the deputy Tourism Minister highlighted in a recent keynote address.

Annual headline PPI eased to 16.6% y/y in August on a moderation in fuel prices
29 September 2022
PPI update: Headline producer price inflation (PPI) for final manufactured goods eased to 16.6 y/y in August from 18.0% y/y logged in July.

Headline producer price inflation (PPI) for final manufactured goods eased to 16.6 y/y in August from 18.0% y/y logged in July. The outcome was below consensus expectations (Bloomberg) of 17.5% y/y. Measured on a month-on-month basis PPI fell by -0.5%.
The coke, petroleum, chemical, rubber and plastic products grouping which makes up just under 23.0% of the PPI basket saw prices decelerate to 37.6% y/y from 42.8% y/y in July. Accordingly, this sub-group, in which fuel price dynamics are captured added 9.4% points to the headline reading, versus 10.5% points in July.
Petrol and diesel price inflation eased to 44.4% y/y and 58.0% y/y respectively in August from a marked 61.9% y/y and 69.9% y/y recorded in July. Additional petrol and diesel price cuts were implemented in September with a further decline in the petrol price building for October, according to data from the Central Energy Fund (CEF), on the back of the lower global oil price.
Manufactured food price inflation however continued on its upward trajectory in August, increasing by 15.4% y/y from 15.1% y/y previously. Owing to its size in the PPI basket (26.65%) the food products, beverages and tobacco products’ category added a further 3.0% points to the headline reading.
Meat and meat products inflation rose by 14.0% y/y from a prior 13.8% y/y. According to Agbiz, the direction of meat prices “remains uncertain” and the “broad meat price trend will be dependent on the developments in the beef market”. Specifically, the current foot-and-mouth outbreak is immense, “to an extent that we might see a decline in slaughtering in major feedlots”, keeping prices of red meat higher.
Grain mill products inflation however eased slightly to 24.4% in August from 24.8% y/y previously, while the oils and fats sub-category, another commodity group that has been heavily impacted by the war in Ukraine remained elevated but decelerated notably to 54.2% y/y (64.9% y/y previously).
Indeed, prices of grains and oilseeds, which have been key “drivers of the surge” in food inflation “are starting to soften, which shows in the global indices”, according to Agbiz. Specifically, the Food and Agriculture Organisation of the United Nations’ (FAO) food price index fell for the fifth successive month in August.

PSCE rose to 7.9% y/y in August, ahead of expectations
29 September 2022
Private sector credit extension (PSCE) grew to 7.9% y/y in August from 7.1% y/y previously, largely on the notable year-on-year increase in credit extended to the corporate sector.

Private sector credit extension (PSCE) grew to 7.9% y/y in August from 7.1% y/y previously, largely on the notable year-on-year increase in credit extended to the corporate sector. The result was ahead of consensus expectations (Bloomberg).
Specifically, credit uptake by corporates which makes up 55% of total credit extended accelerated to 8.5% y/y from 7.0% y/y recorded in July.
The unsecured segment, comprising mainly general loans and advances rose by a further 17.0% y/y (from 12.8% y/y previously), while mortgage advances which makes up around 23.0% of corporate credit uptake increased to 3.8% y/y, from 2.6% y/y in July. Indeed, sentiment amongst builders in the non-residential category of the market increased notably in Q3.22, according to results of the FNB/BER Building Confidence survey (albeit off a very low base).
Household credit demand eased slightly to 7.1% y/y in August, from 7.2% y/y previously. Mortgage advances which comprise around 60.0% of all household credit grew by a further 7.0% y/y and 0.7% m/m in August, despite the notable pick-up in interest rates this year. Bond originator Ooba commented that notwithstanding “changing market conditions, we anticipate steady activity in the home buying market, largely driven by ongoing competition between the banks”.
Moreover, instalment sales credit which makes up an additional 18.0% of credit afforded to households rose by a further 9.0% y/y, this is in line with the strong performance of new vehicle sales. Specifically aggregate domestic new vehicle sales rose by 14.2% y/y in August, according to NAAMSA.
General loans and advances and overdraft credit also increased in August by 6.5% y/y and 3.1% y/y respectively (from 6.0% y/y and 2.7% y/y in July), with many financially constrained consumers relying on debt to fund the spiraling cost of living. Household debt to disposable income increased to 64.6% in Q2.22, according to the latest quarterly bulletin.

Economic growth: heightened uncertainty around the growth outlook
6 September 2022
South Africa expected to see economic growth of 1.9% y/y this year, but risks abound
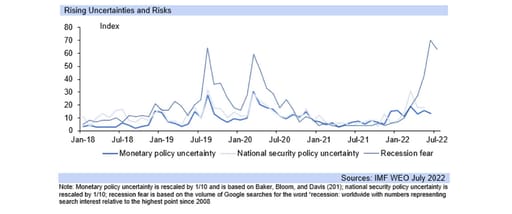
South Africa remains on course so far for a GDP growth outcome of 1.9% y/y this year from the data published so far, but there is heightened uncertainty, given the persistence of the Ukraine war, supply chain pressures and slowing global growth.
Escalating sanctions against Russia are having substantial spill over effects on the global economy, due to the highly connected nature of its external trade in commodities and some manufactured goods, which has substantially increased the economic risk.
We continue to expect a low probability of a wider escalation of military conflict, into NATO regions given the strength of the NATO, alliance and so a large degree of unlikelihood of WWIII, with the ‘weaponising of sanctions” occurring instead.
Russia is the 11th largest economy in the world, but the largest exporter of gas, and the second largest oil exporter. The globalisation (free trade) of the production and export of goods (and services) has been the major driver of low inflation and economic growth since the 1980s.
Commodity prices then spiked up on the advent of the Russia/Ukraine war in February, but then subsided in most cases, with the exception of energy prices which have largely remained high, particularly the price of natural gas, as Russia reduces supply.
Despite the lift in metals and minerals prices in Q1.22, and still high coal prices, South Africa’s mining sector contracted by -2.1% qqsa in Q1.22, and by -3.5% qqsa in Q2.22, after dropping by -1.1% and -3.2% in Q3.21 and Q4.21 respectively (all in real terms).
The contribution of SA’s mining sector to GDP has been negative since Q3.21. SA’s rail system has not coped with elevated demand, and even normal levels at times, with criminal activity noted in the stripping of rail infrastructure, particularly for scrap metal sale.
The EU is at high risk of falling into recession already in H2.22, with the region the largest economic bloc in the world, as it grapples with energy shortages with Russia reducing supply, expected in retaliation to Western sanctions, and winter rapidly approaching for Europe.
High inflation is also eating into disposable incomes around the world on the back of high inflation, reducing real expenditure and negatively affecting economic activity, as are higher interest rates, with H1.22 likely to prove better than H2.22 for the global economy.

Inflation note: for SA, Q3.22 still likely to be the peak
2 September 2022
For South Africa, price pressures are likely to decelerate over Q4.22, starting in Q3.22
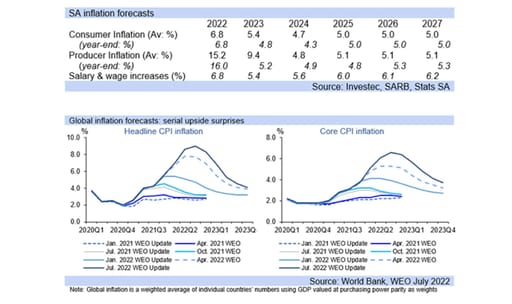
A global recession is increasingly seen as likely in 2023, driven by higher interest rates, the dulling effect of high inflation on economic activity, particularly higher energy prices, while the Russian/Ukraine war drags on and real disposable incomes shrink.
Already, the Euro-bloc saw economic confidence drop to its lowest level since early 2021, when the world was beginning to recover from the pandemic, as record high inflationary pressures and energy supply constraints push the region closer to a recession.
Specifically, Euro-area economic confidence fell in August, most markedly for industry and services’ sectors on fears the energy supply crunch will weaken production while high inflation dents demand. For the Euro-area ,CPI inflation is at a high of 9.1% y/y (4.3% y/y for core).
In August, consumers were more pessimistic on the outlook than in the pandemic. Warnings that Europe is already in recession are also emerging, with Germany, the region’s largest economy, seeing contractions in manufacturing production, and private-sector activity overall.
Inflation in Germany has risen to 7.9% (8.8% y/y harmonised), the highest since the inception of the euro, prompting calls for substantially higher interest rates while its economy is slowing markedly. As is common around the world, food and energy prices were the key drivers.
Germany has been providing a fuel rebate as part of its government relief measures, along with very low public transport costs to assist in climate change goals, but both measures will soon expire, adding further upwards pressure to prices.
Euro-area inflation is at 9.1% y/y, and the ECB sees Germany’s inflation rate reaching 10% y/y in Q4.22. Supply chain costs have come off but the IMF warns “the inflationary impact of shipping costs will continue to build through the end of 2022”.
“Shipping costs are an important driver of inflation around the world: when freight rates double, inflation picks up by about 0.7 percentage point. … the effects are quite persistent, peaking after a year and lasting up to 18 months”.
“This implies that the increase in shipping costs observed in 2021 could increase inflation by about 1.5 percentage points in 2022.” While the descent in inflation is expected to be slow, a significant recession would quicken the fall, particularly a collapse in oil prices.

Industrial production note: substantial downwards pressure on Q2.22 GDP
11 August 2022
Industrial production fell by -4.4% qqsa in Q2.22 indicating substantial downwards pressure on GDP
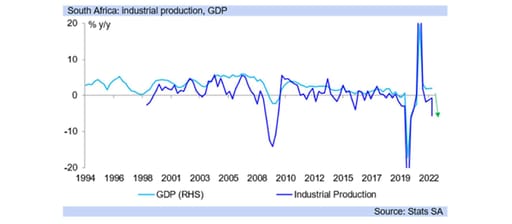
Industrial production contracted in Q2.22 by -4.4% y/y (seasonally adjusted), heralding sharp downwards pressure on GDP. We expect GDP to contact by -0.8% qqsa (quarter on quarter, seasonally adjusted) in Q2.22, following damaging loadshedding and the KZN floods.
Mining, electricity and manufacturing production fell by -3.3% qqsa, -3.1% qqsa and -5.5% qqsa respectively (-2.0% qqsa, 6.9% and 4.6% qqsa in Q1.22), with weakening metal prices a key drag on the rand value of mining production and export activity.
Metals’ prices were down -9.0% qqsa in Q2.22 (Economist metals commodities index ), after gaining 25% qqsa in Q1.22, but Q1.22 saw SA experience difficulties in transporting its bulk goods for export, while external demand for some products waned in Q2.22.
Specifically, global growth forecasts were revised lower in Q2.22, negatively affecting metals, as risk-off permeated financial markets, worsened by the severe COVID lockdown restrictions in China on its economic activity, with March the high in metals’ prices this year.
July also proved a weak month for metals’ prices, down -8.2% m/m and -29.2% lower on a year ago, and against the first month of Q2.22, metals’ prices fell a hefty -23.2% in July, heralding a weak quarter start for Q3.22.
It is still early in the month for August, but to date SA’s key export, coal has seen a -3.3% price drop compared to the same first few days in July, at USD384/MT currently, versus USD419/MT in March, experiencing volatility but generally dropping over Q3.22 so far .
For GDP Q2.22 overall, other economic indicators also show a drop, with retail and wholesale trade sales, (seasonally adjusted and in real terms i.e. measured as GDP is), falling -0.3% and -21.1% respectively for the first two months of Q2.22 versus the first two of Q1.22.
Building completions rose by 56% (seasonally adjusted) for the first two months of Q2.22 versus the first two of Q1.22, but have only a 2.6% weighting in GDP. For the same period, building plans passed fell -15.6% as higher interest rates dulled the outlook for construction.
Industrial production (made up of mining, manufacturing and electricity production) accounts for 20.5% of GDP, while the trade sector (retail and wholesale, plus accommodation catering etc.) accounts for 13%. SA currently looks like it is on track to for growth of 1.9% y/y this year.

Commodity currencies: moderating prices will weaken inflation
10 August 2022
There is currently the potential for slightly lower inflation this year than previously expected
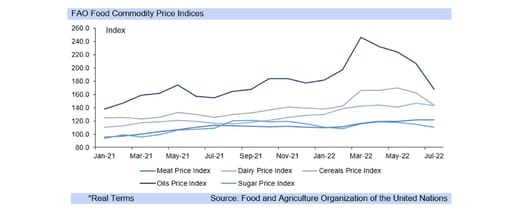
Food price inflation at the commodity level has continued to move lower, driven largely by grains, which is still expected to exert some downward pressure on PPI inflation figures in Q3.22, and so on CPI inflation in particular in Q4.22 for South Africa.
Falling food and energy prices since the end of Q2.22 have contributed to a moderation in commodity prices overall on the month, with gasoline prices down -15.2% and Brent crude oil -12.8%, and so large petrol (R2.72/litre) and diesel (R2.48/litre) price cuts building for SA.
With the fuel prices adjusted on the first Wednesday of the month, this will place subduing pressure on the CPI inflation rate next month. However, in July the state did not pass the full amount of the over-recovery through, only delivering around half, which remains a risk.
Fuel prices could be flattish to slightly lower in Q3.22 versus Q2.22, depending on the actual price changes at the pump, as fuel prices in SA remain state administered prices. To date August and July’s drop in petroleum product prices have overshadowed rand weakness.
However, it should be noted that fuel prices are still higher compared to a year ago, which will support inflation to some extent as the headline measure is based on year on year changes, and so a collapse in inflation is not likely, just a moderation over H2.22.
The petrol price is running at R25.42/litre in August and the diesel price at R24.52/litre, versus R18.30/litre and R15.64/litre in the respective months in 2021. Globally, commodities’ food prices are still elevated y/y, up 8.2% (Economist food commodities price index).
Transport costs are up 20% y/y in SA, with fuel costs 45.3% y/y higher than a year ago, while food price inflation is 9.0% y/y (all latest data – published for July). Q3.22 is expected to begin to see some moderation in inflation, but price pressures have become broad based.
Higher fuel costs have pushed up transport, and so production, costs generally, while retailers have also faced higher input costs, with salary and wage increases rising as inflation has, contributing to wider price pressures, which will slow disinflation (the drop in inflation).
Lower international gasoline prices, if sustained, will have an impact on the likely outcome for SA’s CPI inflation rate for 2022, potentially moving it towards 6.6% y/y from a previous expectation of 6.9% y/y, if September sees the large fuel prices currently scheduled.

Inflation note: likely to slow into Q4.22
3 August 2022
Inflation price pressures continue to become more broad based, but there is also evidence that Q4.22 will see slowing inflation

Consumer price inflation has risen rapidly in Q2.22 for South Africa, from 5.9% y/y to 7.4% y/y, still below June’s US CPI inflation of 9.1% y/y, but July’s figures are expected to see a halt in the severe rising pressure on inflation rates for both areas.
July’s CPI inflation rates are still likely to be high, with the US near 9.0% y/y, and SA close to 7.5% y/y, but not accelerating in the big jumps experienced in Q2.22 for SA, and indeed subsiding somewhat in the US in July, to a market consensus of 8.8% y/y.
The US looks at the PCE deflator readings in particular for its monetary policy decisions, preferring the core measure, which rose to 4.8% y/y in June (expected 4.7% y/y, previous 4.7% y/y), and 0.6% m/m (expected 0.5% m/m, previous 0.3% m/m).
Inflation has tended to surprise on the upside, both globally and domestically, with the latest producer price inflation print coming in at 16.2% y/y, versus expectations of 15.6% y/y, heralding further pressure on South Africa’s CPI measure in the near term.
There is a one to two month feed through lag between CPI and PPI. The higher than expected PPI figure, with food price inflation now at a heady 13.0% y/y for final manufactured goods, and at 9.0% y/y for the CPI, heralds further upwards pressure for CPI inflation in Q3.22.
At the agricultural level, cereals prices rose to 33.4% y/y in June, from 30.8% y/y in May, while products of crops and horticulture overall increased by 17.5% y/y, and that of live animals by 12.4% y/y, above the food price inflation rate of the CPI in June.
However, food price inflation at the commodity level is also starting to turn lower than in previous months, and this is likely to feed through into more modest PPI inflation figures by the end of Q3.22, and so into more modest CPI inflation over Q4.22 for South Africa.
International oil and petroleum products prices have dropped from mid-June, with the Brent crude oil price at USD99.7/bbl, from USD123.6/bbl in June. Another petrol price cut is building for SA in September, of around R3.00/litre, after the cut announced for August.
South Africa is still expected to see CPI move towards 8.0% y/y in Q3.22, from 7.4% y/y in June, but at a slower pace of acceleration than in Q2.22, while Q4.22 will likely see a moderation, towards 7.0% y/y, and over the course of Q1.23 to below 7.0% y/y.

Annual headline producer price inflation climbed to 16.2% y/y in June
28 July 2022
The coke, petroleum, chemical, rubber and plastic products grouping which makes up just under 23.0% of the PPI basket saw prices rise by 37.2% y/y versus 31.7% y/y in May.

Headline producer price inflation (PPI) for final manufactured goods climbed to 16.2% y/y in June from an already elevated 14.7% y/y logged in May. The outcome was ahead of consensus expectations (Bloomberg) of 15.6% y/y. Measured on a month-on-month basis PPI rose by 2.1%.
The coke, petroleum, chemical, rubber and plastic products grouping which makes up just under 23.0% of the PPI basket saw prices rise by 37.2% y/y versus 31.7% y/y in May. Accordingly, this sub-group added a marked 9.1% points to the headline reading in June (7.7% points in May).
A notable pick-up in petrol prices from 30.4% y/y to 48.0% y/y and diesel prices from 54.0% y/y from 59.3% y/y was logged. Another large fuel price hike in July will add further upside pressure to the month’s inflation reading. However, a substantial decrease is expected in August, on the back of the lower oil price, which should provide a modest reprieve to financially stretched consumers.
Additionally, manufactured food price inflation continued on its upward trajectory, increasing by a notable 13.0% y/y in June from 12.3% y/y previously. Owing to its size in the PPI basket (26.65%) the food products, beverages and tobacco products’ category added a further 2.6% points to the headline reading. Meat and meat products inflation, which is one of the largest categories in the food basket rose to 12.7% y/y from a prior 12.1% y/y.
The grain mill products, starches and starch products and animal feeds group climbed to 16.9% y/y from 13.7% y/y in May. South Africa is heavily influenced by global agricultural commodity prices with the Food and Agricultural Organization of the United Nations’ (FAO) Cereal Price Index up 27.6% y/y in June. While, the oils and fats sub-category, another commodity group that has been heavily impacted by the war in Ukraine climbed to 73.0% y/y from 61.3% y/y in May.
Climate change remains a significant threat to the agriculture industry. According to Agbiz, “extreme weather events in the northern hemisphere are a warning signal for farmers worldwide”.

Oil: falling prices herald large petrol price cut
27 July 2022
SA is in line for close to a R2.00/litre cut in the petrol price in August given the drop in the international gasoline price
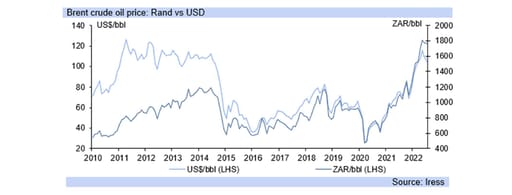
With only a few days of July left, lower energy prices this month are indicating a -7.4% drop in South Africa’s petrol price in August, and a -6.2% decline in the diesel price, which will provide some welcome relief to high living costs, if government passes them through.
Energy prices have fallen as global growth expectations for this year and next year drop lower again. The IMF published a gloomy update late yesterday to its world economic outlook (WEO), waring that “the U.S. has only a slim chance of avoiding recession”.
The IMF now expects global growth of 3.2% y/y this year, revising it successively lower from the 3.6% y/y expected for 2022 in its April WEO update, and 4.4% y/y in January’s WEO, while in October last year the IMF forecast 4.9% y/y for 2022.
Indeed, in June last year the IMF forecast 5.0% y/y for 2022 growth. The successive downward revisions reflect the building negative expectations for global economic activity this year and next, with the IMF now forecasting 2023 world GDP growth at 2.9% y/y.
The downward revision for 2023’s IMF global growth expectation is quite material, dropping -0.7% y/y since the April forecasts, as US growth was revised down by -1.3% y/y to 1.0% y/y and that of the Euro Area by -1.1% y/y to 1.2% y/y for 2023.
The IMF warns “it will test the mettle of central banks to continue raising interest rates in a bid to restore price stability”. “It’s easy to cool off the economy when it is running hot. It’s much harder to reduce inflation when the economy is close to a recession.”
The rise in the oil price over June, which saw an average for Brent crude of US$117/bbl, has been reversed, with July averaging closer to US105/bbl, below May’s US$112/bbl, and even April’s US$106/bbl (March US$112/bbl. January and February were below US$100/bbl).
SA is mainly importing refined petroleum products however, but the price of gasoline has seen similar directional movements to that of oil over May to July. Indeed if the rand had not weakened materially over July, SA would be in line for a R3.00/litre cut in the petrol price.
To date, the rand has weakened by over R1.00/USD on average in July to date versus June, as safe haven flows increased, with worries over slowing global growth and even recession placing downwards pressure on oil and gasoline prices.

Household finances: further upwards interest rate pressure to come
22 July 2022
Interest rates will be higher than expected this year as high, and rising, inflation has continued for longer than anticipated
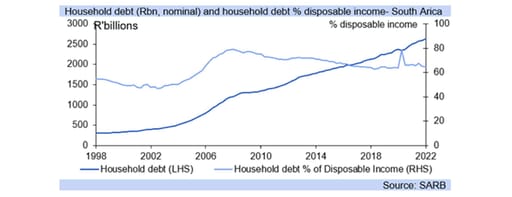
Economic indicators for the second quarter of this year are showing that household finances came under increasing pressure, and this is expected to persist over the rest of 2022 and 2023, suppressing economic growth as the SARB quickens its rate hike trajectory.
Yesterday’s monetary policy committee’s meeting saw a very hawkish tone as the members focused on the need to quell high and rising inflation, while lowering their GDP forecast for 2023, which is when the bulk of SA’s rate hike cycle will take effect.
That is, the SARB aims to make financial conditions harder for consumers by raising interest rates in order to suppress demand and so prevent a broader transmission of high inflation (becoming the norm) throughout the economy for the prices of all goods and services.
In total, interest rates have risen by 2.00% in South Africa’s current interest rate cycle, with the small 25bp lifts in November last year and January this year not having a severe impact initially, but cumulatively the rate hikes of 2.00% so far and likely another 1.00% will.
There is a lagged effect between interest rate hikes and the impact on the economy, of two to three quarters, although there can be some very small effect a quarter out, and the overall effects can last out to a year if not further, depending on factors in the economy.
Household indebtedness is one of these factors, with debt at a notable 65% of disposable income, and consumers having come from a low interest rate environment, with the prime lending rate at 7.00% (repo 3.50%) for close to two years, before the current series of hikes.
From the middle of 2014 to 2019 SA’s interest rates changed by only 25bp (whether hikes or cuts) when the MPC adjusted interest rates, and prior to that, only 50bp moves (higher or lower) had been the norm since end 2003, with larger hikes having not occurred for 19 years.
The SARB could move by 75bp or 100bp in September, and this quickening of the delivery of interest rate hikes, or front loading, is being aimed at rapidly quelling consumption to limit the pass through of high inflation from energy and food to prices throughout the economy.
Falling inflation, and evidence that previous high inflation rates are not feeding broad based inflationary pressures, will eventually limit the SARB’s hand, but this year the repo rate, at 5.50%, is likely to rise to 6.00% if not 6.25% by September and reach 6.50% by November.

CPI update: above 7.0% y/y as fuel and food price inflation soars
20 July 2022
Base effects stemming from low inflation pressures a year ago aided the large jump in inflation, along with substantially higher fuel prices.

CPI inflation came out at 7.4 y/y (1.1% m/m) in June, slightly above the consensus estimate of 7.3% y/y (Bloomberg), and well above May’s 6.5% y/y. Base effects stemming from low inflation pressures a year ago aided the large jump in inflation, along with substantially higher fuel prices.
Higher agricultural commodity price pressures saw the food price inflation rate rise to 9.0% y/y in June, from 7.8% y/y in May, with the Economist commodity price index up 20.0% y/y for the prices of global food agricultural commodities.
Residual price pressures were also recorded in June (0.1% m/m, 0.2% m/m in May), a catchall category for price increases too small to move their individual categories on their own, showing building price pressures, and some further upside (if slowing somewhat) risks to inflation.
The second half of this year is likely to see CPI inflation remain above 7.0% y/y, and a persistence of high inflationary conditions globally and locally is expected.
SA is experiencing high price pressures at the production level (with PPI inflation at 15%), and this does not provide the environment for a rapid deceleration in domestic inflationary pressures. This will negatively impact consumers, with a 50bp hike in interest rates expected in July, although the risk is growing for a 75bp lift instead.
August is currently heading for a cut in both petrol and diesel prices on the decline in the oil price, which should slow the m/m increase in the CPI back towards 0.5% m/m in August. From August base effects of low inflation in 2021 (excluding the electricity survey month of July) will also resume.
Globally, risks of recession have increased, particularly for the start of 2023 (if not from the last quarter of 2022) on the lagged effects of rapidly rising interest rates in the US and expected in a number of other key Western economies. This has increased concerns over global demand and weakened oil prices recently, while global agricultural food price inflation started to calm on the month in June.
Producer price inflation showed a steady rise overall from 10% y/y in January, to 15% y/y by June, with PPI leading (influencing) CPI inflation by one to two months. The second half of 2022 is not expected to see the same run up in CPI inflation as the first half.
In H2.22 CPI inflation is likely to only rise towards 8.0% y/y from June’s 7.4% y/y (January 2022 5.7% y/y). CPI inflation is expected to peak at 7.8% y/y in October, and average 6.9% y/y for 2022.

Mining production falls by a further -7.8% y/y in May
14 July 2022
Mining production fell by a further -7.8% y/y in May, following April’s notable -14.8% y/y (revised slightly) plunge. The reading was stronger than consensus expectations (Bloomberg) of -10.9% y/y.

Notable year-on-year dips of -28.3%, -7.6% y/y and -7.3% were logged for gold, iron ore and coal production respectively and accordingly these commodities detracted a combined -7.4% points from the headline reading.
Conversely, PGMs grew by a modest 3.3% y/y and owing to their size in the mining index added 0.8% points to the topline number, preventing a larger contraction.
The Fed’s hawkish monetary policy stance has weighed on gold, despite the heightened global geopolitical situation, with the war in Ukraine persisting.
The World Bank’s Metals and Minerals Index was down markedly between March and June, with iron ore prices down -14.0% over the period. Metals demand remains at risk from the weakening global growth outlook. Indeed, the JP Morgan Global Manufacturing PMI fell to a 22-month low in June. According to the survey results “underlying fundamentals remain weak, as new orders stagnate and business optimism falls”.
Notwithstanding the global situation, South Africa which is heavily reliant on mineral and metal exports continues to face a number of domestic challenges hindering production.
The electricity supply situation, which has seen rotational load shedding escalated to stage 6 at times is a key downside risk. Aging power plants, a historic lack of maintenance and criminal activity continue to add to the unreliability of the power situation in this country.
Moreover, logistical bottlenecks (due in part to aging infrastructure and theft) continue to weigh on export potential.

Decades of inadequate investment lowers electricity supply
30 June 2022
Fixed investment note: Rapid removal of red tape in electricity sector needed that crowds in private sector renewable energy.
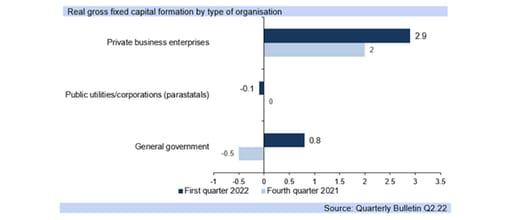
South Africa’s temporary institution of stage 6 load shedding has partly been a result of a lack of planned maintenance and repairs due to unlawful strike action from a number of Eskom employees, but the capacity shortages leading to load shedding overall run much deeper.
Already on Sunday (26th June) Eskom warned that 3 894MW was on planned maintenance, 15 472MW was unavailable due to breakdowns, and 600MW was unavailable due to a line fault in Mozambique’s Hydroelectrica de Cahora Bassa (HCB).
Adding to this then, 4000MW was at risk due from the illegal strike action with Eskom warning that “protracted strike actions may lead to further damage and prolonged delays to returning units to service, compounding an already constrained power system”.
Eskom is expected to continue load shedding – alternating between stages 2 and 4 through the weekend, although any further damage to production capacity, including sabotage, vandalism or theft of infrastructure (including cables) would likely switch SA back to stage 6.
While the recent few days of temporary periods of stage 6 load shedding will have a negative impact on Q2.22 GDP, as will the earlier periods of below stage 6 on economic activity over Q2.22, it is not enough to cause concerns about credit rating downgrades yet.
Credit rating agencies essentially focus on the likelihood of debt repayment, and so the factors which influence revenue, expenditure and borrowings metrics, as well as projections for these in assessing creditworthiness, and so assigning credit ratings.
Factors which determine the metrics the rating agencies watch include economic growth, and so electricity supply, but also include the impact of wage settlements on expenditure, with above inflation wage increases damaging the consolidation of state finances.
Eskom has come from decades of insufficient capacity expansion, and particularly in the last decade this has been compounded by insufficient maintenance and repair causing load shedding, with aging power stations also prone to more breakdowns and less output.
It is imperative SA transitions rapidly away from coal to renewable energy and cuts out all the regulations prohibiting the private sector from fully and swiftly taking part in electricity generation (and transmission), a sea change likely need ingto be effected by the President.

Employment update: Non-farm employment rose marginally in Q1.22
30 June 2022
Formal sector non-farm employment rose marginally in the first quarter of 2022 by 0.4% when measured on a quarter-on-quarter basis, underpinned largely by a lift in the part-time employment category.

Specifically, a further 41 000 part-time positions were added in Q1.22 (3.5% q/q lift), primarily in the community services and manufacturing sectors.
The hiring of part-time workers likely reflects the current economic climate and level of financial uncertainty still present, with many employers unable or hesitant to hire full time employees.
A disaggregation of the employment data (both full-time and part-time employees) on an industry basis indicates that the trade sector shed a further 18 000 jobs in Q1.22, mostly part-time employees following the seasonal increase in Q4.21, ahead of the busy festive period.
However, when measured on a year-year basis jobs in this sector grew by 1.0%. The tourism and related sectors have been one the biggest causalities of the pandemic, however as restrictions have been lifted and travel bans abolished this industry is gaining momentum as can be seen by the marked increase in overseas travellers entering the country, according to Stats SA data.
Total employment numbers also declined within the construction, transport and business services segments of the market over the quarter by -1.7% q/q, -0.5% q/q and -0.3% q/q respectively.
The Quarterly Employment Survey also provides detail on wage developments across economic sectors. Gross earnings paid to employees across all industry groups fell by R28.2bn or -3.4% q/q. The decrease was broad based across sectors, with all industries besides the mining and business services sectors experiencing declines. On a year-on-year basis total gross earnings however rose by 7.6% or R56.6bn.
Moreover, average monthly earnings (in real terms) for non-farm employees fell by 2.7% q/q (incl. bonuses and overtime) in Feb, after rising by a marked 22.6% q/q (revised) in November. Measured on an annual basis however, average earnings are up 19.7%.
Despite the improvement in earnings, many households remain financially stretched as the cost of living continues to climb. South Africa’s growth trajectory continues to be stifled by electricity supply constraints, logistical challenges and heightened red tape. A lift in the factors which drive business confidence is required to encourage investment, growth and accordingly job creation.

CPI update: inflation breaks through 6.0% as food prices soar
21 June 2022
CPI inflation came out at 6.5 y/y (0.7% m/m) in May, above the consensus estimate of 6.1% y/y (Bloomberg), and above April’s 5.9% y/y.

Higher agricultural commodity price pressures saw the food price inflation rate rise to 7.8% y/y in May, contributing 0.4% to the overall 0.7% m/m lift in the CPI.
Despite producing enough food to have high food security, SA is a price taker for most of its agricultural output due to Import and export parity pricing. The Economist commodity price index recorded a 19.4% y/y lift last month for the prices of global food agricultural commodities. Increased protectionism, including outright bans by some countries on certain exports, along with increased sanctions on Russia and the impact of the Chinese lockdown restrictions, have driven already high global food prices even higher this year.
With the Russian invasion of the Ukraine intensifying, and now NATO warning that the war could last for years, expectations that food and energy price inflation has peaked are likely unfounded. Additionally, adverse weather conditions both globally and domestically are set to intensify as climate change accelerates.
Significant residual price pressures, a catchall category for price increases too small to move their individual categories on their own, are adding to price pressures. A notable 0.2% contribution to overall CPI inflation from the residual category occurred in May, indicating that higher CPI inflation prints for SA are likely in H2.22.
Despite a small petrol price cut of -12c/litre, diesel prices rose by 98c/litre in May. Transport cost inflation contributed the remaining 0.1% to the overall rise in the CPI of 0.7% m/m in May.
Globally and locally inflation, price pressures are expected to remain heady over Q2.22, and into Q3.22, negatively impacting consumers. Our current view is that a 50bp repo rate hike in July will be followed by successive 25bp lifts in September and November.
CPI inflation in June is expected to rise above 7.0% y/y on the R2.33/litre hike in the petrol price, base effects, food price pressures and potentially some second-round effects of rising inflation on rentals/owner equivalent rent and other categories.
We expect CPI inflation to average 6.5% y/y for this year, as the protracted Russian war on the Ukraine continues, along with sanctions and attendant degobalisation, intensifying global and domestic price pressures.

Retail sales rose by 3.4% y/y in April, ahead of expectations
15 June 2022
Retail trade sales accelerated to 3.4% y/y in April, following March’s 1.7% y/y (revised from 1.3% y/y) lift, ahead of consensus expectations (Bloomberg) of 1.7% y/y.

The annual pick-up in growth was broad based with all sub-sectors in the retail basket lifting on a year-on-year basis except the hardware, paint and glass category which contracted by a further -8.3% y/y, following April’s -8.9% y/y (revised) decline and accordingly detracted -0.7% points from the headline reading.
Indeed, this category of the market has seen a marked decline as many companies have mandated a return to the office or a hybrid working policy, decreasing demand for DIY and home enhancement related products.
The general dealers’ grouping made the largest positive contribution to April’s top line outcome, largely owing to its significant weighting in the index. It rose by 5.4% y/y, adding 2.2% points to the headline reading.
Moreover, the textiles, clothing, footwear and leather goods category contributed a further 1.1% points to the top line number on the back of growth of 6.4% y/y. Contrary to the hardware segment, this category of the retail basket has benefitted from individuals returning to work and generally spending more time outside their homes as lockdown restrictions have largely been removed.
This is line with the results of the latest business confidence release published by the BER which indicated that semi-durable retailers experienced “continued improvement, albeit off a low base”, in Q2.22, while sales of goods in the non-durable category “were surprisingly strong”.
When measured on a month-on-month seasonally adjusted basis, retail sales however declined, by -0.2%. Indeed, many households are still financially stretched in the current economic environment. Unemployment remains at heightened levels, amidst a sluggish labour market, while elevated administered and food prices continue to dilute disposable incomes.
Moreover, rising interest rates are weighing heavily on the indebted, with the probability of a further 50bps rate hike by the South African Reserve Bank in July.

With oil at US$123/bbl, US inflation has not peaked
14 June 2022
High, and rising, oil prices signal still more inflationary price pressure to come
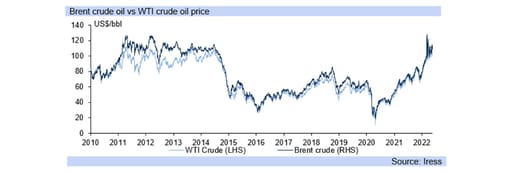
At mid-June, oil prices for both Brent and WTI were averaging over US$10/bbl to higher than May’s average. This is bound to put further upwards pressure on both SA and US inflation from fuel costs, dispelling hopes that infltion has peaked.
The current expectation is for another R2.00/litre hike in the petrol price in July, to R26.18/litre -- the highest petrol price SA has ever experienced -- while the diesel price is set to rise by R1.18/litre, taking it to R24.27/litre, again unprecedented.
Higher fuel prices are being driven by the sharply higher prices of oil and petroleum products. Further rand weakness is a risk, as financial markets increasingly factor in a 75bp hike from the FOMC when it meets on 15th June.
Petrol prices in SA are around double what they were about two years ago, and, unsurprisingly, inflation has more than doubled as food costs have increased sharply. Second-round price effects are also building, and the SARB has warned against a wage/price spiral.
In the US, food price inflation is running at 10.1% y/y, and fuel (gasoline and oil) at 50.3% y/y. Excluding food and energy, commodities inflation in the US is at 8.5% y/y (all US Bureau of Labour Statistics for US CPI). Overall US May CPI inflation was 8.6% y/y (1.0% m/m).
Gasoline prices are also higher for the month of June to date versus May’s average, by 10% currently, placing upwards price pressure on the US inflation figures. Global supply chain cost pressures are seeing high aviation and shipping fuel costs.
The rise in the oil price over June has been driven by tight supply, with OPEC+ production significantly below its quotas, even with some recent increase in supply.
Refined oil products have felt supply pressure too, and oil inventories are decreasing. Slower demand for oil has done little to mitigate overall supply concerns, exacerbated by sanctions on Russian commodities.
In SA, the rand is at risk of further marked weakness, with the differential between SA and US interest rates having been eroded by US interest rate hikes. A further, and steeper, hike by the Fed this week would add to local inflationary pressures, as rand weakness increases the rand oil and petroleum product prices.

Economic growth: 2022 likely closer to 3.0% y/y than 2.0% y/y
8 June 2022
Q2.22 is showing strong evidence of a materially weaker growth than Q1.22 but overall 2022 should near 3.0% y/y
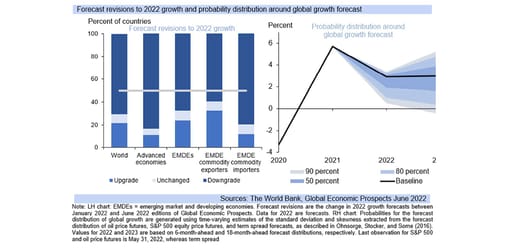
2022 is on track for a stronger outcome than anticipated, with the 1.8% growth rate forecast at the start of this year potentially too weak, although April’s flood damage to economic capacity, higher interest rates and slowing global growth will provide some limitations.
Yesterday’s GDP print surprised on the upside at 1.9% y/y, versus expectations closer to 1.0% y/y, and raises the base substantially from which the following quarters for 2022 will roll off, allowing for a faster GDP growth reading for 2022 than previously forecast.
Electricity outages will however eat into the economy’s growth potential to a degree in Q2.22 and Q3.22, with Eskom exceeding its previous worst case scenario. The energy availability factor was at 61% of total capacity at the end of May and is expected to average 59% in 2022.
May saw significant loadshedding, with its operational reserve margin severely eroded in the second half, although the start of May also suffered supply constraints, as did parts of April. Q1.22 had less loadshedding in comparison, and electricity production rose 2.0% qqsa.
Data on electricity production from Eskom for April and May show that electricity production will be significantly lower in Q2.22, which will also adversely affect manufacturing output, a heavy user of electricity. Q1.22 saw a 4.9% qqsa expansion in manufacturing production.
With lockdown restrictions lifted in Q1.22, and expectations of strong global demand in January, manufacturing ramped up, with Q1.22 also gaining from base effects as Q4.21 was still weaker than activity before the July riots, as the sector took six months to recover.
The destructive nature of the floods in April this year in KZN saw some warehouses, factories and distribution hubs damaged, impacting supply chains, and economic activity will be negatively impacted in Q2.22, but not to the extent of the July 2021 riots’ effect.
Globally, economic recovery aided GDP growth in SA in 2021, led by China and the US, key trading partners of SA along with Europe. However, slowing global growth, particularly in 2023 on the lagged effects of higher interest rates, is expected to impact SA’s performance.
2022 is likely to see better growth in H2.22 than in Q2.22 (with demand also impacted by China’s lockdowns), but the high base of Q1.22 will still push up GDP for the rest of this year significantly, and H2.22 will benefit from the weak base of H2.21 caused by the period’s riots.

GDP grew 1.9% in first quarter, ahead of expectations
7 June 2022
Headline GDP growth in the first quarter of 2022 surprised on the upside, but global and local headwinds remain

The outcome was ahead of consensus expectations (Bloomberg) of a 1.2% qqsa lift.
The economy was particularly buoyant in January with key sectors of the economy rising notably on an annual basis, supported by a pick-up in demand, with few Covid-linked restrictions in place. But the war between Ukraine and Russia, which commenced on the 24th February, dampened confidence and exacerbated supply chain bottlenecks triggered by the pandemic, impacting optimal economic activity.
The increase in growth over the quarter was led by the manufacturing industry which rose by 4.9% qqsa, contributing 0.6% points to the headline reading. Only the mining and construction industries declined on a quarter-on-quarter basis.
The manufacturing sector’s performance, coupled with a 2.0% qqsa pick-up in the electricity, gas and water category, supported the 3.7% qqsa increase in the secondary sector of the economy, this despite a modest decline (-0.7% qqsa) in construction activity.
Conversely, the primary sector of the economy, which comprises the agricultural and mining sectors fell by -0.4% qqsa in Q1.22, dragged down by the mining sector which fell by a further -1.1% qqsa in the first quarter, following a -3.2% qqsa drop in Q4.21.
The tertiary segment of the economy rose by 1.8% qqsa, with all sectors increasing over the quarter. The finance sector which makes up a substantial component of overall GDP, grew by 1.7% qqsa, following last quarter’s decline and accordingly added 0.4% points to the topline reading. Moreover, the trade sector which encompasses tourism activity and retail sales grew by a further 3.1% qqsa, adding an additional 0.4% points to the headline number. The tourism sector which was one of the biggest casualties of the pandemic has rebounded, following the lifting of domestic lockdown restrictions and international travel bans.
The expenditure approach to measuring GDP also yielded an outcome of 1.9% qqsa in Q1.22, following Q4.21’s 1.5% qqsa (revised) lift. Household final consumption expenditure (HFCE) which makes up around 60% of the GDP outcome grew by 1.4% qqsa in Q1.22, accordingly adding 1.0% point to the topline reading. The restaurants and hotels sub-category increased by 6.5% qqsa, while the transport and non-alcoholic beverage categories grew by 2.8% qqsa and 2.5% qqsa respectively.
However despite this moderate pick-up in spend, which is down on Q4.21’s reading of 3.0% qqsa (revised) many consumers remain financially constrained with sharply rising food and fuel prices diluting already limited disposable incomes. Moreover unemployment remains at critically high levels, while mounting interest rates will continue to weigh on the indebted. Accordingly, HCE is projected to grow modestly over the medium-term.
Gross fixed capital formation grew by 3.6% qqsa in the first quarter, following Q4.21’s 1.6% qqsaa (revised) increase, supported largely by a pick-up in the machinery an equipment and transport equipment components. A notable pick-up in business confidence is required to further boost private sector investment. Security of electricity supply and an improvement in the ease of doing business is imperative is imperative in this regard.
SA’s growth trajectory remains subject to downside risks including persistent geo-political tensions, which along with stringent lockdowns in China saw global growth projections downgraded. Domestically a slow, inconsistent implementation of key structural reforms outlined by the State continues to impede performance and weigh on the country’s competitiveness. Security of electricity supply remains a chief priority.

Commodity currencies: afflicted by sticky inflation
11 May 2022
Sanctions, lockdowns and supply shortages increase protectionism and commodity prices, but limit exports dulling associated commodity currencies
Commodity currencies have generally weakened since November on a year on year basis, although the Brazilian real continues to prove the exception, still up 1.7% y/y, and 10% since the start of the year, aided by its strong export-led performance.
However, compared to a month ago all the commodity currencies are generally weaker, with the rand leading the pack at -9.1% depreciation m/m, and this has been the case both this month so far, and the last week of April.
Commodity prices have seen a varied performance over the month, with energy prices strongly up on both the year and month, but most metals prices lower, and food prices seeing a mixed outcome. Most commodity prices are however higher y/y.
The World Bank has said that “the war (in the Ukraine) … will likely shave a full percentage point off global growth in 2022, … having delivered the largest commodity-price shock we’ve experienced since the 1970s.”
Additionally, “global patterns of trade, production, and consumption of commodities (have shifted) in ways that might keep prices high for years. Many countries are turning away from Russia as a coal and oil supplier and have been finding alternatives in more distant locations.”
“For nearly thirty years, greater trade, investment and innovation bolstered an unprecedented era of prosperity—and brought the world closer to ending extreme poverty.” “Incomes of the poorest nations … narrowed the gap with the wealthiest.”
The IMF in turn warns that “rising protectionism is exacerbating chaos in global food markets brought on by the war in Ukraine, with governments clamping down on exports of staples including grains, cooking oil and pulses”.
This is echoed by the European Bank for Reconstruction and Development (EBRD), which highlights that increased protectionism artificially boosts prices, which are already at record levels, fueling global food insecurity, and “increaseing global poverty rates.”
Climate change and the impact of Covid-19 has also increased protectionism on food exports, and so prices, fuelling global inflation, with these effects not yet at an end. Commodity currencies afflicted by curbs on their countries’ commodities exports have tended to dull.

Household finances squeezed by higher rates, staples prices
8 April 2022
Rising inflation and food prices, along with markedly higher interest rates will limit consumer affordability absent marked real wage increases

Unemployment at a historic 35.3%
29 March 2022
SA's unemployment rate, which was already at a critical level before the onset of the pandemic, has reached new highs.

The official unemployment rate rose by a further 0.4% points in Q4.21 and by a notable 2.8% y/y to 35.3%, the highest rate since the commencement of the Quarterly Labour Force Survey (QLFS) in 2008.
A breakdown of the numbers reveals that the labour force grew by 2.5% q/q, with fewer individuals previously characterised as “not economically active”, while the number of those employed only rose by 1.8% y/y, leading to the raised unemployment figure.
The informal sector was, however, the only segment of the economy to record a decline in employment numbers during the quarter. Specifically, the number of employed within this category fell by 48 000 or -1.8% q/q. When measured on a year-on-year basis however informal sector employment has grown by a notable 5%, attracting those who perhaps lost their formal sector jobs or businesses during the severe lockdown restrictions imposed by the State.
Conversely formal sector, non-agricultural employment rose by 1.5% when measured on a quarter-on-quarter basis, but is down a marked -6.9% y/y.
A disaggregation of the data on an industry basis, indicates that five of the eight industries surveyed within the formal sector (non-agriculture) reported a lift in employment. The trade sector recorded the largest number of job gains at 92 000 over the quarter, followed by the community and social services sector (84 000). Q4.21 generally sees a seasonal pick-up in employment, particularly in the tourism, hospitality and related sectors.
The expanded unemployment rate, (which includes individuals who desire employment regardless of whether they are actively seeking work) declined marginally to 46.2% but is a marked 17.5 percentage points higher than the rate logged during the same period in 2008, evincing the extent of SA’s growing unemployment crisis.
The youth category (15-24 years), a priority area of government, which has been particularly affected by the country’s mounting unemployment problem remained elevated at 66.5% in Q4.21. Indeed, a focus on improving the quality of and access to education remains essential. Indeed, according to Stats SA of the 7.9 million unemployed persons in Q4.21 “as many as 51,6% had education levels below matric”.
Government outlined measures to increase employment in its State of the Nation Address, stating that a primary “task of government is to create the conditions that will enable the private sector – both big and small – to emerge, to grow, to access new markets, to create new products, and to hire more employees.” February’s Budget Review followed on from this tabling expenditure priorities in this regard.
SARB lifts rates by a further 25bp to 4.25% as inflationary pressures increase
24 March 2022
Overall risks to the inflation trajectory have risen, underpinned predominantly by higher fuel and food prices and accordingly the Reserve Bank has revised its headline consumer price inflation projection significantly higher for this year.

The SARB’s monetary policy committee (MPC) opted to hike the repo rate by a further 25bp to 4.25%. Three of the MPC members were in favour of a 25bp hike, with two preferring a more hawkish 50bp rise.
Overall risks to the inflation trajectory have risen, underpinned predominantly by higher fuel and food prices and accordingly the Reserve Bank has revised its headline consumer price inflation projection significantly higher for this year. Specifically, CPI is now projected to reach an elevated 5.8% in 2022 (from 4.9% previously). This is ahead of the average and market-based surveyed expectations of future inflation of 5.1% y/y and 5.5% y/y respectively.
Core inflation expectations have also been raised, with a reading of 4.2% anticipated for 2022 (3.8% y/y previous estimate), 5.0% y/y in 2023 (previously 4.4% y/y) and 4.7% y/y in 2024 (previously 4.5% y/y).
The highly volatile oil price, a major commodity import, has risen markedly on the back of the conflict between Ukraine and Russia and remains a key upside risk to the inflation outcome. The SARB has accordingly increased its oil price forecast for this year to a marked US$103/bbl (average).
Food price inflation which makes up the largest portion of the CPI basket was elevated before the onset of the war between Russia and Ukraine. Specifically, international agricultural food prices have been driven higher by increased demand, poor weather conditions in certain geographies leading to supply constraints. Supply concerns have further been exacerbated by the geo-political situation, exerting upward pressure on a number of agricultural commodities like grains and oilseeds and key inputs like fertilizer. Indeed, “Russia is the world's leading exporter of fertilizer materials, accounting for 14% of global exports in value terms”, according to Agbiz.
The domestic currency has appreciated somewhat, “despite less favourable global conditions”, buoyed by robust commodity export prices which has “helped to dampen price pressures”, according to the SARB. Accordingly, the implied starting point for the rand forecast has been adjusted to R15.41 to the greenback, versus R15.60/USD previously (January meeting).
Global growth is expected to decelerate this year on heightened geo-political tensions and renewed lockdown restrictions in parts of Asia in response to rising covid-cases. Specifically, the SARB has amended its global growth forecast notably to 3.7% (from 4.4%) for 2022. Risks to this forecast remain, depending on the length and severity of the war in Eastern Europe.
Conversely, the SARB has revised upwards, albeit moderately, its GDP forecast for the South African economy to 2.0% for 2022, from 1.7% previously, underpinned by a number of factors, including robust export commodity prices and a higher than anticipated Q1.22 GDP outcome. Rates of growth for 2023 and 2024 are projected at 1.9% respectively. Electricity supply constraints and sluggish reform implementation remain key impediments to growth. The SARB continues to evaluate the risks to the medium-term domestic growth outlook to be balanced.
“Economic and financial conditions are expected to remain more volatile for the foreseeable future. In this uncertain environment, policy decisions will continue to be data dependent and sensitive to the balance of risks to the outlook,” the SARB stated.

Building plans passed rose by 19.0% qqsa
17 March 2022
Building update: building plans passed were up 19.0% qqsa, buoyed primarily by the residential segment, which increased by 32.4% qqsa

The value of buildings reported as completed by larger municipalities fell by a notable -27.1% in real terms when measured on a quarter-on-quarter seasonally adjusted basis (qqsa). While all segments of the market contracted over the period, sharp declines in non-residential building completions and the additions and alterations category were largely responsible for the decline, sliding by -54.2% and -36.0% respectively.
Conversely, building plans passed were up 19.0% qqsa, buoyed primarily by the residential segment, which increased by 32.4% qqsa. The Western Cape has benefited from the notable semigration trend, however climbing interest rates is likely to curb buyer demand. Indeed, the Russian/Ukrainian conflict is expected to place upwards pressure on inflation, which was already very high in many countries before the conflict, with governments around the world tightening monetary policy in response.
Pipeline activity within the non-residential category also rose by a moderate 9.4% qqsa. The non-residential sector of the market which was badly impacted by the pandemic induced restrictions is expected to recover as employees return to the office. However, a return to pre-pandemic conditions in the short term is unlikely as a hybrid working culture is becoming the ‘new normal’.
Indeed, according to the BER’s latest building survey, confidence of non-residential builders as measured by the FNB/BER Building Confidence Index rose to 39, from 33 previously, with survey participants’ “expectations for next quarter in terms of activity” optimistic.
Pipeline activity within the additions and alterations category however fell by -2.4% qqsa. Specifically, the work from home dynamic, which led to a strong pick-up in home improvement activity has subsided. This can be further evinced by the retail trade numbers which showed that hardware paint and glass retailers recorded declines in activity of -5.4% y/y and -10.6% y/y in December and January respectively.
Business confidence increased modestly in Q1.22 but remained subdued at 46. The government’s plans to improve the ease of doing business, focus on job creation, infrastructure development and deal with the electricity supply constraints in the country should aid in boosting business confidence going forward which is vital for increasing investment and growth.

FOMC note: the Fed hiked by 25bp as expected
17 March 2022
Its tone became more hawkish with rate hikes seen at every meeting this year, and its strong growth outlook strengthened the rand
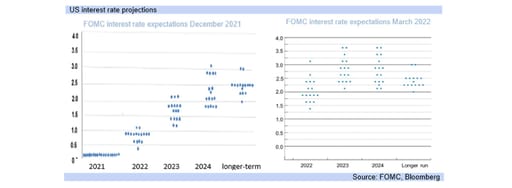
Last night’s Federal Open Market Committee (FOMC) meeting saw the target range for the federal funds rate rise to 0.25% to 0.50% as widely expected , and the committee highlighted that it “anticipates that ongoing increases in the target range will be appropriate”.
Additionally, the Fed will begin to reduce its holdings of US treasuries (and agency debt) on its balance sheet, the accumulation from its QE programme at an upcoming meeting (likely May). All the members voted for a hike, with even one preferring 50bp instead of 25bp.
The statement added that the implications of the Russian/Ukraine war “for the U.S. economy are highly uncertain, but in the near term the invasion and related events are likely to create additional upward pressure on inflation and weigh on economic activity”.
Indeed, the Fed Chairman remained focused on inflation without economic growth concerns, and indeed was very confident on economic growth with little expectation of a recession in the US. Markets reacted positively to his comments, with risk-off receding materially.
Risk assets benefited from the very positive reading of the US economy, with Chairman Powell specifically saying “the economy is very strong”, “aggregate demand is strong, and bottlenecks and supply constraints are limiting how quickly production can respond.”
“Although the invasion of Ukraine and related events represent a downside risk to the outlook for economic activity, FOMC participants continue to foresee solid growth of … 2.8 percent this year, 2.2 percent next year, and 2 percent in 2024.”
While the US rate hike was expected, the tone of the FOMC statement was very hawkish with heightened concern about further future inflationary pressures, concluding “we are attentive to the risks of potential further upward pressure on inflation and inflation expectations.”
Also at the conclusion of Chair Powell’s press conference he highlighted for the third time that the “American economy is very strong”, finishing with the statement that the US is consequently “well positioned to handle tighter monetary policy”.
The South African Reserve Bank is expected to hike the repo rate by 25bp on the 24th, following on from the Fed’s hike last night, and the FRA curve has fully factored this in, but the positioning for a 50bp hike has come out of the system over the past few weeks.
The FOMC projection shows the target range for the federal funds rate at 1.75% to 2.00% this year, which is a substantial ramp up from December’s projections of a range of 0.75% to 1.00% the last time the Fed’s interest rate forecasts were published (December 2020).
With the Fed’s funds rate currently in the 25bp to 50bp range, this implies a hike at every FOMC meeting this year of 25bp, with six meetings remaining in the year. This aggressive rate hike cycle has been presented in order to squash forty decade high US inflation.
South Africa’s FRAs have fully factored in a 25bp lift the repo rate this month, and are building in another one for May and yet another for July, and indeed a 25bp hike is factored in by the markets for every MPC meeting this year, if not 50bp hikes at some MPC meetings.
The MPC often follows the FRA curve at a meeting, but FRA curve expectations are volatile and change often, and so the future expectations out to twenty-four months have less effect than the nearest months reading on the SARB’s interest rate decision.
Also supportive of a March 25bp lift in SA’s repo rate is the 25bp hike last night in the Fed funds target rate, with the SARB mindful of the need to maintain the interest rate differential between the US and SA in order to prevent very severe rand depreciation.
The rand today reached its strongest level this year, at R14.89/USD, with financial market sentiment buoyed by the Fed’s strong economic outlook, bolstering risk assets. However, there is still uncertainty on the effects of the war, but the outlook for ceasefire is improving.

Commodity prices soften on ceasefire hopes
16 March 2022
Calming commodity prices have reduced SA’s expected fuel price hike for April, pulling it back towards R2.00/litre
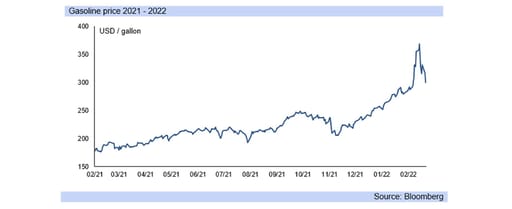
Calming commodity prices have reduced SA’s expected fuel price hike for April, pulling it back towards R2.00/litre and likely eventually below this as oil prices subside to a degree and the rand has seen mild strength, although there is another 15 days still for the price determination.
With heady inflation pressures from wheat and fuel prices (with around a quarter lag for wheat) and a month for fuel prices, April is currently expected to see a R2.15/litre, R2.95/litre and R2.51/litre hikes in petrol, diesel and paraffin prices respectively without state intervention.
The winter wheat harvest in SA will not cover domestic demand, with SA importing about 50% of its needs, and this expected price elevation risks higher Q2.22 and Q3.22 inflation figures from this source if prices do not moderate instead, heavily pushing up bread prices.
The state could institute bread price controls in extremis, but on a longer term basis this would risk limiting supply. The perceived progress towards a ceasefire has cheered markets, and investors have retreated from safe havens, with the gold price moderating.
However, the Russian/Ukraine war will still have a negative effect on affected crops, and so their prices, along with oilseed crops (particularly sunflower), and also soyabeans which is significantly used in animal feed, all likely contributing to higher food price inflation in SA.
While commodity prices saw some moderation in recent days as markets had worried about a lengthier war and a further dimming in global economic growth prospects, there is also a high level of uncertainty, driven also by the recent Chinese lockdowns on new cases.
Global financial market investors have been spooked by rising risks in different geographies, and policy maker support will be key to weather the crises. China’s planned growth stimuli and market measures has had some recent calming effect, with the rand targeting R15.00/USD again.
The war in the Ukraine and the hard lockdowns in China will still have lingering negative effects on supply of goods, which will keep prices relatively elevated, even if the recent panic pricing ascent has subsided for many, and levels are back to a few weeks earlier for a number.
Commodity prices were elevated before the war began on 24th February, and while many have returned to levels around 22nd February, still relatively high prices (even excluding the price hump of early March), will keep SA’s inflation above 5.0% y/y for the majority of 2022.

Russia/Ukraine war could shave 0.2% off global growth
10 March 2022
Of our three scenarios, a contained conflict that continues into the second quarter of this year is the most likely
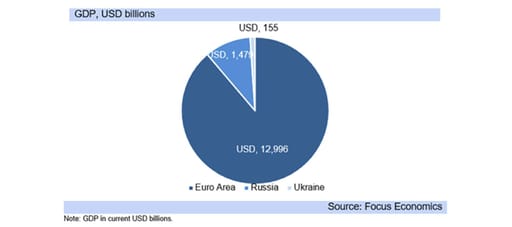
The Russian/Ukraine war’s effect on energy and food prices is already likely to weaken European and global 2022 GDP growth forecasts from January. But substantially worse would occur should the war drag on, particularly in the absnece of supportive policy measures by governments and central banks.
An EU summit today is expected to discuss a new investment and growth package, with measures to alleviate the war’s effects, which reduced some stress in financial markets. But the measures are unlikely to mitigate all of the downwards pressure on global growth.
There are three scenarios for the Russian/Ukraine war:
1. The unlikely scenario of a fairly quick war
2. A war that persists through March and well into Q2.22 (the expected case)
3. A war in which NATO countries become actively involved, i.e. WWIII (an outcome with around half of the probability of scenario 2)
Our expected case scenario does not include an extremely protracted war between Russia and the Ukraine into 2023, nor a nuclear war or WWIII.
Russia may settle for an agreement where it regains part of the Ukraine and possibly other territories, but talks have not proved productive so far. Estimates view Russia running into severe financial difficulty by June as heavy sanctions and oil bans bite.
The rand strengthened today on expectations of European stimulus packages. Hopes that talks between Russia and the Ukraine would bear fruit also lent short-lived support to the currency until Russia rejected the Ukraine’s proposals.
Financial markets were also likely cheered by signals that the FOMC may reduce the speed of its withdrawal of supportive monetary policy to counter negative growth effects and uncertainty.
The oil price dropped to US$115.5 today (R111.1/bbl yesterday). Should the rand’s recent strength persist, this would reduce the R2.44/litre petrol price hike building for April (diesel R3.35/litre), but not eliminate it, with state intervention needed.
We expect SA’s average CPI inflation rate for 2022 to be 5.5% y/y, ending the year close to 5.0% as commodity prices weaken after the Russian/Ukraine conflict. We now anticipate a SA’s 2022 GDP growth at 1.6% y/y, weighted down both by slwoing global growth and SA specific factors, including electricity shortages and slow policy reforms.

Business confidence lifts modestly
10 March 2022
The RMB/BER business confidence index (BCI) rose to 46 in Q1.22, but is held back by economic growth and inflation fears stemming from the Russian/Ukraine war.

The RMB/BER business confidence index (BCI) rose to 46 in Q1.22, from 43 in Q4.21, meaning 54% of businesses were dissatisfied with prevailing business conditions, and the reading in negative territory still, i.e. below the neutral 50 level. The outcome is in line with the long-term average of the index, which is also 46.
With the Q1.22 BCI survey taking place between 9th to 28th February, it has been influenced by the advent of the Russian/Ukraine war on 24th February. Both upwards inflationary pressures and a negative economic growth impact are likely from the war, while stress has increased in global financial markets. Markets still anticipate substantially higher interest rates in SA this year and next, which is likely adding to the depressed nature of the business confidence reading in Q1.22 (below 50 signals a depressed confidence environment).
Businesses consequently will worry about the ebbing purchasing power of consumers, and global growth forecasts will likely be revised down. Markets and policy makers have been viewing the Russian/Ukraine conflict as more of a temporary supply disruption than a severe threat to global growth, but (likely) downward adjustments in economic growth expectations could see more risk aversion in global financial markets.
Uncertainty is high, and the Russia/Ukraine war has persisted for longer than markets initially expected, driving up commodity prices and seeing SA’s value of economic transactions rise substantially on these high commodity prices, recording a consequent upswing in the domestic business cycle in Q1.22 on a rand basis.
Manufacturing, wholesale and vehicle dealership activity increased in Q1.22, the latter impacted by improved stock levels with the global supply chain showing improvement in deliveries from Q4.21. Wholesale sales were driven by commercial demand for machinery and chemicals on the impact of strong commodity prices for the agricultural and mining sectors. Manufacturing benefited from improved exports and domestic demand.
However, global growth is now at risk of weakening into, and over, Q2.22 and so have a future negative impact on SA’s economic performance, which is heavily influenced by the performance of the global economy.

SA bond note: Powell confirms that the Fed funds target rate will be hiked
10 March 2022
The US is widely expected to deliver a 25bp hike in its Fed funds target rate in March, confirmed by Fed Chair Jerome Powell’s speech, stating “we expect it will be appropriate to raise the target range for the federal funds rate at our meeting later this month”.
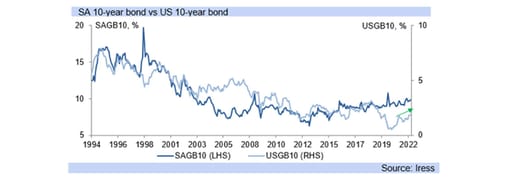
Adding “we are attentive to the risks of potential further upward pressure on inflation expectations and inflation itself from a number of factors. We will use our policy tools as appropriate to prevent higher inflation from becoming entrenched.”
Powell’s “Semiannual Monetary Policy Report to the Congress” speech addressed “Russia's attack on Ukraine” and highlighted that “the implications for the U.S. economy are highly uncertain, and we will be monitoring the situation closely.”
The Russian/Ukraine war is not expected to derail the planned normalisation of US monetary policy currently, with Powell also confirming that the FOMC will reduce the size of the Fed’s balance sheet after it has begun hiking rates, and has phased out QE.
However, he added “the near-term effects on the U.S. economy of the invasion of Ukraine, the ongoing war, the sanctions, and of events to come, remain highly uncertain. Making appropriate monetary policy in this environment … means we will need to be nimble.”
President Biden’s recent State of the Union Address (SOUA) also highlighted strong inflation concerns, stating “inflation is robbing … (Americans) of the gains they might otherwise feel”, “that’s why my top priority is getting prices under control”.
The US ten-year treasury yield climbed 17bp on the news, and the implied fed funds futures rates strengthened to fully factoring in a 25bp lift at the March FOMC meeting, after the market rate view had seen some recent weakening as the Russian-Ukraine war intensified.
US inflation climbed to a heady 9.7% y/y for PPI for the month of January (from 9.1% y/y), and 7.5% y/y for CPI (previously 7.3% y/y), with the US breakeven rate reaching 2.73% from 2.36% in January, spurred higher also by the inflation releases.
The obdurately high inflation in the US has clearly created concerns that the pressures would become broad based, embedding into price systems. Today the US ten year yield rose further, to 1.87% (from 1.52% yesterday, 1.34% on Tuesday) as markets price in further hikes.
February PMI reflects continuing rebound of SA's manufacturing sector
1 March 2022
The headline Purchasing Managers’ index (PMI) climbed a further 1.5 points to 58.6 in February, with increases across the board

The seasonally adjusted (SA) headline Purchasing Managers’ index (PMI) climbed a further 1.5 points to 58.6 in February, notably ahead of consensus expectations (Bloomberg) of a decline to 56.3.
The result was supported by a strong pickup in all subcategories. Specifically, new sales orders jumped to 56.9 from 55.5 previously: “the quickest increase in new sales orders since the second quarter of 2021,” according to the Bureau for Economic Research (BER). A further improvement in exports was likely a significant contributing factor.
Moreover, business activity grew by a further 3.0 points to a notable 59.6 in February on a likely pick-up in demand as COVID-19 restrictions remain lenient, supporting sentiment. According to the BER, the average level for the first two months of 2022 is well above the final quarter of 2021.
While this is positive for the trajectory of the manufacturing sector, renewed bouts of load shedding remain a risk, while rising geo-political tensions globally could affect international trade at a time when supply side constraints are still a key issue.
February’s pleasing result also saw the employment gauge lift, moving into expansionary territory (above 50).
The index measuring expectations with respect to future business conditions lost a bit of ground but remained elevated at 69.5, after reaching an “almost four-year high” in January.
The purchasing price index however climbed moderately, rising to a marked 89.8. Additional fuel price hikes are likely to continue adding to manufacturing cost pressures. Indeed, marked increases in both petrol and diesel prices are expected tomorrow and with the oil price climbing -- and the domestic currency vulnerable to portfolio outflows on global risk aversion -- we will likely see further fuel price hikes going forward.
Depending on how the Russian Ukrainian conflict plays out longer term, risks to the global outlook remain, even as major economies are putting the worst effects of the pandemic behind them.

Escalating Ukraine/Russia conflict drives oil prices over US$100/bbl
24 February 2022
The Brent Crude oil price is likely to climb significantly higher as hostilities intensify.
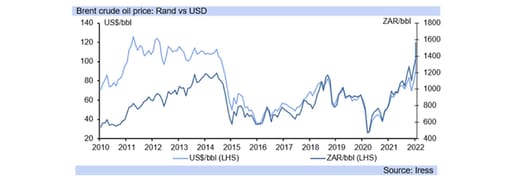
Financial markets have been roiled in recent days by the escalating crisis in the Ukraine, pushing up the Brent crude oil price rising to US$97/bbl yesterday (rand R15.17/USD) and today to US$102/bbl (R15.37/USD) with the potential for further escalation.
For SA, which imports oil instead of exploring and extracting its own, higher oil prices would push up inflation substantially. The petrol price, already at R20/litre, could jump to R25/litre in the near term. A R1.26/litre increase is building for March -- a figure that would be would be significantly higher were it not for some rand strength earlier in the month.
South Africa’s trade surplus, currency and government finances have all benefited from the strong export value of commodity prices in the past eighteen months. SA is a key commodity exporter (chiefly of metals, minerals and agricultural products), but an escalation in hostilities in Eastern Europe could see commodity prices falling as markets anticipate lower economic growth.
OPEC+, however, keeps its oil prices high by quota controls, and has already demonstrated supply shortage this year, bolstering the oil price above US$80/bbl even before the conflct began.
Russia is a key oil and gas exporter, and there may be little coincidence in the timing of hostilities, with the Ukraine now in the depths of the Northern Hemisphere winter and Europe heavily reliant on oil, coal and gas.
The increased likelihood of war presages further supply shortages in an already tight market. Precious metals have gained significantly on safe haven flows, but some other (non-energy or precious metal) commodity prices have dropped.
The futures market for commodities has been running very high this year, especially contracts for immediate delivery. But further escalation in military conflict, particularly one which draws in other countries in region and beyond, is likely to yield a slump, leading commodity prices lower.
Russia is expected to push its objectives and persist with its aggressions, but these could wax and wane on interactions with the US/UK and others involved in attempting a peaceful resolution.

High commodity prices keep CPI inflation elevated
16 February 2022
January CPI inflation dropped to 5.7% y/y (0.2% m/m), with a small fuel price cut counterbalancing higher service and food prices.

Food price inflation has started rising again, at 5.7% y/y in January, up from 5.5% y/y in December, and excluding non-alcoholic beverages is at 6.2% y/y, up from 5.9% y/y in December.
Food prices have been subject to increased production costs and pushed higher by elevated commodity prices globally. International agricultural food and non-food prices also been impacted by supply chain constraints and strong demand. Domestic production has seen mainly imported fertilizer, herbicides and insecticides prices rise by over 50% in the 2021/22 planting season (Agbiz).
This has made crop losses from flood damage very costly, while the La Nina weather phenomenon has seen some areas become too wet to replant at all. In turn, this has pushed up animal feed prices for grain and soybean, although pastures have seen substantial benefits for grazing.
Globally supply has battled to keep up with demand for fertilizer, chemical prices have risen sharply as have energy costs for transporting goods, and Agbiz also warns “the winter crop producers of South Africa could experience higher input costs as was the case for the 2021/22 summer crop planting season. Such conditions would overshadow the profits of the 2021/22 large crop”.
Oil prices at over US$90/bbl are not expected to subside in the immediate term, higher than a month ago when they were closer to US$85/bbl (in January), and US$73/bbl in December with this having been only a temporary moderation in the upwards fuel price climb over most of 2021.
January’s petrol price easing was largely reversed in February, and a further price hike of up to R1.20/litre is currently seen for March, although government does use the slate levy to absorb sudden fuel price changes as well, and this particularly occurred in February when the under recovery was running well above R1.00/litre, and at times closer to R2.00/lite but government did not pass it through.
The slate levy is used to smooth the fuel price, and the petrol price increase in March may be around 60c/litre again, even though the under recovery is much bigger, but government is likely again not to pass it all through.
Core CPI inflation, which excludes food and non-alcoholic beverages, fuel and energy prices from the CPI), came out at a very subdued 3.5%, reflecting the heavy commodities impact on SA prices.

Withdrawal of policy support measures will rein in the commodity boom
9 February 2022
But despite a weaker demand outlook, commodity prices are unlikely to collapse in the first half of 2022.
Despite slower economic growth in most economies, following last year’s heady rebound, the world’s economic recovery remains on track to reach pre-pandemic levels by year-end. But the global macro-economic environment this year will be the least supported by policy measures since the pandemic began, and this has already weighed on levels of economic activity in January, with knock-on impacts for commdity price growth.
The recent gain in commodity prices has provided some support for the domestic currency. But global PMIs have softened in SA’s key trading partners, and for as long as supply chain disruptions and shortages persist the recovery will remain uneven.
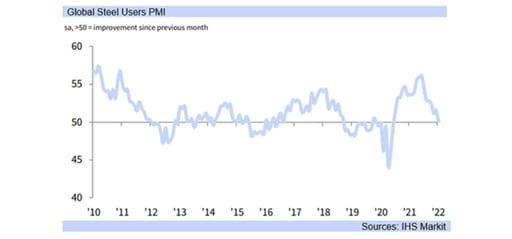
Global economic growth concerns have reduced the impetus for commodity price growth
Economic activity slowed at the outset of the year as major economies navigated the Omicron wave. IHS market reports that consumer service activity contracted in January for the first time in nine months, with the global composite PMI dropping to 51.4 from 54.3.
The risk-averse market mood fed into February as markets priced in extreme interest rate hikes, causing concerns on economic growth and market volatility. Investors have consequently been bracing for an environment of higher global interest rates and lower economic growth.
The monthly Risk Appetite Index (based on data from about 100 institutional investors) was unchanged from the low recorded in January, with also IHS highlighting that “the past two months represent the first period of risk aversion seen since the survey began in late-2020."
But despite weaker demand in January for copper, steel and aluminium, commodity prices are not expected to collapse in H1.22
Oil prices are expected to fall meaningfully in H2.22
The oil price has been climbing towards US100/bbl on supply shortages and escalating demand, creating severe inflationary concerns, exacerbated by political tensions between Russia and Ukraine.
However, the EIA (the US Energy Information Administration) predicts the price of brent crude oil will dip to US65/bbl by 2023, with variability in the forecasts. Short-term, oil prices are expected to remain elevated, before moderating from the middle of the year as supply improves.
But climate change concerns and the strong psychological shift away from fossil fuels in many nations are not expected to result in oil prices collapsing in the medium-term.
Investors concerned about ESG
An interesting global survey from POLITICO showed the majority of respondents believed companies, and not consumers, taxpayers, governments, should bear the costs of combatting climate change.
The United Nation’s Intergovernmental Panel on Climate Change collates widespread scientific research in assessing climate change. The latest report confirms surface temperature will continue to increase until at least the mid-century. “Global warming of 1.5°C … - 2°C will be exceeded … unless deep reductions in CO2 and other greenhouse gas emissions occur in the coming decades.”
While climate change effects so far have been minor, compared to what we can expect in the future, it appears that many people are choosing not to worry until the impact to their lives is more tangible.

Electricity supply constraints continue to impede optimal economic activity
3 February 2022
Generation and distribution of electricity contracted by a further -3.7% y/y and -2.7% y/y respectively in December, following declines of -3.7% y/y and -2.4% y/y in November.

Looking at a breakdown of the volume of electricity delivered per province, there was a broad-based decline, barring the North West province and Eastern Cape.
The country‘s electricity supply woes continue to remain a key drag on SA’s GDP potential, with Eskom’s generation business plagued by aging infrastructure, vandalism and a history of poor maintenance.
SMMEs who have been particularly hard hit by the pandemic are vulnerable to electricity supply disruptions at a time when they are trying to claw back profits lost during periods of stringent lockdowns.
The country experienced some reprieve from load shedding over the festive period, however Eskom recently announced the commencement of stage 2 load shedding in order to replenish emergency reserves. Its CEO, Andre de Ruyter recently highlighted “… much still needs to be done for Eskom to achieve operational sustainability and ensure energy security for South Africa”. Extending the operating life of the Koeberg Nuclear Power Station remains a priority.
The utility's Energy Availability Factor (EAF) remains well below optimal levels. Going forward, Eskom “will continue to rely on renewable energy sources to play a significant role to ease the pressure on the national grid.”
The cash-strapped SOE remains a major drag on the country’s fiscus. The absence of cost-reflective tariffs and the unmanageable debt burden continue to weigh on the utility’s profitability, which is exacerbated by significant overdue municipal debt.

The update of SA's CPI inflation components does not see substantial changes
2 February 2022
Inflation pressures in SA have been on an upwards trend on the consumer side, pushed up by some of the same pressures experienced globally
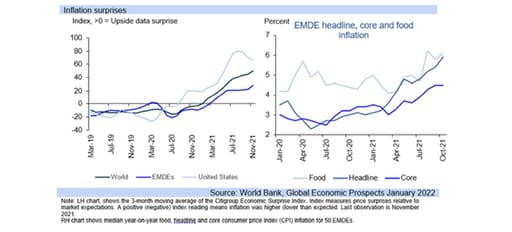
South Africa sees the normal five-year review to its inflation survey take effect from the publication of the January CPI inflation figures later this month (on the 16th), but unlike the previous update in 2017, it is not expected to have a substantial effect.
Inflation pressures in SA have been on an upwards trend on the consumer side, pushed up by some of the same pressures experienced globally, particularly higher fuel and food prices, with domestic food prices influenced by prevailing global food costs.
However SA’s CPI inflation has not accelerated to the extent of that of the US (latest print 5.9% y/y versus US 7.0% y/y), with the US seeing a high degree of fiscal stimulus which substantially increased consumer spending power, and so demand led inflation pressures.
On the producer side, SA saw PPI inflation climb to 10.8% y/y in December 2021, up substantially from 3.0% y/y in December 2020, driven by high commodity prices, base effects in some subsectors and high transport and equipment costs driving up supply cost pressure.
Globally producer price inflation is generally running at high rates too, reflective of the strong supply side price pressures as global supply chain costs remain elevated, despite recently plateauing at high levels, but unlikely to collapse in the next few months.
PPI inflation in South Africa of 10.8% y/y in December, is not dissimilar to China’s PPI inflation reading of 10.3% y/y, with domestic inflation impacted by high and rising import costs, not least of all shipping costs.
Low production costs in China helped moderate inflation globally in the 2000s, and keep it anchored in the 2010’s decade, but its rapidly rising producer prices are raising concerns about already high global consumer inflation rates, and how long they will persist.
Rapid increases in chemicals, rubber and plastic products prices (34.7% higher y/y), along with metals prices (up 23.6% y/y for base and fabricated metals and 40.9% y/y for basic iron and steel) have pushed up PPI inflation in SA, stemming from high commodity prices globally.
Globally inflation is still at a heady pace, and risks seeing a stretched decline through this year as opposed to the quick collapse that was hoped for, but high inflation is not likely to be permanent either, just not as transitory as markets and policy makers initially believed.

Income from the tourist accommodation industry rose by 5.5%
24 January 2022
Income derived from the tourist accommodation industry grew by a modest 5.5% mmsa in September, but remains significantly down on pre-pandemic levels

Income derived from the tourist accommodation industry grew by a modest 5.5% when measured on a month-on-month seasonally adjusted (mmsa) basis in November, following increases of 42.2% mmsa and 20.3% mmsa in August and September respectively (a rebound from the significant downturn following the July riots and unrest).
Industry occupancy rates climbed slightly in November but remained under 30.0%, markedly below pre-pandemic readings. Indeed, local tourism as well as arrivals from the SADC region have largely sustained the domestic tourism industry, one of the worst affected sectors of the economy.
International tourist arrivals however remain key to many operators in the local market. Pre the discovery of the highly transmissible Omicron variant, the lifting of travel bans by key tourist markets as cases globally waned and lockdown measures were eased saw a 235% year-on-year increase in tourists entering the country in October 2021, according to Stats SA’s latest tourism and migration report. Tourists from international countries (excluding Africa) increased to 59,475 from just 8,325 in October 2020.
The seasonally significant festive season was however disrupted by the rapid spread of the Omicron variant, which saw many countries reinstate travel bans, leading to a significant loss from cancelled accommodation. However, moderate local lockdown measures saw South Africans flock to popular holiday destinations, buoying the domestic tourism sector. A number of key markets have subsequently dropped travel bans which is positive for SA’s significant tourism market.
Indeed, global tourism has been one of the most devastated sectors of the economy. “The pace of recovery remains slow and uneven across world regions due to varying degrees of mobility restrictions, vaccination rates and traveller confidence”, according to the UNWTO World Tourism Barometer.
Moreover, the latest UNWTO (World Trade Organisation) Panel of Experts survey results indicate that while prospects for 2022 have improved, “the majority of experts (64%) now expect international arrivals to return to 2019 levels only in 2024 or later, up from 45% in the September survey”.

Inflation jumped to 5.9% in December
19 January 2022
Year-on-year inflation accelerated from 5.5% in November, chiefly on higher transport costs

December’s CPI inflation print of 5.9% y/y was 0.6% higher than the November's on a month over month basis. Higher transport costs were the primary driver, accelerating 1.9% m/m to outstrip smaller increases in the rental, food and residual components of CPI.
Looking ahead, food price inflation is expected to climb higher as heavy rains have caused crop damage and delayed planting. Lower yields are thus expected for cops such as sunflower seeds, maize, sorghum, soybeans, other dry beans and peanuts (Grain South Africa producer survey, Agbiz). The current La Nina phenomenon, expected to last until Autumn, causes extreme rainfall, in contract to the dry conditions of Le Nino.
Transport inflation rose from 15% y/y in November to 16.8% y/y in December, as petrol prices rose by 75c/litre. While there was a 68c/litre cut in January, a huge increase of around R1.30/litre is building for February on the back of a rising global oil price. Brent crude oil price has reached US$87.5/bbl from closer to US$73.5/bbl a month ago.
As the economy recovered ground after the devastating impact of 2020 on businesses and households, many businesses took the opportunity to pass through price increases. Noteworthy price hikes were felt in clothing and footwear, housing and utilities, rent and electricity, restaurants and hotels, personal care and financial services.
We now expect CPI inflation to average closer to 5.3% y/y for 2022, as the December figure established a higher base for the 2022 CPI figures.
December’s CPI print will likely give impetus to the SARB’s hawkish tone, following the 25bp repo rate hike November. The SARB targets inflation in a six to twenty-four month period and may now look to deliver a further 25bp hike in January instead of waiting until March.

Rand runs towards R15.20/USD on market optimisim
12 January 2022
Global markets welcome clarity on the US monetary policy outlook, while the domestic FRA curve remains elevated, supporting rand strength
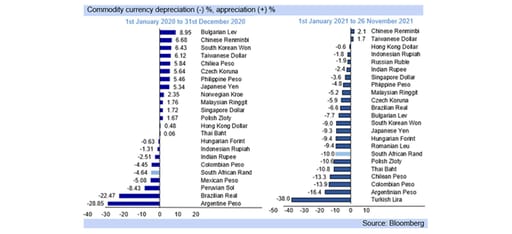
The rand has now pierced the R15.50/USD mark. The currency averaged R15.76/USD for the first few days of this quarter, but will likely to average R15.50/USD if not higher for the quarter.
Markets are gaining optimism from the increased certainty of US monetary policy, and the rand is gaining from the still very elevated domestic FRA curve, with about a 2.00% hike in interest rates factored in this year, starting with a 25bp lift at this month’s MPC meeting.
We expect a 25bp lift in the repo rate this quarter, after the 25bp hike at the last MPC meeting (November 2021). But it's likely that South Africa’s Reserve Bank (SARB) will wait until March to raise rates again, as a rate hike at every meeting would be overly aggressive, even given the current hawkish stance of the MPC.
Indeed, with six meetings a year, the MPC would have to hike in larger increments than 25bp to achieve a 2.00% hike overall in 2022. Such a steep trajectory is unlikely.
The next FOMC meeting of the US Federal Reserve is on 26th January, six weeks after the last one. We expect quicker QE tapering and also signals of US rate hikes and Fed balance sheet reduction later this year, even as US monetary policy remains broadly accommodative.
December’s US CPI inflation rate, due out today, is expected to rise to 7.0% y/y from 6.8% y/y (5.4% y/y from 4.9% y/y excl. food and energy), pushed up also by commodity prices rising by 5.5% y/y overall in December (Economist commodities price index).
Food and agricultural nonfood prices in particular are up -- 7.8% y/y and 27.6% y/y respectively -- adding to the upwards price pressures for global inflation, but also driven by base effects.
As base effects reverse from April, we expect US CPI inflation to drop substantially this year, averaging 3.6%. Other data supporting a more dovish stance was the nonfarm payrolls outcome of 199K vs expectations of 450K.
While some are forecasting a US interest rate hike as early as the March FOMC meeting, we foresee a more gradual rise, along the lines of three 25bp hikes, with the first in Q2 2022.

The unemployment rate climbed to 34.9%
30 November 2021
The official unemployment rate rose by 0.5% points in Q3.21, evincing the effects of the pandemic on the already dire unemployment situation

The official unemployment rate rose by 0.5% points in Q3.21 to 34.9% the highest rate since the commencement of the QLFS in 2008, evidencing the dire effects of Covid-19 on South Africa’s already fragile economy pre-pandemic.
Special tabulations done by Stats SA to ascertain “movements between labour market status categories” revealed that “a large number of persons moved from the "employed" and "unemployed" statuses to the "not economically active” categories between the two quarters”. As a consequence of these movements, the labour force participation rate declined by 2.3% points to 55.2% in Q3.21.
Formal sector, non-agricultural employment fell by a notable -5.6% measured on a quarter-on-quarter basis. Specifically, 571,000 formal sector jobs were shed during the quarter as unrest and looting in parts of the country, coupled with stringent lockdown measures hindered economic activity, weighing on already struggling businesses. While the informal sector of the economy registered a marginal gain of 0.3% q/q, total employment (incl. agriculture and private households) still fell by -4.4% q/q.
A disaggregation of the data on an industry basis, indicates that the decrease in formal sector (non-agricultural) employment was broad based with seven out of the eight industry categories surveyed reporting declines. The trade sector recorded the largest number of job losses at 272,000 over the quarter, followed by the community and social services sector (226,000).
The expanded unemployment rate, (which includes individuals who desire employment regardless of whether they are actively seeking work) climbed 2.2% points in Q3.21 to 46.6%, from 44.4% previously and is a marked 17.1 percentage points higher than the rate logged during the same period in 2008, evincing the extent of SA’s growing unemployment crisis.
The youth category (15-24 years), a priority area of government, which has been particularly affected by the country’s mounting unemployment problem rose further to 66.5% in Q3.21, from 64.4% in Q2.21. Indeed, a focus on improving the quality of and access to education remains essential. Indeed, according to Stats SA of the 7.6 million unemployed persons in Q3.21 “as many as 51,8% had education levels below matric”.
Q4.21 generally sees a seasonal pick-up in employment. However, travel bans put in place by a number of important SA tourist markets, following the discovery of the Omicron variant is likely to dampen the level of economic activity anticipated. Additionally, while SA is currently still on lockdown level one, the President could enforce further lockdown measures in response to a spike in cases.

Headline producer price inflation climbs to 8.1%
25 November 2021
PPI climbed to 8.1% y/y in October, largely due to inflation in coke and petroleum products.

Headline producer price inflation (PPI) for final manufactured goods climbed to 8.1% y/y in September, from 7.8% y/y in September 2021. The increase, slightly ahead of consensus expectations (Bloomberg) of 8.0% y/y, was underpinned by inflation within the coke, petroleum, chemical, rubber and plastic products grouping, in which fuel price dynamics are captured.
Specifically, inflation within the coke, petroleum, chemical, rubber and plastic products category, which comprises just under 20.0% of the PPI basket, increased to 17.5% y/y in October, from 15.3% y/y in September, and accordingly added 3.4% points to the headline outcome, versus 3.0% points previously.
Moreover, the high oil price, combined with domestic currency weakness, drove up fuel prices in November, which will have a material effect on headline inflation. Petrol and diesel prices increased by R1.21/litre and R1.48c/litre respectively at the beginning of November.
Manufactured food price inflation eased slightly from September’s reading of 6.7% y/y but remained elevated at 6.5% y/y. The food products, beverages and tobacco products category added a further 2.0% points to the headline reading.
Meat and meat products inflation diminished for the 5th consecutive month (measured on an annual basis) to 6.6% y/y, from 7.9% y/y and 10.7% y/y recorded in September and August respectively, as did producer price inflation within the starches, starch products and animal feeds sub-category and dairy products grouping. Meat prices could, however, experience some upward pressure in the near term.
According to Agbiz, "Cattle and sheep slaughtering activity remains at relatively lower levels compared to 2020." But oil and fats’ prices ticked up to a notable 26.7% y/y in September. South Africa is a net importer of oils and fats and these product prices have remained elevated in the global market.
Inflation within the metals, machinery, equipment and computing equipment segment moderated to 10.1% y/y in October from 10.8% y/y in September, largely on the back of the easing in structural and fabricated metal products prices, but still added 1.4% points (1.5% previously) to the annual headline reading.
Persistent supply chain constraints triggered by the pandemic saw producer price inflation for intermediate manufactured goods continue its upward trajectory in October, reaching a marked 20.4% y/y following readings of 19.5% and 17.7% y/y in September and August respectively.

Retail sales grew by 2.1% y/y in September
17 November 2021
Retail trade sales grew by 2.1% y/y in real terms in September, following August's -1.5% y/y (revised) contraction, buoyed by the textile and pharmaceutical categories.

The result, which was notably stronger than consensus expectations (Bloomberg) of a 0.7% y/y lift, was largely underpinned by robust annual growth from the textiles, clothing, footwear and leather goods category and the pharmaceuticals and medical goods, cosmetics and toiletries grouping.
Specifically, combined they contributed 2.3% points to the top line outcome, on the back of growth of 11.3% y/y and 10.4% y/y respectively.
However, when measured on a quarter on quarter seasonally adjusted basis, the measure used to calculate GDP retail sales fell by -5.4%, dragged down by July’s marked decline, triggered by the riots and unrest in parts of the country in July. Accordingly, it is expected to detract from Q3.21’s GDP reading.
Consumers have not yet recovered fully from the effects of the pandemic. Indeed, household debt is still elevated, above 66.0% of disposable income, according to data from the SARB while rising administered prices, particularly electricity and fuel costs continue to further dilute limited disposable income. Furthermore, consumer confidence remains subdued especially pertaining to the economic outlook.
According to an online survey conducted by TransUnion between the 10th and 16th of August (the survey included 1,100 adults in South Africa) over 60% of respondents “(i)ndicated their household income was currently negatively impacted due to COVID-19”. Although the survey took place soon after the damaging looting and unrest, which led to job losses, lost earnings and dampened confidence, the proportion of those citing the negative effects of COVID-19 on household income remained largely unchanged from responses collated earlier on in the year. Indeed, a substantial number of consumers remain unable to meet debt obligations. Specifically, according to the survey “forty-one percent reported they’ve been in arrears for a bill or loan in the past three months”.
Moreover, according to the results of the BankservAfrica Economic Transactions Index (BETI) for September, which “measures economic transactions processed by BankservAfrica via the National Payments System (NPS)” the index logged a quarterly decline of 0.6% in September 2021, the first quarterly BETI decrease since July 2020.
Although conditions have improved from those experienced in the second quarter of last year, retailers continue to face a myriad of challenges. Persistent global supply chain constraints have resulted in longer lead times and stock shortages which have driven up input costs. Moreover, rising administered prices continue to weigh on profits.
The country’s improved vaccination rate accompanied by the easing of stringent lockdown restrictions, however, should benefit retailers during Q4.21 as the holiday season approaches.

Election Update: the coalitions the ANC forms could be key for its policies
5 November 2021
The 1st of November 2021’s municipal elections outcome was similar to survey polls for the DA and EFF, but quite divergent for the ANC, with a very low voter turnout.

Of the 26 million registered voters only 12million voted (46%). Small, localised parties did well at the municipal level, as voters turned to those they trusted in their councils, resulting in a 22% vote for other parties, on over 300 parties/individual candidates.
The growth of ActionSA was rapid, and is seen to provide non radicals an alternative to the EFF, for those who chose to vote. Potentially providing a cross over party, ActionSA could see further rapid growth in 2024’s general election. In this year’s (municipal) elections it gained a cross racial support base. Much will depend however on the ability of the party to gain traction ahead of 2024.
High voter apathy (46% turnout) shows the ANC was particularly afflicted, with survey polls expecting it to get around 56% on a 45% turnout of eligible voters instead of its actual 46%. The vote has been split amongst small parties more than expected and shows the high ability of voters now to identify with a small party’s interests, but with these gaining less than 1% nationally. However, the fall in voter numbers also signifies growing belief that voting does not matter as the vast disillusionment the Zuma Presidency’s years of state capture and corruption has hit deeper than may have been anticipated.
This does not mean Ramaphosa is not trusted overall but instead that individuals are voting for their metros and councils, and not Ramaphosa himself, and this showed in the results. With a massive decline in ANC popularity overall, the party needs to take care not to lose him in its party election next year as likely only he can boost the ANC vote overall in 2024’s general election, which is essentially a presidential election.
Investors are likely happy with the poll results themselves, but not with a coalition prospect of the ANC and EFF as this would herald a swing towards the extreme left, with the EFF already stating it requires the ANC to join on it on its extreme total land confiscation aims.
Left to extreme left politics are typically anti-business either in a mild form through a high government command of the economy, high degree of regulation (of the private sector) and extreme state intervention in the economy and so of the private sector, or in more extreme destructive forms for economic growth and private sector job creation on the extreme left. Voters have shown they would strongly prefer the opposite.
The ANC should take note of the voter swing away from left-wing, old style heavily socialist dogma, with most preferring social democracy, as shown by the strong rise in ActionSA and many smaller parties. Delving deeper instead into control, micro-management and regulation of the economy, such as many policies from the DTI department, will slow economic growth and job creation and will most likely just see further vote slippage for the ANC, as support dwindles nationally towards 40% and below.
The ANC obtaining below 50% is a clear indication of high dissatisfaction from the electorate on the way it has been perceived to conduct itself over the past decade, as voter support has declined over the 2010s decade compared to when the ANC obtained 70% of the vote in 2004. The 2004 outcome was an endorsement of the good policies, strengthening economic growth and declining unemployment engineered under the Mbeki Presidency, from 1999 to 2008 as the private business sector expanded rapidly.
The 2009 general election saw the ANC lose ground on the ousting of Mbeki and incoming President Zuma, with support dropping to 66%, and then to 62% by 2014, and in 2016’s municipal election seeing national support for the ANC decline to 54%, rescued by new President Ramaphosa in 2019 with a rise to 58%.

Another two successive months of mining production growth
15 September 2021
Elevated commodity prices and buoyant global demand continue to gavanise the industry despite logistics constraints.

The mining production update for July also includes June’s outcome, owing to system issues at the Department of Mineral Resources and Energy which prevented them from providing the June data timeously.
Mining production rose by 19.1% y/y and 10.3% y/y in June and July respectively, following May’s 21.9% y/y climb. Elevated commodity prices and buoyant global demand continued to support mining activity. However, the unrest that took place in Kwa-Zulu Natal and other parts of the country during July, which also affected key transportation routes, led to a number of commodity producers reporting being unable to obtain key inputs required for production (such as gases and explosives).
Annual growth in production in June and July was underpinned primarily by iron ore and PGMs. Specifically in June production of PGMs and iron ore climbed by 59.6% y/y and 34.9% respectively adding a combined 14.1% points to the topline reading. In July production of PGMs decreased substantially but owing to its marked weighting in the index it still added favourably to the headline outcome. Concerns around the impact of the semi-conductor shortages on the global automative sector and thus PGM demand remains. Iron ore production grew by a further 42.9% y/y contributing 3.9% points to July’s result.
A robust rebound in global trade and growth, following the fallout from COVID-19, has led to a sharp increase in industrial demand, with the World Bank’s metals and minerals index up 21% between January and July 2021. However, rates of growth in manufacturing activity have begun to ease. According to the latest JP Morgan Global Manufacturing PMI survey results the “upturn in the global manufacturing sector lost further momentum during August, as rates of output growth decelerated in several major markets”. Supply side constraints remain a key impediment.
Rising Covid-19 cases globally, with the risk of further lockdowns, remains a downside risk to the global growth outcome and SA’s own growth trajectory, which is heavily reliant on exports of commodities. SA’s pace of vaccinations has gained momentum, but the implementation of structural reforms needs to be hastened to improve SA’s competitiveness and attract foreign direct investment. “Logistics remains one of the main constraints”, for the mining sector and indeed the South African economy and “it is one of the main infrastructural reforms government has committed to undertaking," according to the Minerals Council South Africa.

SA bond note: foreigners return to South Africa’s bond market
1 September 2021
SA bond yields and the rand strengthen post Jackson Hole, on improved global financial market risk taking.
SA’s ten-year bond yield has dropped to 9.15%, from near 9.34% earlier in August, with the rand reaching R14.39/USD today, supported by improved global financial market sentiment. Foreign appetite for SA bonds deteriorated sharply over August with a -27.7bn net sell-off.
Investor concerns persist on the sustainability of government finances, the once-off boost to revenues from the commodity boom which has already weakened, is not a sustainable financing mechanism to deliver fiscal consolidation, and state expenditure has increased.
SA’s fiscal deficit to date at -R155.9bn (first four months of 2021/22) shows that it may come out lower than the -R482.6bn in the budget (potentially closer to -R460/470bn), but will be substantially larger than the -R209bn of the full 2017/18 year, and the -R231bn of 2018/19.
That is, the state’s finances have not improved that much at all, still worse than the pre-pandemic levels, although 2019/20’s three quarters’ of recession yielding a deficit of -R345bn would be closer to what is likely achieved this 2021/22 year (all main budget figures).
Unsurprisingly, the 5-year yields are still elevated, boosted also by the aggressive pricing in the FRA curve which shows accelerated interest rate hikes and so negatively impacts the shorter end of the yield curve, along with the high maturity load in the period as well.
While repo rate hikes are unlikely this year, projected debt and deficit ratios lower on GDP revisions, and weekly debt issuance down, there is still no recovery yet in sight for public finances from the harsh impact of COVID-19 lockdowns following on from 2019’s recession.
Domestic holding of debt are high, foreigners disinvested -R109.3bn this year, aware of the lack of material improvement on SA’s fiscal story to levels back to before 2019/20. Deficit projections for 2022/23 and 2023/24 of around -R400bn are still removed from pre 2019.
The flip flop in the state pension et al fund proposal does not obscure the fact that doing away with private pensions risks eradicating a key source of funding for state debt, still necessary given rollovers, if the state delves into the fund to pay for infrastructure expenditure.
Confusion over Social Development Departments green paper persists
Consequently, perceived high country risks remain for SA, and it is unclear whether the Social Development Departments green paper has been wholly withdrawn, partially withdrawn and will resurface with clarifications, or whether in spirit, as markets suspect, it persists.
What is clear is that it has caused market confusion, with expectations that the green paper should not have been published if it was not government policy, as some senior ANC officials have said it is not. Its publication highlights that it certainly is some factions intentions.
This is very negative for markets, due to the policy uncertainty and outright confusion created, with government having said in the past it wishes to reduce policy uncertainty not increase it, and the social development department stating it does not need approval for proposals.
Apparently, the green paper will be reissued and so the damage to business confidence, and policy uncertainty persists in what has already been a weak confidence period with the July riots which are seen to have been sparked by the anti-Ramaphosa pro Zuma/RET faction.
The state pension fund proposal has been viewed as having its origin with the RET faction and so the publication of the green paper doubtless was also from this perspective a further negative for business and investor confidence.
The green paper caused damage to labour relations with government as well, and worried employed South Africans in general given fears of the loss of their pension contributions through corruption and looting, among other malfeasance.
Damage to business confidence damages investment prosects, and so future job creation and GDP growth. If the Social Development Departments paper is not government policy it should not be published if government really is sincere about bolstering business confidence.
The ruling party and allies in the tri-partite alliance need to let go of disincentivising, if not prohibitive policies, including ones to the rapid expansion of its mining sector by private investment, so much to be gained on the fiscal revenue side, as well as jobs.
This is a particular worrying given the waning of the commodity boom and the fact that SA is not seeing an efficient usage of its mineral endowment as state regulations continue to trip up the necessary exploration and development of new mines.

Election note: voters are increasingly disillusioned with politics
26 August 2021
SA’s October municipal elections are not only at risk from the pandemic but also widespread public distrust of elected officials.

The municipal elections are potentially set for 27th October this year.
The polls come at a turbulet time for the country, following violent unrest in July and a harsh year and a half of Covid-19, which shows no immediate sign of abating.
Indeed, while the fourth wave of Covid-19 infections in SA was expected to start as early as October this year, the recent sharp about-turn in the previous decline in Covid-19 infections is concerning. With only 10million vaccines administered, and only 11.4% of the eligible poluation fully vaccinated, there is a risk that a municipal election in October could contribute to higher infections and deaths. The IEC has consequently sought to delay elections until February and a final decision is expected by 31st August.
July’s riots were followed by a lift in infections in KZN in particular, and there is no certainty that September will see a marld drop. October could therefore start off on a relatively high base, with vaccinations likely still well below 30%.
Surveys have shown willingness to delay elections and electioneering in the pandemic, even amongst most members of political parties, despite noises to the contrary by the parties’ leadership.
Afrobarometer shows a high two thirds of respondents feel elections should be delayed, with the survey taking place May to June (a 2.5% margin of error is noted).
However, trust in political parties and in institutions has diminished since the 2000s of the Mbeki government, which was characterised by strong delivery a drop in unemployment to 21%. Afrobarometer further finds that 67% of South Africans would be willing to forego elections even if a non-elected government could provide substantially better security and services, including housing and jobs -- the sobering result of state capture and corruption, combined with the apparent inability of the current government to address poor service delivery and rampant unemployment.

Gauteng announced a raft of plans to boost economic activity
5 August 2021
In May 2021, the capacity utilisation of manufacturing production rose to 78.6% of total capacity, from 76.3% in February, and 59.8% in May 2020.

In May 2021, the capacity utilisation of manufacturing production (the data is collected once every three months) rose to 78.6% of total capacity, from 76.3% in February, and 59.8% in May 2020. However, this reading is still well below the 83.4% average during the Thabo Mbeki period of good governance of SA in the bulk of the 2000s, which saw the fastest sustained period of growth.
The second and third quarters’ of the year typically see improvement in manufacturing utilisation, while the first dips - the month of January sees both a slow return to work and start to production for the year after the festive spend while retailers and wholesalers build up inventory before the holidays, then run it down in the January/February sales. However, South Africa’s third quarter will see substantial damage to its manufacturing capacity from July’s violent riots, and this will have a lengthy effect over 2022 as well, with rebuilding of infrastructure yet to commence generally.
Other countries which have seen severe damage to their economies from riot action have brought in a wide range of fiscal measures, including tax exemptions in distressed sectors, VAT exemptions on construction goods and services to assist in rebuilding infrastructure, VAT rebates to reduce food poverty, job creation initiatives, grants and cash transfers to afflicted small businesses and the poor.
Gauteng’s economic recovery plan includes some focus on these as well as identifying the need to bolster business confidence and funding for re-building, allocating R100million to rebuilding township development, including township industrialisation, special economic zones as well as backyard shack upgrades to create thousands of commercial and residential units in townships.
Up to a billion rand of blended finance is eventually envisioned to be matched rand for rand by private sector contributors and include 50% grant/50% loans for businesses in distress from the riots.

SA records a budget surplus of R63.1bn in June
2 August 2021
Improved revenue receipts will help to fund extended Covid grants and relief for businesses disrupted by looting and unrest.

South Africa's total tax collections rose by a marked 87.8% y/y in June, partly on statistical base factors as the economy recovers from last year's Covid-induced contraction. Personal income tax receipts grew by 23.8% y/y as people returned to their jobs following the stringent lockdowns. According to BankservAfrica data, aggregate take-home pay for all employees was up by 11% year-on-year. However, levels are still below those logged pre-pandemic with unemployment sitting at an elevated 32.6%.
Corporate tax receipts increased significantly on a year-on-year basis and by a notable 69.1% m/m, as June is an important month for provisional tax payments. However, businesses in certain sectors of the economy have been heavily affected by the pandemic, especially those in the tourism and hospitality related industries. According to Stats SA data, a further 217 businesses within the trade, catering and accommodation sector were placed into liquidation between January and June 2021.
Excise tax revenue has been severely constrained by the numerous alcohol bans instituted by government to free up beds in hospitals (usually occupied by alcohol related accidents) when Covid-19 infection rates spike. The latest ban (which has been subsequently lifted) will see excise tax revenue from this source dwindle in July.
On the expenditure side, debt service costs increased by 18.9% on a year-on-year basis and continue to crowd out social and investment spending.
As a result of the extended, stringent lockdown restrictions to curb the third wave and the significant economic consequences of the looting and unrest in parts of the country earlier this month, Treasury has committed additional relief funding, which according to Treasury will be covered largely by improved revenue receipts. However, that additional revenue could have helped hasten the path of fiscal consolidation and reduced some of the pressure on the severely constrained fiscus. Additionally, we have lowered our growth forecast for the year to 3.9% y/y from 4.5% y/y previously as a result of the unrest. A lower nominal GDP outcome for 2021 would accordingly have a dampening effect on currently projected 2021/22 fiscal metrics, a concern for ratings agencies.

Manufacturing operating conditions deteriorated significantly in July on restrictions and protest action
2 August 2021
The manufacturing PMI dropped substantially to 43.5 in July from 57.4 in June.

This decline in July reflects the effects of the tightening of domestic restrictions as well as of the protest action in Kwa-Zulu Natal (KZN) and parts of the Gauteng province. The Covid-19 linked restrictions will have hampered production linked to the alcohol and hospitality sectors in particular. The protest action resulted in the closure of some manufacturing plants. This, coupled with interruptions to transport, resulted in supply difficulties that will have affected production at a range of other manufacturers.
According to the survey “the manufacturing sector may also have been negatively impacted by the recent cyber-attack on Transnet, which saw operations at SA’s major ports temporarily grind to a halt."
August should see a meaningful recovery in production and demand as the domestic situation has stabilised and the government eased lockdown restrictions. Indeed, the business expectations sub-index lifted in July on improving expectations of business conditions in six-months’ time.

Fiscal riot relief lifts market sentiment
28 July 2021
Joint briefing by Dept of Finance, National Treasury and others gives clarity on where the money will come from
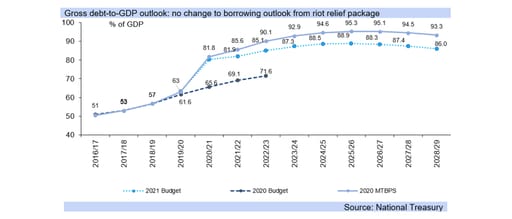
The violence earlier this month will likely cost South Africa's GDP about R49bn in real terms. But this blow will likely be softened by global macro-economic factors, including commodity prices and the pace of Covid recovery, that are working in the country's favour. Increased tax revenue receipts as a result of these factors will help to fund relief efforts that are desperately needed in the wake of the carnage.
The second quarter saw significant growth in commodity prices, which benefited both exports and tax revenues. Commodity prices were up 14.8% q/q overall (as per the Economist Commodities price index), bouyed by a substantial 19.2% lift in metals prices. Both of these upticks exceeded the respective increases of 14.7% q/q and 15.4% q/q in Q1.21.
Revenue collections for Q2.21 to date are up on estimates, with SARS stating today that tax revenue collections were very strong in the first (fiscal) quarter, exceeding those of the prior two fiscal year’s first quarters. The revenue boon came from a number of sources, including VAT and the mining sector.
Additionally, corporate tax revenue from the financial sector was higher than expected, while SARS has also had a better than anticipated performance in revenue recovery (well above that estimated) from compliance activities, also boosting the overall outcome.
SARS added that this greater than expected revenue collection, compared to that budgeted for in February 2021, is expected to adequately cover the cost of a number of measures announced today to provide R36.2bn in fiscal assistance to lessen the impact of the riots and looting.
In particular, the R350 social relief of distress grant is extended until end March 2022, which will cost R27bn, while the cost to Sasria from the riots damage is estimated at R15bn to R20bn (the Sasria balance sheet has R9.7bn, while R6.5bn is to come from reinsurance).
The police will be allocated an additional R250m, SANDF R750m. National Treasury highlights there will be no additional borrowing to fund this fiscal package (allaying rating concerns), with reprioritisations and revenue collections better than expected in February.
However, prior to the riots a better than expected economic outcome for 2021 of 4.5% was likely, and government’s fiscal position was expected to improve by R50bn to R100bn on the strong tax ensuing from the robust growth environment and strong commodity price effect .
With the damage to the economy and tax base from the violent riots, and consolidating commodity prices, the revenue collection overrun is now likely to be closer to R50bn, while the fiscal package announced today will not fully cover the losses faced by businesses.

Retail environment improved in May
14 July 2021
Recent lockdown restrictions and riots will weigh on Q3.21 confidence

Retail trade sales rose by 15.8% y/y in May, ahead of consensus expectations of 12.3% y/y (Bloomberg). The lift was largely underpinned by base effects following May 2020’s -11.9% y/y decline when lockdown restrictions were heightened, albeit less severe than April 2020.
Measured on a month-on-month seasonally adjusted (mmsa) basis retail trade sales increased by 2.1%, following contractions of -0.6% and -4.4% mmsa in April and March, respectively.
According to the BER’s retail trade survey for Q2.21 which reports on consumer expectations and activity, confidence amongst retailers climbed markedly in Q2.21, to a six year high, on “improved sales volumes and strengthened pricing power” leading to higher profitability. Specifically, retailers selling semi-durable and durable goods benefitted from expenditure by higher income segments of the market, who used accumulated savings (not used on leisure and transport during lockdown) to improve their work-from-home experience. The survey was however conducted between the 12 and 31 May, before lockdown restrictions were tightened.
Lockdown restrictions, in response to spikes in infection rates and the subsequent loosening of measures when cases recede, have a direct impact on consumption patterns as evinced by BankservAfrica’s Economic Transaction Index (BETI), which tracks the volume and value of South Africa’s electronic payments interbank transactions routed through BankservAfrica. Specifically, the index which exhibited significant declines in Q2.20 when the most severe constraints were in place gradually improved in line with the easing of lockdown restrictions.
The BETI for May indicates that the number of “actual transactions was 108.2 million, an improvement of 17.2% on a year ago”. Moreover, the total number of estimated monthly payments have risen by 13.1% between May 2021 and May 2020, as a number of workers have returned to their jobs over the year.
While the marked recovery in the salary base is positive for HCE, uncertainty around the current situation playing out in the country will weigh heavily on confidence, hindering the growth trajectory.

Annual mining production buoyed by base effects
13 July 2021
Mining production rose by a further 21.9% y/y in May, buoyed by base effects.

Specifically, production fell by -21.7% y/y in May 2020 when restrictions on production (although to a notably lesser degree than April 2020) were still in place and global growth concerns were heightened. May’s outcome was below consensus expectations of 31.5% y/y (Bloomberg).
The lift in production was largely broad based, with all minerals and mineral groups except coal and nickel experiencing some level of growth. The largest positive contributors were PGMs, iron ore and gold. The production of PGMs rose by a further 27% y/y in May, adding 6.1% points to the top line reading, on a robust recovery in the automative market.
Similarly, iron ore output increased by 48.4% y/y, adding a further 4.0% points, assisted by the rebound in global trade and growth following the fallout from Covid-19, which has led in turn to a sharp increase in industrial demand. Constrained seaborne supply has also aided the iron ore market, with prices up over 26.0% since January 2021.
Base metals in general are up notably, boosted by the pick-up in global manufacturing activity and new order growth. This is evidenced by the results of JP Morgan’s latest global PMI manufacturing survey for June which indicates that “global manufacturing remained in a strong growth phase in June, with output, new orders and employment all rising and business optimism at robust levels”, according to Markit.
SA’s mining sector, a key commodity exporter continues to benefit from the strong rise in demand for commodities as global growth rebounds and has played a key role in SA’s growth momentum as some other sectors of the economy continue to flounder. Notwithstanding this, the domestic mining sector continues to face numerous challenges hindering its ability to take full advantage of the current surge in demand. Key amongst these are electricity supply limitations, although announcements pertaining to increased generation are positive for the energy intensive sector. Furthermore, logistical constraints, especially rail and port issues continue to impede activity and export potential.
Further stringent lockdown restrictions (although not our expected case) coupled with the civil unrest currently playing out in the country remain downside risks to the country’s growth trajectory.

New vehicle sales up 20.2% in June
1 July 2021
New vehicle sales rose by 6 387 units or 20.2% y/y in June as exports benefit from the global economic rebound.
Aggregate new vehicle sales rose by 6,387 units or 20.2% y/y in June. The reading, while positive, is largely buoyed by statistical base factors. Specifically, new vehicle sales plummeted by around -31.0% y/y in June 2020, when restrictions were placed on economic activity. When measured on a month-on-month basis, however, sales fell by -0.8% in June.
New passenger car sales, which make up over 60% of total sales, grew by 28% y/y in June and by a modest 1.7% m/m. While the economy is recovering from lows experienced in Q2.20, with Q1.21’s GDP reading higher than anticipated, many consumers still remain financially constrained. Consumer confidence is subdued, having faltered in Q2.21, with respondents in the FNB/BER consumer confidence survey less confident about the economic outlook as the third wave takes hold. Additionally, fewer respondents deem it an appropriate time to purchase big ticket, non-durable items (like vehicles).
The light commercial vehicle category (incl. bakkies and mini-buses) which makes up a further 30% of domestic sales rose by 9.6% when compared to June 2020, but declined, albeit marginally on a m/m basis. Small and medium sized businesses have been particularly hard hit by the pandemic, with a number having shut their doors permanently. Medim commercial vehicle sales are up moderately m/m, however the heavy commercial category (which includes extra-heavy and buses) is down -7.0% m/m. A rebound in fixed investment should support growth in these categories.
Moreover, export sales, which are crucial to South Africa’s automotive sector, are up 65.8% y/y year-to-date. The pick-up in global growth, which is forecast to grow by 6.0% this year, according to the IMF should continue to support SA’s export market.

SA's trade account surplus beats expectations
30 June 2021
The surplus on the merchandise trade account widened to R54.6bn in May, from R51.25bn in April.
Supported by a 1.5% m/m lift in exports, SA's May trade surplus beat Bloomberg consensus expectations of a R49.6bn. Exports totalled R163.51bn, outpacing imports of R108.91bn (-0.9% m/m) .
A review of the trade highlights released by SARS suggests that the modest monthly pick-up in exports was buoyed by vegetable products as well as a recovery in global demand for vehicles and transport equipment. While some key import categories grew over the period, there was a notable decline in precious metals and stones.
May’s favourable reading is consistent with the results of JP Morgan’s global manufacturing PMI survey, which revealed that “new order growth accelerated to an 11-year high” in May. This despite persistent supply side constraints and accelerating input costs. Furthermore, the outlook for the sector remains favourable, “with manufacturers forecasting further increases in output over the next 12 months."
Indeed, global growth is forecast to rise by 6.0% this year, according to the IMF, supported in part by widespread vaccination drives and extensive fiscal support measures in advanced economies. Robust commodity prices and increasing global demand should continue to buoy export growth
However, while imports have been propped up by the rand and US dollar-denominated oil price, domestic consumption and investment activity remain relatively subdued. Furthermore, according to results from the May ABSA purchasing managers index, domestic purchasing managers “turned slightly less optimistic about the trading environment going forward." This is possibly driven by heightened concerns over the third wave. A rapid, efficient vaccination rollout is imperative to boost confidence and place SA on a sustainable growth path.

CPI inflation accelerated to 5.2% y/y
23 June 2021
CPI inflation increased to 5.2% y/y in May from 4.4% y/y previously on fuel price base effects and the higher oil price this year
The surplus on the merchandise trade account widened moderately to R54.6bn in May, from R51.25bn (revised) in April. The outcome was notably above Bloomberg consensus expectations of a R49.6bn surplus, supported by a 1.5% m/m lift in exports to R163.51bn, which outpaced imports of R108.91bn (-0.9%m/m) .
A review of the trade highlights released by SARS, suggests that the modest monthly pick-up in exports was largely buoyed by vegetable products and vehicles and transport equipment as global auto demand continues to recover. On the import side, while some categories of key imports grew over the period, a notable decline in precious metals and stones largely drove the contraction on the import side.
May’s favourable reading is supported by the results from JP Morgan’s global manufacturing PMI survey, which revealed that “new order growth accelerated to an 11-year high” in May. This despite persistent supply side constraints and accelerating input costs. Furthermore, the outlook for the sector remains favourable, “with manufacturers forecasting further increases in output over the next 12 months”.
Indeed, global growth is forecast to rise by 6.0% this year, according to the IMF supported in part by the widespread vaccination drive and extensive fiscal support measures in advanced economies. Robust commodity prices and increasing global demand should continue to buoy export growth
However, while imports have been propped up by the rand and US dollar denominated oil price, domestic consumption and investment activity remain relatively subdued. Moreover, according to results from the May ABSA purchasing managers index, domestic purchasing managers “turned slightly less optimistic about the trading environment going forward”, according to the BER. Heightened concerns over the third wave could be driving this. A rapid, efficient vaccination rollout is imperative to boost confidence and place SA on a sustainable growth path.

Commodity prices consolidate slightly after a heady run
15 June 2021
Commodity prices remain robust in June despite a slight weakening in industrials and metals
Commodity prices essentially retained their levels overall in June. On a disaggregated basis, however, some weakness in industrials and metals was counteracted by slightly higher agricultural food prices, with the result that commidities overall consolidated following a heady run that has lasted almost twelve months.
Commodity prices reached ten-year highs this year, very close to the 2011 peak of the 2000s commodity boom. This earlier commodity super cycle was driven by both accelerating demand from the rapidly growing emerging market economies (particularly the BRIC nations) and supply side constrains in the face of protracted growth in demand.
The Economist commodities price index shows a rise in 2000 from close to 60 index points to 189.7 in 2011. By comparison, the the index since April rose from 100.7 to 188.8. While currently not a super cycle, the acceleration since last year has been rapid.
Year on year, the index shows commodity prices are currently up 76% overall, while metals prices are up 93% y/y and industrials are 78% higher than a year ago. Non-food agricultural prices are 81% higher y/y.
Food commodity prices are only up a relatively modest 41% y/y, but it's a strong showing for a category which experienced deflation in many periods since 2011, driven higher over the last twelve months by growing global demand, along with the other commodities.
Indeed, the global PMI reached a fifteen year high in May, with demand for new orders and production output at the fastest pace since 2006, led by the US, the Euro area and the UK (as measured by the J.P. Morgan Global Composite Output Index).
International trade has strengthened materially, with new export business at a peak in the global composite J.P. Morgan PMI’s series, evidencing strong demand pressures persist, although supply shortages remain, and that price inflation is at its quickest pace since 2008.
With the FOMC meeting tomorrow evening, SA time, market expectations are for the Fed to potentially provide some deeper insight on its inflation views, which could feed market concerns on the timing of future QE tapering, although the Fed is likely to be judicious in this.

Annual manufacturing production rose sharply on base effects
10 June 2021
Manufacturing production climbed by an unprecedented 87.9% y/y in April, following March’s 5.2% y/y lift
Manufacturing production climbed by an unprecedented 87.9% y/y in April, following March’s 5.2% y/y (revised) lift, on the low statistical base effect produced in April 2020, triggered by Covid-19 related restrictions.
Specifically, manufacturing production plummeted by -48.7% y/y in April 2020 when rigorous level 5 measures were imposed to curb the infection rate, leading to a widespread halt in economic activity, except for those companies involved in the production and provision of essential goods and services.
Seasonal factors, with numerous public holidays falling within the month of April likely, largely underpinned the month-on-month decline in output. However, on a quarter on quarter seasonally adjusted basis (qqsa), which is the measure used to calculate GDP, manufacturing output was still up by 0.9%.
A disaggregation of the manufacturing data indicates that the food and beverage sector, as well as the motor vehicle and parts category, were primarily responsible for the quarter-on-quarter seasonally adjusted lift. Combined they added 2.0% points, on the back of growth of 3.4% qqsa and 11.1% qqsa respectively. Conversely petroleum and chemical products' output fell by -4.0% qqsa and based on its significant weighting in the manufacturing basket, detracted -0.8% points from the outcome.
Advance indications provided by the Absa PMI manufacturing survey for May indicate that business activity picked up again in May, boosted by new sales orders, recovering April’s losses. However, worryingly prospects with respect to future business conditions declined, despite circumstances improving. Concerns around a “renewed virus-induced change in spending behaviour by consumers and firms” hindering demand as the third wave builds, was cited as a probable explanation by the BER. Additionally, rotational load shedding continues to cloud sentiment.
Eskom’s Energy Availability Factor which shows the utility’s available output to the grid for consumption versus its total potential capacity has been below 70% since Q3.20, with Q2.21 showing plant performance at an EAF of closer to 64% (data to early June). Indeed, unreliable electricity supply remains one of the biggest downside risks to economic growth domestically.

Electricity supply constraints remain a downside risk to growth
3 June 2021
Production and consumption of electricity rose by 25.6% y/y and 25.7% y/y respectively in April, but this is compared to harsh lockdown conditions last year.
April's significant y/y increase in electricity demand and supply comes off a low base. In April of last year, generation and distribution of electricity plunged by -22.8% y/y and -23.3% y/y respectively as economic actvity contracted under the harsh lockdown imposed in late March. Measured on a month-on-month basis, April 2021 production was down -1.8%, while consumption slid by -2.4%.
The Energy Availability Factor (EAF) -- the percentage of SA's total theoretical generation capacity available to the grid -- did improve somewhat in May and June of last year, but has been below the 70% mark since the start of Q3.20 and is averaging just 60.90% year-to-date. Electricity shortages are expected to continue, with Eskom’s CEO reiterating at March’s State of the System briefing that, “there will continue to be an electricity supply shortfall of approximately 4,000MW over the next five years.” The high demand winter period will see further supply disruptions, according to Eskom. The latest bout of load shedding is a case in point, caused by the depletion of emergency generation reserves and breakdowns at several generation units.
Unreliable electricity supply remains one of the biggest downside risks to domestic economic growth. It continues to hinder businesses (especially smaller players), already struggling to stay afloat after the devastating financial effects of the pandemic.
The cash-strapped power utility did reduce its debt burden by R83bn in the 2020/2021 financial year, “due to the repayment of the maturing debt and changes in the exchange rate,” according to Minister Pravin Gordhan. However, Eskom’s R410bn debt continues to be a huge strain on the country’s fiscus and a key concern for credit rating agencies.

The PMI gauge rose by 1.6 index points in May
1 June 2021
Headline Purchasing Managers’ index (PMI) moving further into positive territory, with a reading of 57.8
The seasonally adjusted (SA) headline Purchasing Managers’ index (PMI) increased by 1.6% points to 57.8 in May 2021. Four of the five sub-indices remained above the neutral 50-point mark, barring the employment index which fell back into negative territory. Q2.21’s performance thus far, which is 3.2 points up on Q4.20’s outcome, “suggests that the sector is on track to record another quarterly expansion”.
Business activity recovered its April losses, rising by 8 points to 58.8 in May 2021, largely on the back of a notable pick up in new sales orders. Specifically, the new sales index climbed to 60.5 from 58.7 recorded in April, likely buoyed by domestic demand as survey respondents reported a decline in export activity. Despite the pick-up in business activity the employment index fell back into negative territory with a reading of 49.6. Joblessness continues to aggravate the financial pressure many households are already experiencing, against a muted economic background. Indeed, the official unemployment rate reached 32.6% in Q1.21.
Manufacturing cost pressures as measured by the purchasing price index declined slightly in May, but remained elevated at 87.1, markedly above last year’s average of 73 points. Specifically, the “recent high readings of the price index correspond to the official producer price index (PPI) data published by Stats SA,” which saw annual PPI for final manufactured goods climb to 6.7% y/y in April, from 5.2% y/y previously.
Prospects with respect to future business conditions declined in May, despite circumstances improving, with the index tracking expected business conditions in six months’ time falling from 67.9 in April to 63.5 in May. Concerns around a “renewed virus-induced change in spending behaviour by consumers and firms” hindering demand as the third wave builds, was cited as a probable explanation by the BER. Additionally, rotational load shedding continues to cloud sentiment.
Get all Investec's insights on the latest Budget Speech and SONA
Our economists, tax experts, personal finance and investment experts unpack what the latest fiscal measures mean for income, savings and daily expenses of individuals and businesses.
About the author

Annabel Bishop
Chief Economist of Investec Ltd
Annabel holds an MCom Cum Laude (Economics and econometrics) and has worked in the macroeconomic, risk, financial market and econometric fields, among others, for around 25 years. Working in the economic field at Investec, Annabel heads up a team, which focusses on the macroeconomic, financial market and global impact on the domestic environment. She authors a wide range of in-house and external articles published both abroad and in South Africa.

